If you’re into trading or investing, you’ve probably heard about moving average strategies. These strategies are widely utilized in trading systems. If you’ve ever spent even a brief amount of time studying or reading price charts, you’ve probably observed that a stock’s price tends to go up and down. Fast-moving markets can cause the price to spike upwards before falling and then rising again, increasing the possibility of false signals. To see the average value, the moving average can assist smooth out and filtering out the noise caused by unpredictable price movements. A moving average strategy can commonly be seen within trading systems, largely due to their ability to boost the signals of a trading system.
What are Moving Averages?
Moving averages are utilized to spot trends and verify trend reversals. We consider an uptrend on the chart if the price is above the moving average line. On the other hand, we consider a price to be in a downtrend if it is below the moving average line. Furthermore, a trend reversal is typically implied by the breaking of the moving average line.
Moving averages are lagging indicators since they are based on historical prices. The lag increases with the increasing moving average period. As a result, it won’t inform you beforehand but will confirm when a trend change has occurred. Traders see the price crossing up and over the moving average as a buy signal. On the other hand, if it falls beneath the moving average line, it is seen as a sell signal.
Moving Average Strategy: Following the trend
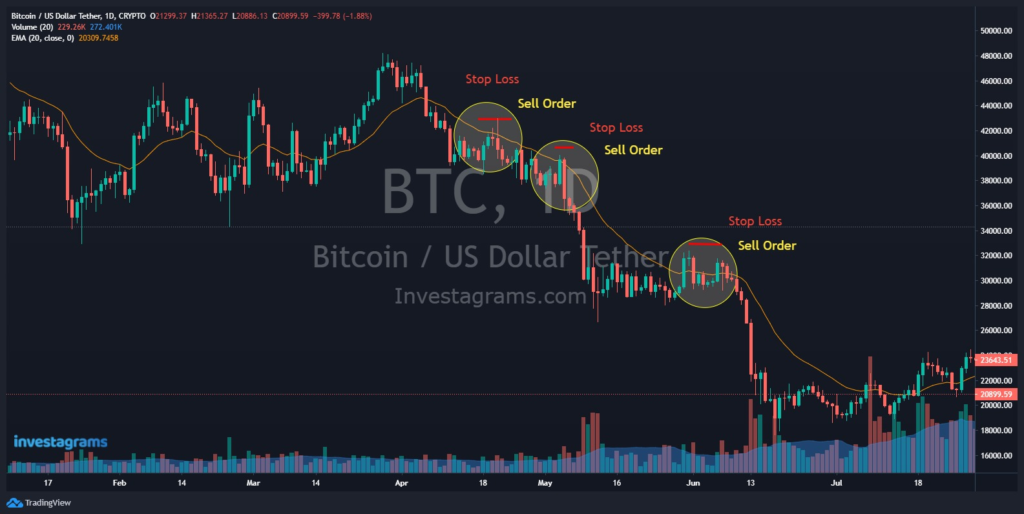
Since we know that moving averages tend to act as dynamic supports and resistances, we can use this as part of our strategy. For example, down trending charts would tell you to sell when prices reach your moving average. If you’re shorting, you can also use the same moving average as a guide. By putting a stop-loss above the moving average, you can protect your shorts.
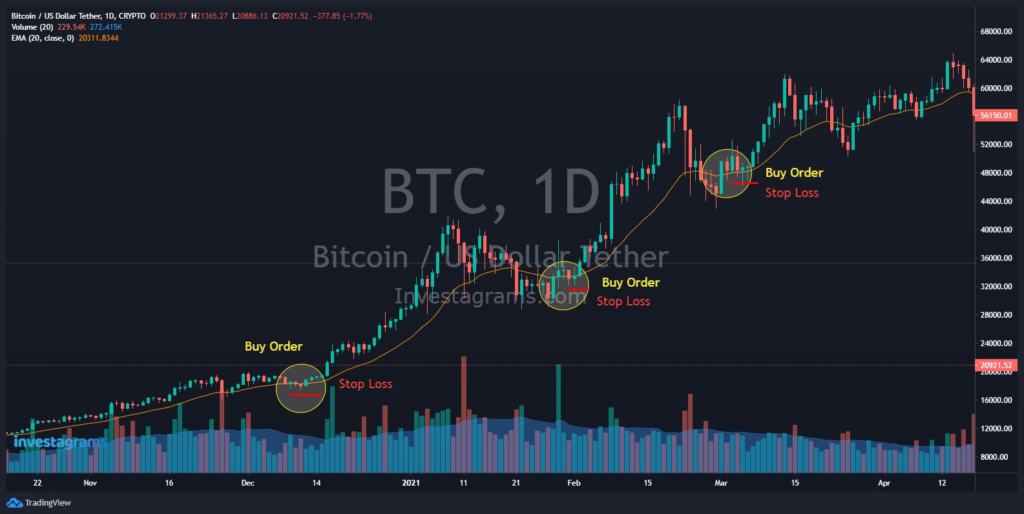
Conversely, if the chart is on an uptrend, you can use moving averages as a guide. If your system involves buying at support when following the trend, you can look for the moving average that tends to act as the stock’s dynamic support. Of course, the same moving average would also tell you where you can place a meaningful stop loss.
This strategy might seem simple, but don’t let the simplicity fool you. The systems of some prominent traders revolve heavily around this tactic. When combined with proper risk management and a deep understanding of trends, this can produce a very strong technical system.
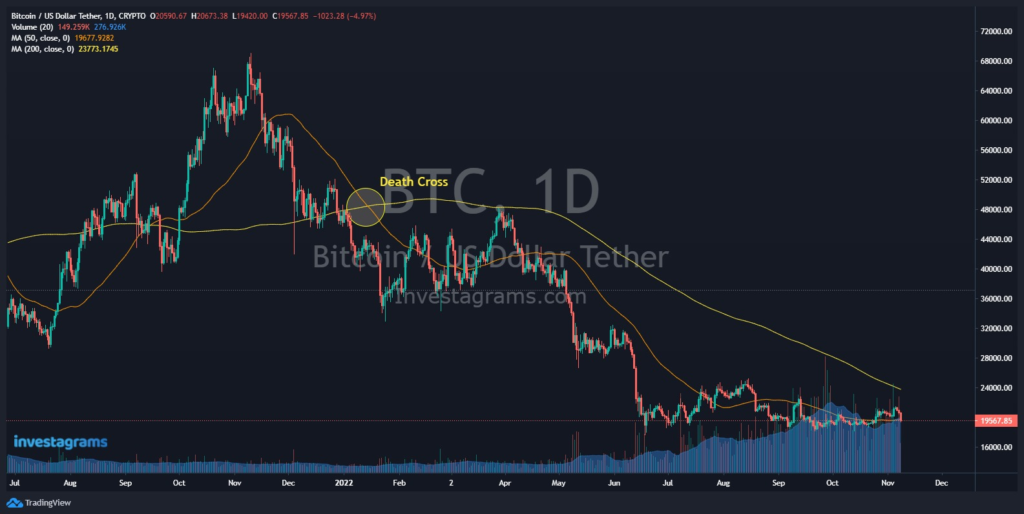
Moving Average Strategies: The Golden Cross and Death Cross
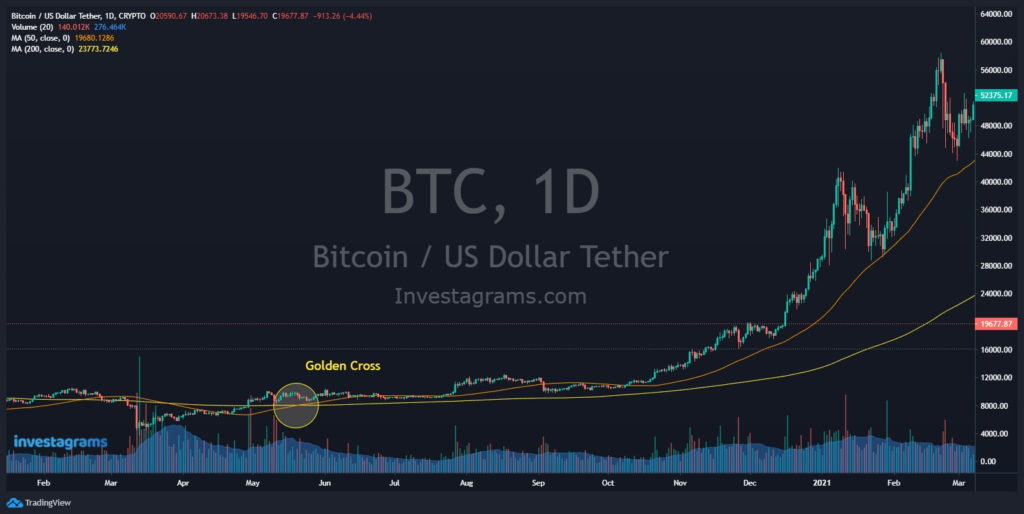
The Golden Cross can be used by traders to help them choose the best time to enter and exit the market. When an asset’s 50-day short-term moving average exceeds its 100-day long-term moving average, a Golden Cross, a technical indicator, appears in the market (200-day). A Golden Cross on a chart is regarded by traders as a sign of a strong bull market.
Additionally, traders can use the indicator as a tool to better understand when it makes sense to sell and when it’s preferable for them to buy and hold.
Buyers may occasionally enter the market when a security’s price rises over the 200-day moving average rather than waiting for the crossover of the 50-day moving average. This is because there is a chance that the Golden Cross will be a relatively lagging indicator.
Conversely, the death cross marks the change from a bull market to a bear market. This technical sign appears if a security’s short-term moving average (such as the 50-day) crosses a long-term moving average from above to below the 200-day.
Trading volume is one of the most widely used technical indicators to confirm a long-term trend change. If the bearish cross pattern is accompanied by substantial trade volume, it is regarded as a more reliable indicator.
Moving Average Strategy: Combining different MA lengths
One of the common mistakes for new traders is that they are confused about which Moving Average to use. This can be a problem for many, and may even affect trades in the long run. Not only that, but traders also often don’t know how many to use. Some use too many in the hopes that bombarding charts with indicators will lead them to profits. There are many ways to mix and match which moving averages to use and how many. However, it all boils down to functionality. In short, will your slew of indicators help you in making decisions? If properly incorporated into a system, even using just one moving average can net you big profits in the market. What you need to focus on is learning the use cases of each moving average, and identifying how they fit your trading style.
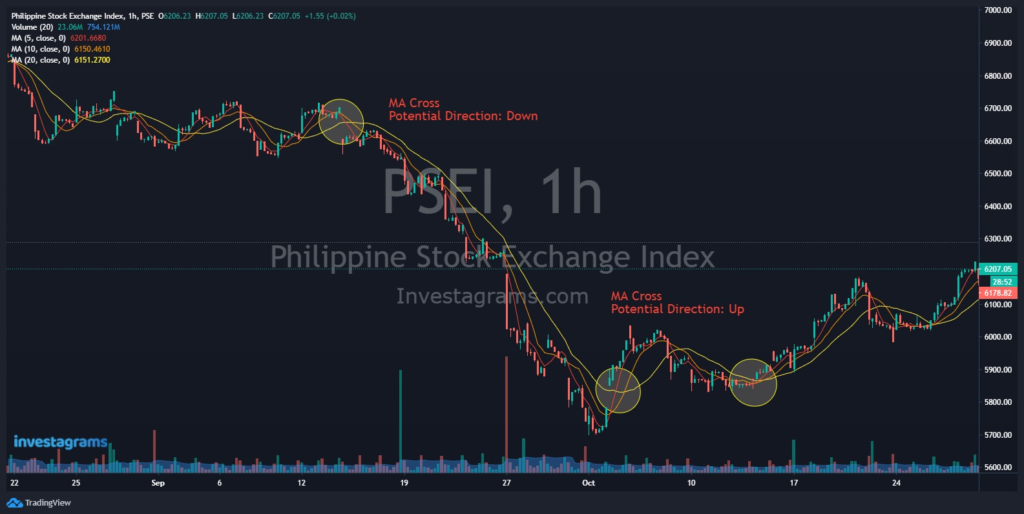
The most popular moving averages for identifying significant, long-term support and resistance levels as well as broad trends are the 50-day, 100-day, and 200-day moving averages. These longer-term moving averages are thought to be more accurate trend indicators and less prone to transient price changes based on historical data.
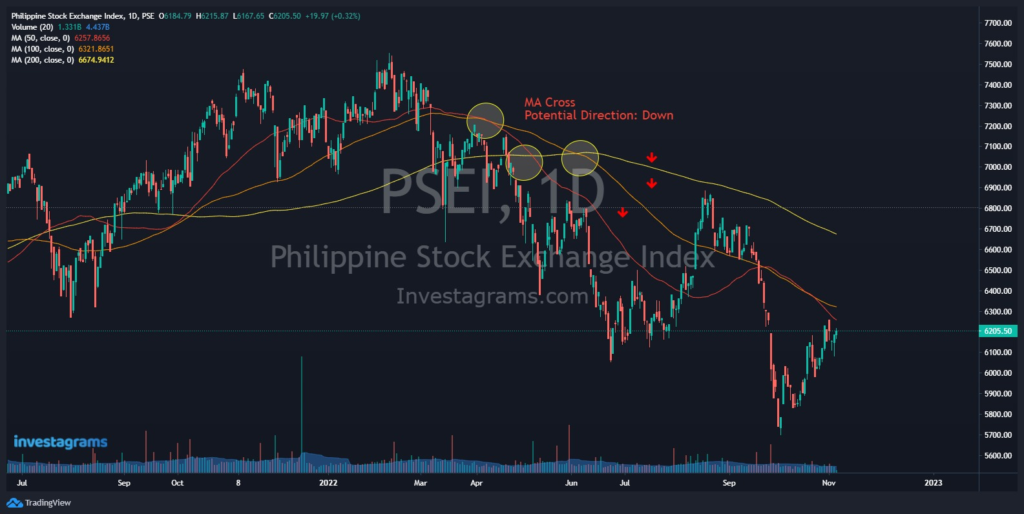
On the other hand, the 5,10, 20, and 50 Moving Average is used to spot near-term trend changes. These short-term moving averages can be used as possible clues to spot long-term trend changes. A crossover by the 50 moving average to the 20 or 10 is considered significant in identifying trend changes. The moving average strategy of combining different length MAs can be powerful as it will give you a wide variety of information regarding the trend.
Moving Average Strategy: Using the MACD as a pullback indicator
One indicator that utilizes moving averages is called the MACD or “Moving Average Convergence Divergence,” created by Gerald Appel. The MACD is an indicator for identifying moving averages that are signaling a new trend, whether it is bullish or bearish.
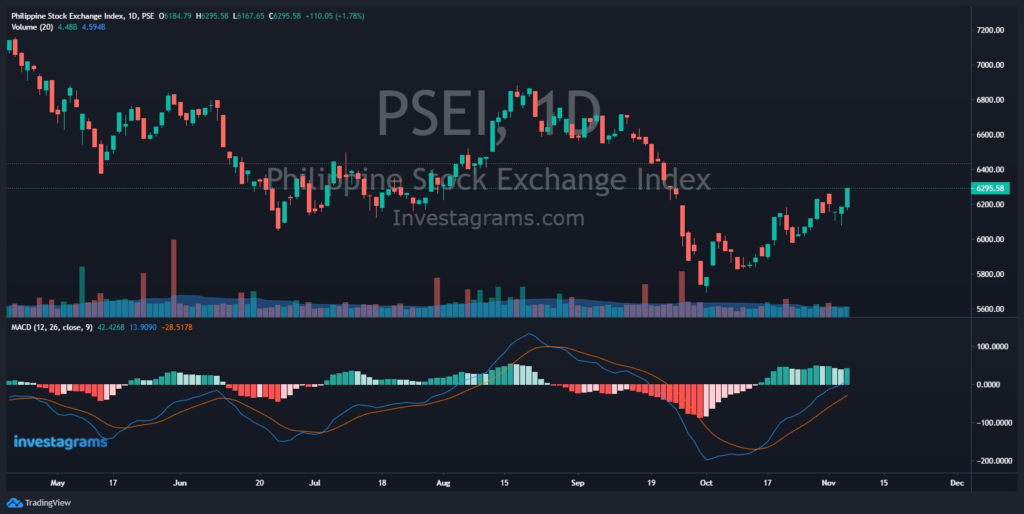
The MACD is commonly used by placing buys whenever a MACD-signal line crossover occurs. However, a technique you can also use with the MACD is to identify when consolidations within uptrends are about to end.
In uptrends, we want to see short-term profit takers be shaken out of the market during pullbacks. The MACD going closer to 0 signals that there are fewer short-term traders in the market, since by this time the shorter moving averages have already been broken, triggering trailing stops. Therefore, you can use the MACD as a gauge to see if the consolidation is near its end. However, take note that this is for longer consolidations. Momentum patterns like bullish flags and the like most of the time don’t cause the MACD to go back near 0.
Last Remarks
By utilizing moving average strategies, you will be able to identify if a trend is going up, down or if it’s ranging. It can tell you if a trend is still in motion and if it is reversing or losing momentum. Technical indicators such as the exponential moving average (EMA) and simple moving average (SMA) create a smooth trend line for the price of an asset using historical data.
It’s essential to remember that no moving average is a better indicator than the others. Going deeper, it’s also important to note that no specific strategy is absolutely stronger than another. It comes down to which tactic fits your style of trading and can blend with your system.
Want to learn more lessons to help you build a crisis-proof system? Check out the Investa Summit 2022: Opportunities in Crisis! Our world-class and industry-leading speakers will be giving you in-depth experiences and lessons on the bear market we’re facing, and how we can find opportunities moving forward.