
Similar to how doctors have X-rays and MRIs, tools are also needed to navigate the markets. Among the different methods traders and investors can use, technical analysis is the technique not known to many of the masses. Despite this, it has still proven to be a powerful tool as many of the great traders across history have used it in their own unique ways.
What is technical analysis?
For those unaware, technical analysis is basically the study of price and volume in order to understand where prices might go in the future. Through the use of charts and indicators, traders and investors can assess what they need to do.
The beauty with technical analysis is that it lets traders creatively pinpoint how demand and supply will play out in the market. It might look intimidating at first, but reading and plotting charts out isn’t rocket science. You just need to learn the foundations and know how to apply them as your trading system progresses. However, as with all techniques there are some common mistakes that are often made. Here are some of them and how you can avoid them to really make the most out of your trades.
Common Technical Analysis mistakes
Using too many indicators
When people first employ Technical Analysis in their trading, most think of the same image: a chart full of lines and indicators. Often taken from media, people often have the idea that using charts require the use of complex drawings and the like. However, this is very far from the truth of what effective Technical Analysis looks like. When using Technical Analysis, you have to remember that indicators are only tools. In the end, you are the one that tries to identify what the market’s current situation is. Indicators only serve as helpers in helping you figure it out.
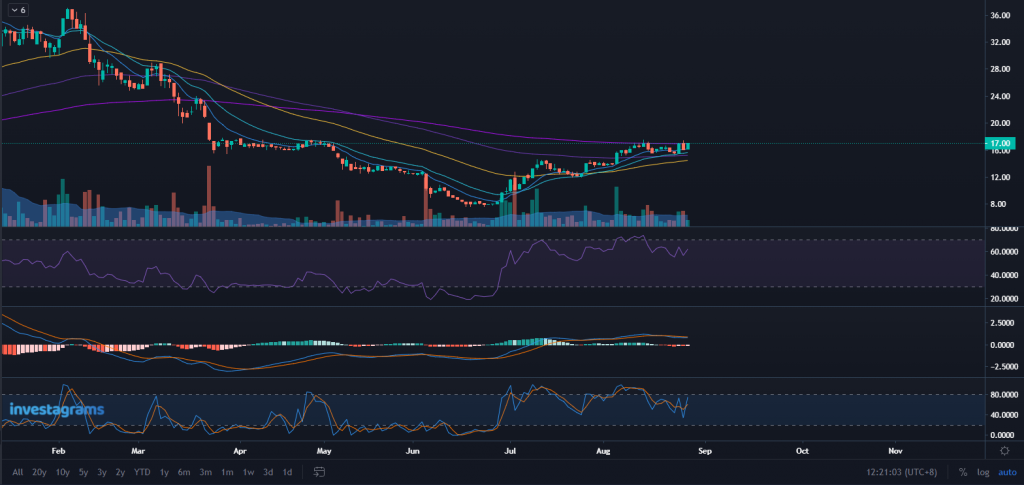
For example, using a chart like the one shown might make you look cool to non-traders, but will it really help you? Professional traders often have two or three different indicators, but you need to realize that each one serves a purpose. Adding indicators should serve the purpose of making it easier for you to gain crucial information. If an indicator you added does little to help you analyze the market’s condition, then maybe its time to take it out. Remember: price is king and volume is queen. Indicators only exist to serve these two..
Not understanding the foundations of Technical Analysis
Somewhat related to the overuse of indicators, traders often fail to understand the foundations of Technical Analysis. Although the basic tennants are easy to learn, only a few master the concepts. It’s not uncommon for the basics to be rushed in order to go towards more exciting and advanced theories. While learning advanced concepts can be helpful, the basics will always serve as the foundation for progress. For example, if in the act of learning complex patterns you start to become unaware of supports and resistances, start thinking twice on how you should proceed.
How basic a chart looks like doesn’t determine the potency to make a profit. In the end, its a better understanding of price action that allows traders to use charts to the fullest.
Lack of flexibility
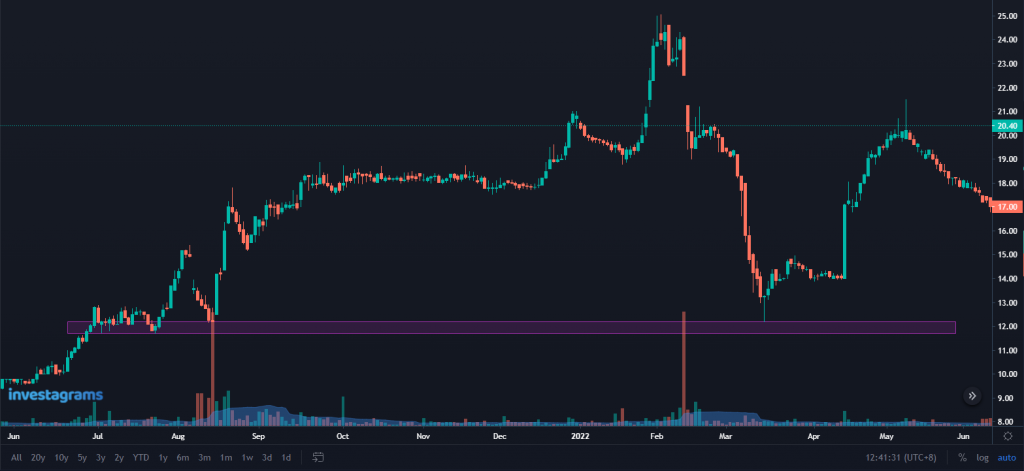
Understanding patterns of behavior within the market is the core of technical analysis. In a sense, we go through the history of the markets in order to understand how it might move in the future. However, as Mark Twain famously said: “history doesn’t repeat itself, but it rhymes.” A common pitfall in using technical analysis is that traders think the market will react in the exact same way as before. Although the markets behave the same way even as time passes, patterns won’t exactly replicate one another. Flexibility is needed in order to adjust to the small changes that occur in how prices move. People often rely too much on the possibility of a pattern happening again in the exact same way. So much so that opportunities are lost, or trades fail.
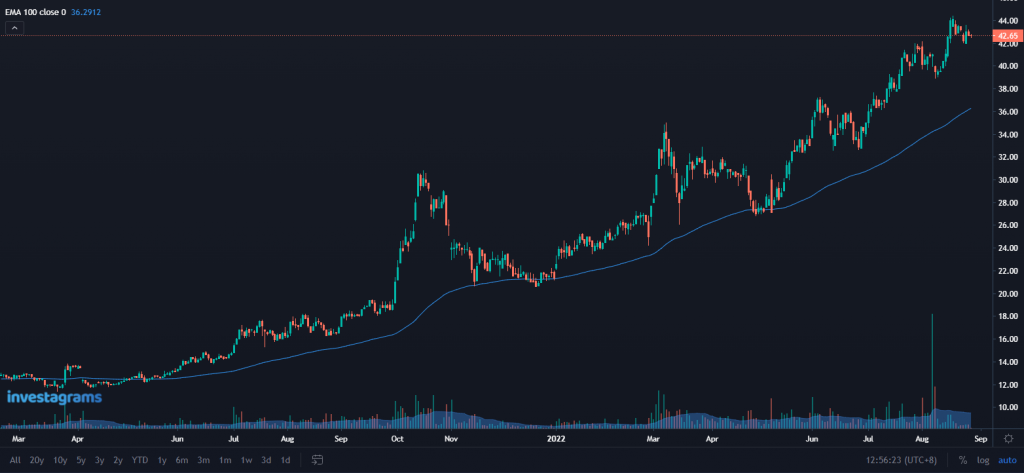
In the example above, if a trader were to rely too much on the pattern that retracements occurred at the 100-day exponential moving average, then he or she would’ve missed the chance to make a profit on the latter rally.
Biases
The problem with biases is straightforward. One example is when a trader starts to favor a stock above the rest, every signal starts to become bullish. There are many kinds of biases than the one mentioned above. Each one just as dangerous as the other. Having biases takes away a traders ability to objectively analyze the market.
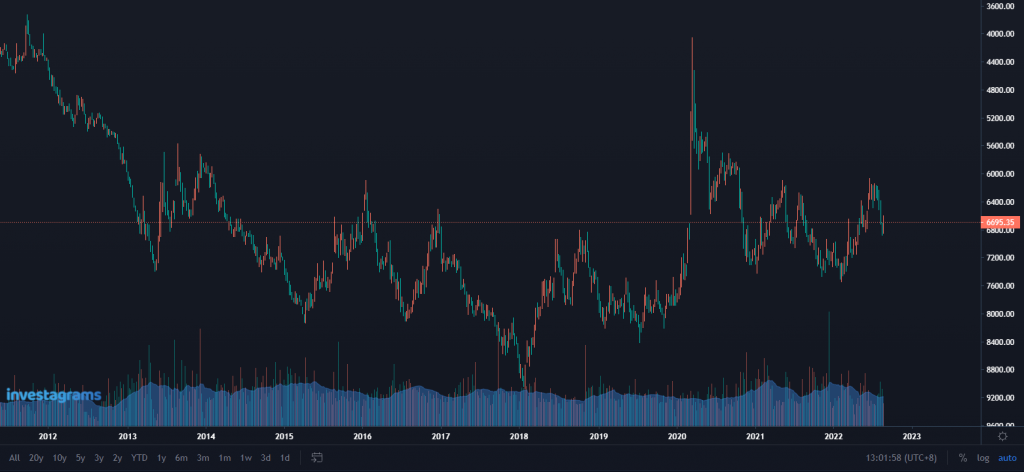
Take a look at the picture above. Are you bullish or bearish? Once you’ve made your choice, read the next line.
The chart shown above is the $PSEi weekly chart inverted upside down. Disregarding the color of the bars and looking only at how the chart has formed, can you still give the same answer before you found out? Different biases will incur different problems for traders. However, the generalized solution to solve biases is to become as objective as possible in your decision making process.
Ignoring macro conditions
Lastly, a fatal flaw that many encounter is failing to recognize macro conditions. Discounting macro events, many traders, especially beginners, fail to even chart indices as part of their planning process. Looking at the price action of individual stocks and other assets is important. However, you need to realize that how the broader market moves will impact the behavior of whatever your trading. Often times, extreme moves in the stock market index or other benchmarks will cause the strongest price action patterns to fail and even reverse the trend.
At the very least, make sure that you’re always aware of how market benchmarks/indices are moving. They will help you determine if its time brace your portfolio for an upcoming sell-off. Of course, they will also let you know when its time to start aggressively buying your top picks.
The journey ahead

In your trading journey, you will encounter many unique styles of trading. Each one often different in some way to another. Even if two traders use technical analysis and use the same indicators or patterns, nuances will still be spotted. The most important thing you need to remember is that you need to find a style of trading suitable for you. You need to establish your own understanding of the market that will help you create a process in making trading decisions. When you find one, make sure that you master it first rather than seeking other ways to trade. As the saying goes, “I fear not the man who has practiced 10,000 kicks one, but I fear the man who has practiced one kick 10,000 times.”
Invest to build a better future and learn continuously to improve yourself.
Join our #InvestorDay 9.9 and get a chance to win LIFETIME ACCESS to our InvestaFest premium recorded videos and have the opportunity to learn straight from top traders, entrepreneurs, industry leaders in the country!
To join, simply:
1. Download Investa app
2. Complete application
3. Invest for as low as Php 1,000.00 to claim your 150 raffle tickets
You can invest as much as you want on or before September 9 and claim unlimited raffle tickets!
Invest today: http://invs.st/IVGWInvestorDay99Daily