When it comes to Technical Analysis, we’ve most likely encountered or heard the term Moving Averages (MA). To break it down very simply, all Moving Averages are as exactly as they sound – it is the average movement of a price over a given period of time. It is one of the most popular technical indicators used to gauge the direction of a trend.
In layman’s term, think of it as your basic math in elementary days where you compute for your average grade. (Addition and Division):
Here’s an example:
Grades in different subjects: 75, 80, 85, 90, 95
To get the average: (75 + 80 + 85 + 90 + 95) / 5
Average grade score = 85
Calculation also applies the same in stocks i.e.:
5 MA = average price for the last 5 days
10 MA = average price or the last 10 days
and so on
If the current price of your stock is 3, and in the last 5 days it goes from
(Day 1) 1, (Day 2) 3, (Day 3) 2, (Day 4) 4, (Day 5) 5
Then the average price of your stock now is 3 based on the computed average: (1 + 3 + 2 + 4 + 5) / 5
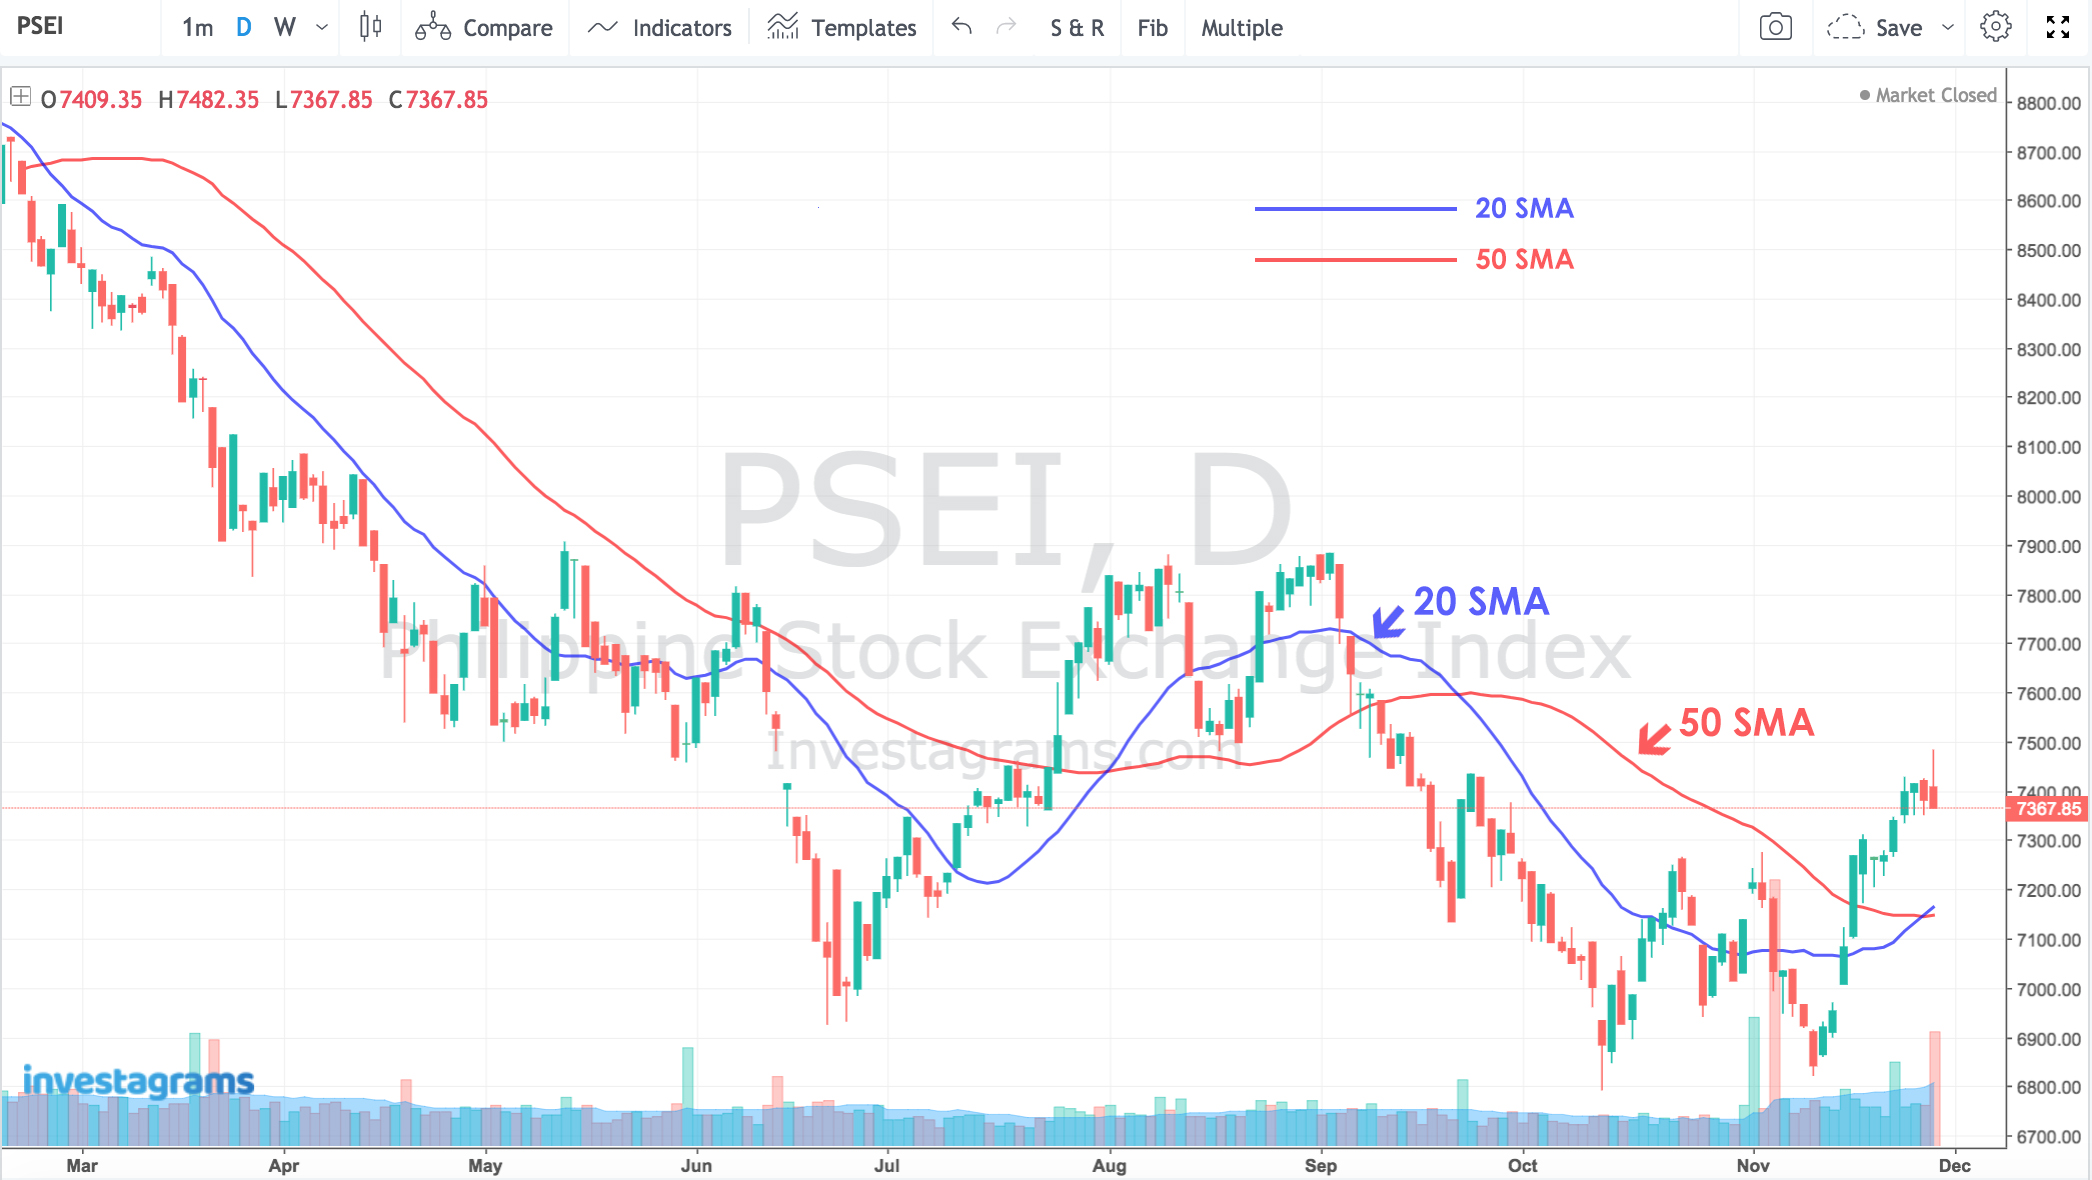
Chart-1. Simple Moving Averages
Moving Averages follows the stock’s price movement. It tells you where the stock price is heading. So if you want to get the 20 MA of a stock, then you need to add up the past 20 days from the closing price and then divide the result by 20 days, same goes with 50, or even 100 days of the price movement.
Two Common Types of Moving Averages
1. Simple Moving Average (SMA): The simplest form of MA where a set of prices are added together and divided by the number of prices in the set. Each average of SMA is connected to the next stock price creating the singular flowing line (sample as discussed above).
2. Exponential Moving Average (EMA): A bit more complex as it gives more weighted average to the latest stock prices to make it more responsive.
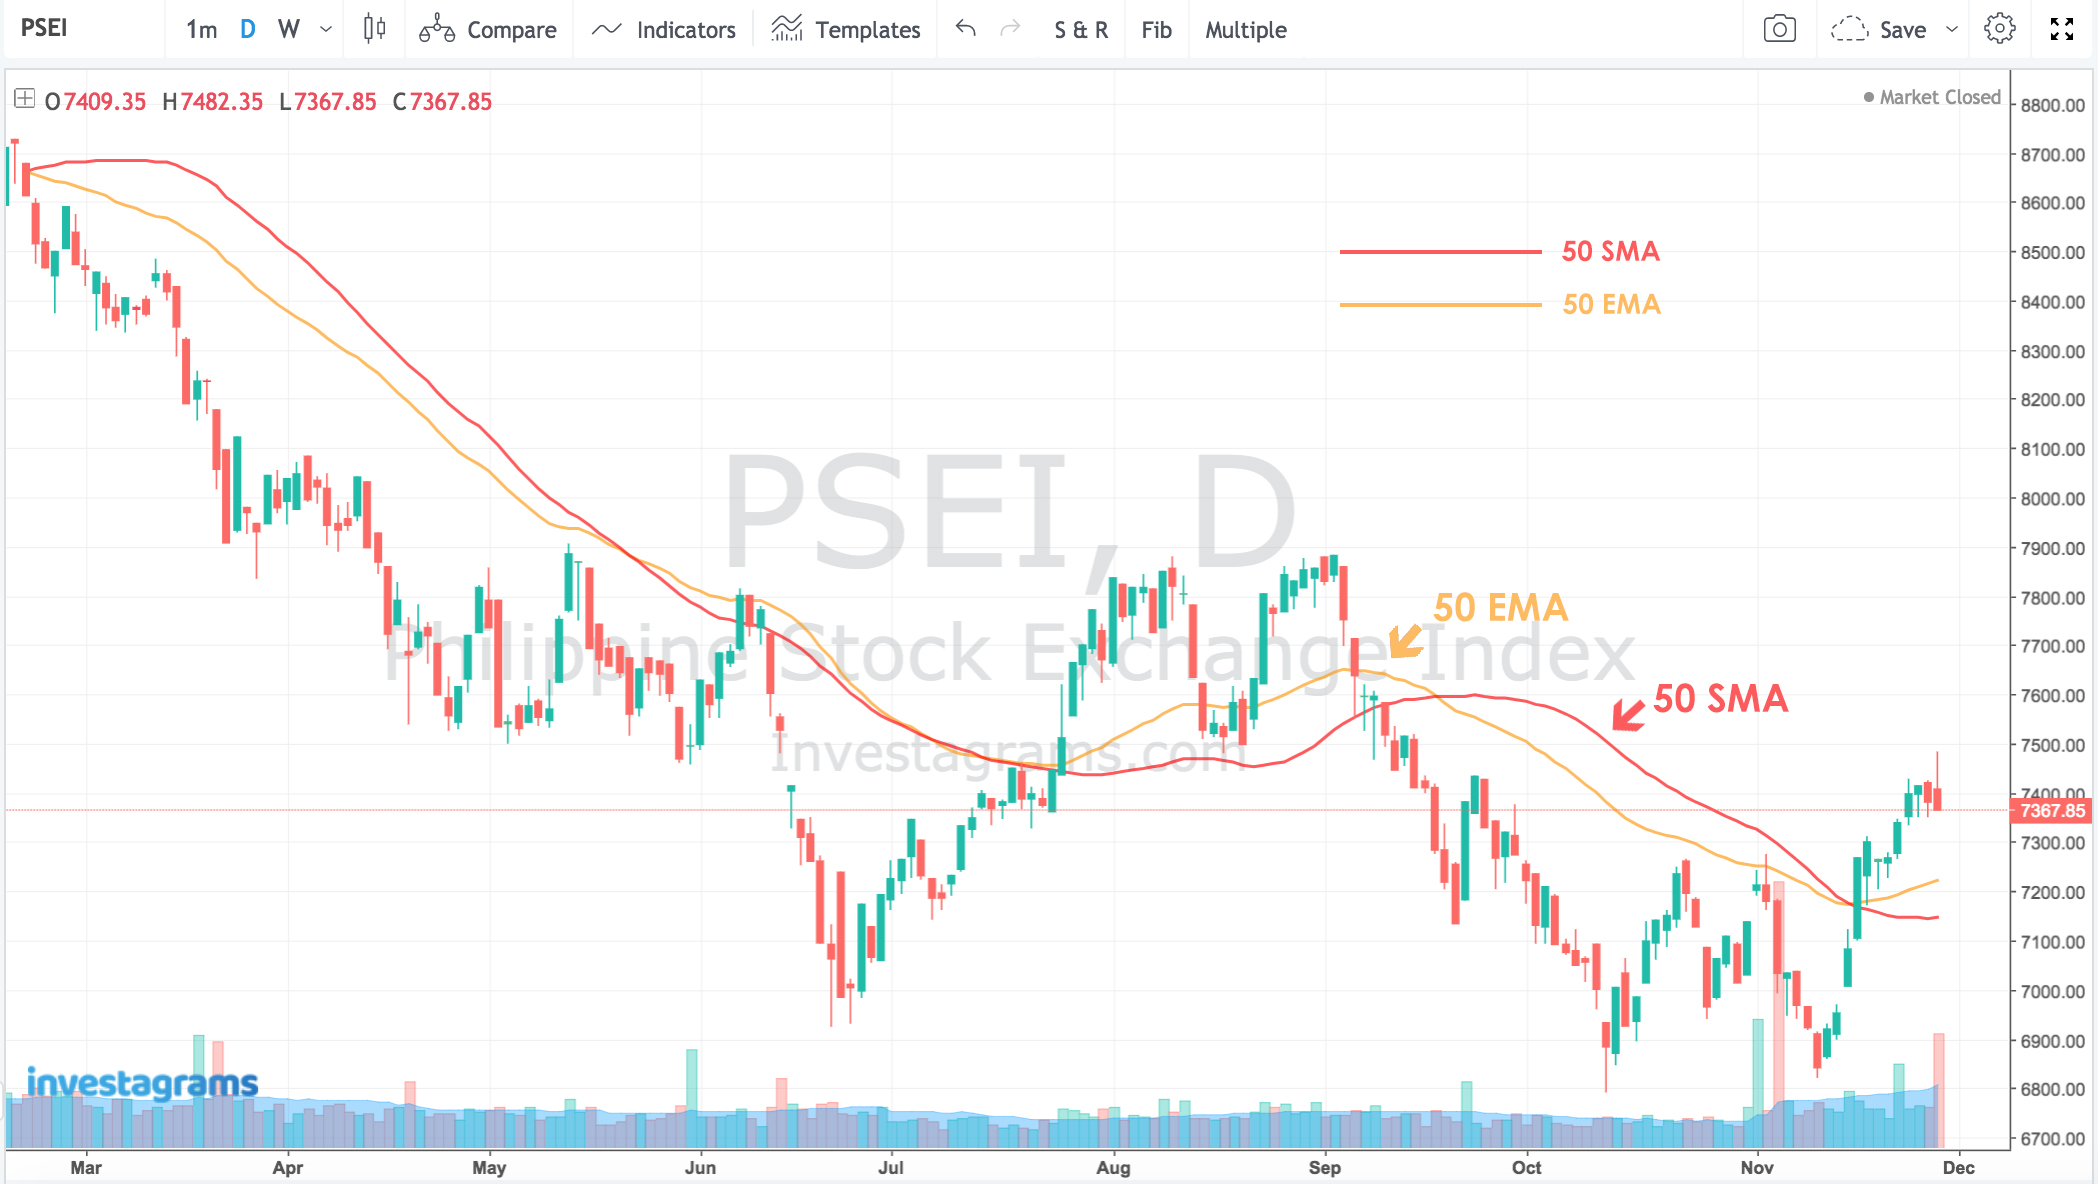
Chart-2. SMA vs EMA
Difference between Simple Moving Averages versus Exponential Moving Averages
SMA moves a little bit slower than EMA. As EMA moves faster, you’ll notice that it gives more emphasis on the recent data points making it more significant to a weighted average. Most traders leverage EMA as part of day trades. For SMA, it tends to be more applicable to swing or position trades.
You can explore the differences of these two by changing the chart’s time frames. You can also adjust it from 5 day MA to 10, to 20, to 50, 100 and many other averages depending on what kind of system you would want to trade.
How to Use a Moving Average when Trading
In this article, we will use the Simple Moving Average to find out the direction of a moving average of a stock to get the basic idea of how the price will move on the chart.
The Crossovers
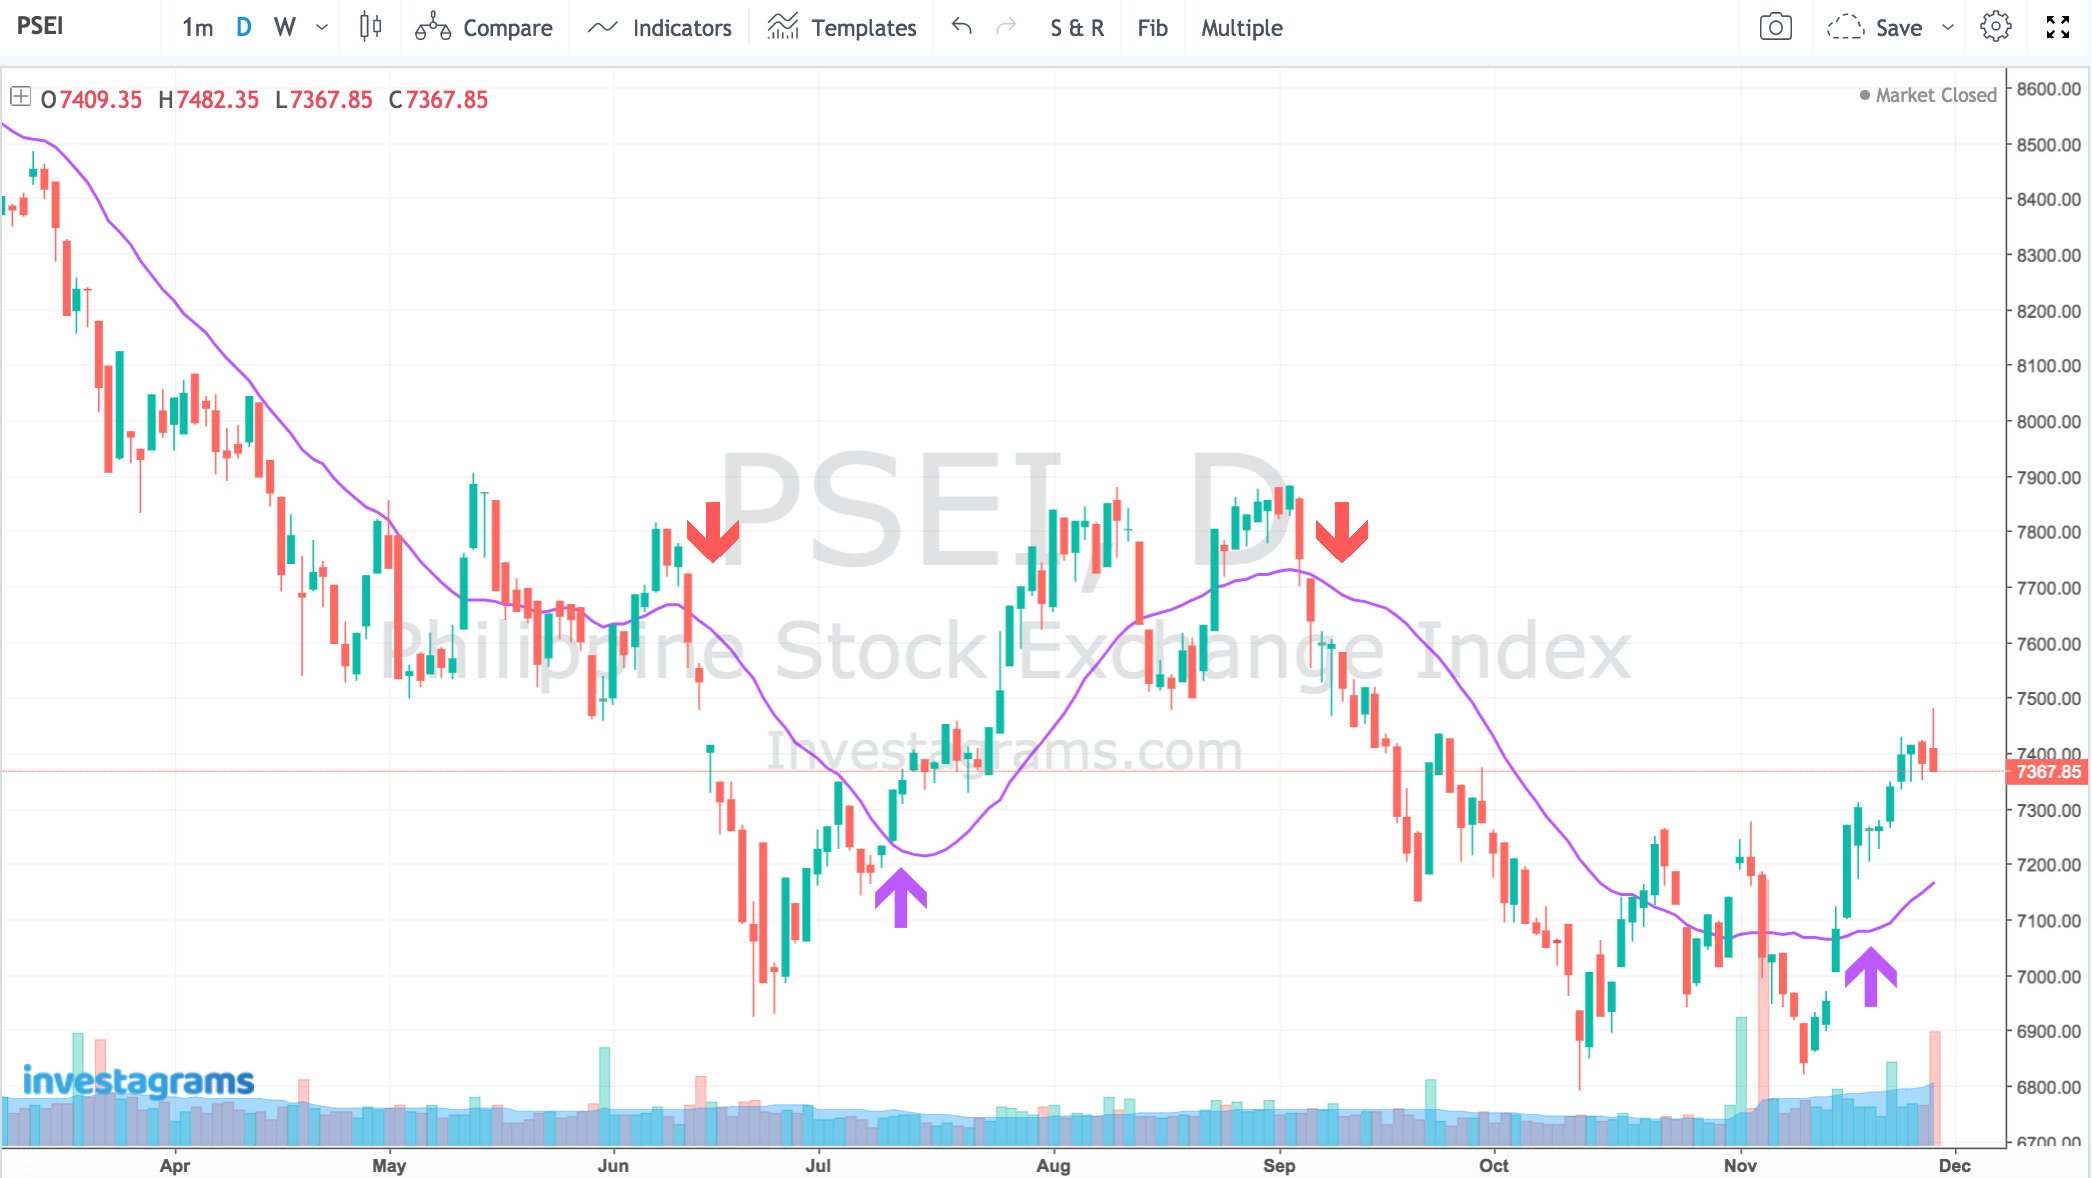
Chart-3. Price Crossover
If you see that the price is currently above or below the moving average, then it is a signal to a potential change in trend.
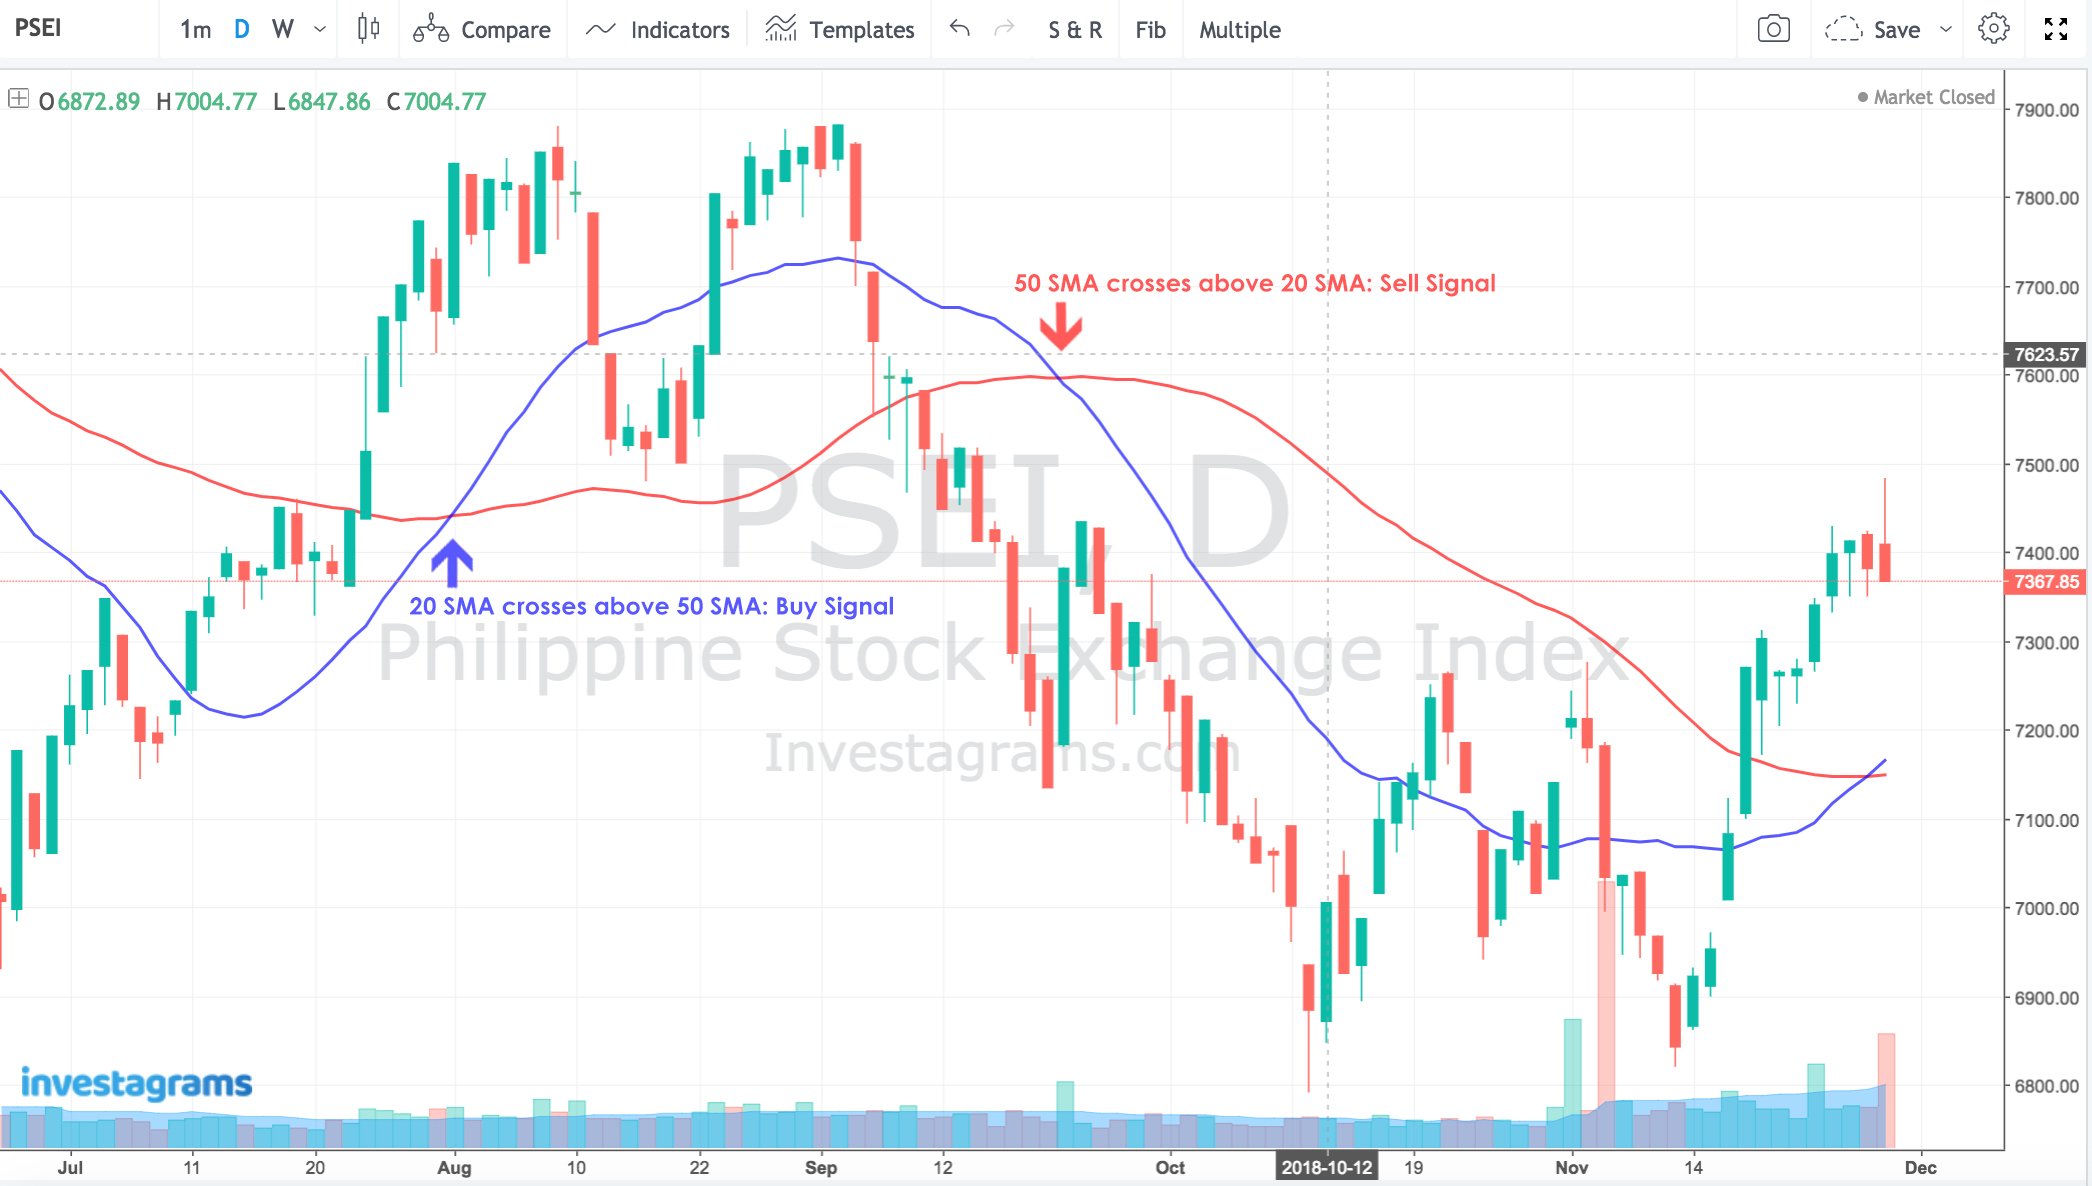
Chart-4. MA Crossover
Another strategy is when your short term MA (i.e. 20 MA shown above) is crosses above your long term MA (i.e. 50 MA), then it is a buy signal and the stock is uptrend. If the price of your 50 MA goes above 20 MA, then it’s a sell signal and indicates downtrend.
So there, we can now identify which stocks is on an uptrend and downward movement, but did you know that aside from identifying the trends, we can also use MA as dynamic support and resistance? Here it goes:
Moving Averages as Support and Resistance
Let’s take a look at the example from Chart-5 below for $TEL, the prices have gone up and down but the 100 MA is steadily moving up. You may notice that the stock price of $TEL comes near the 100 MA and then bounces back up and rejecting the trend to reverse its signal. In this case, this moving average is always the strong area of support. At the retracements near MA, buying opportunities are presented because the moving average acts as a support of a the stock.
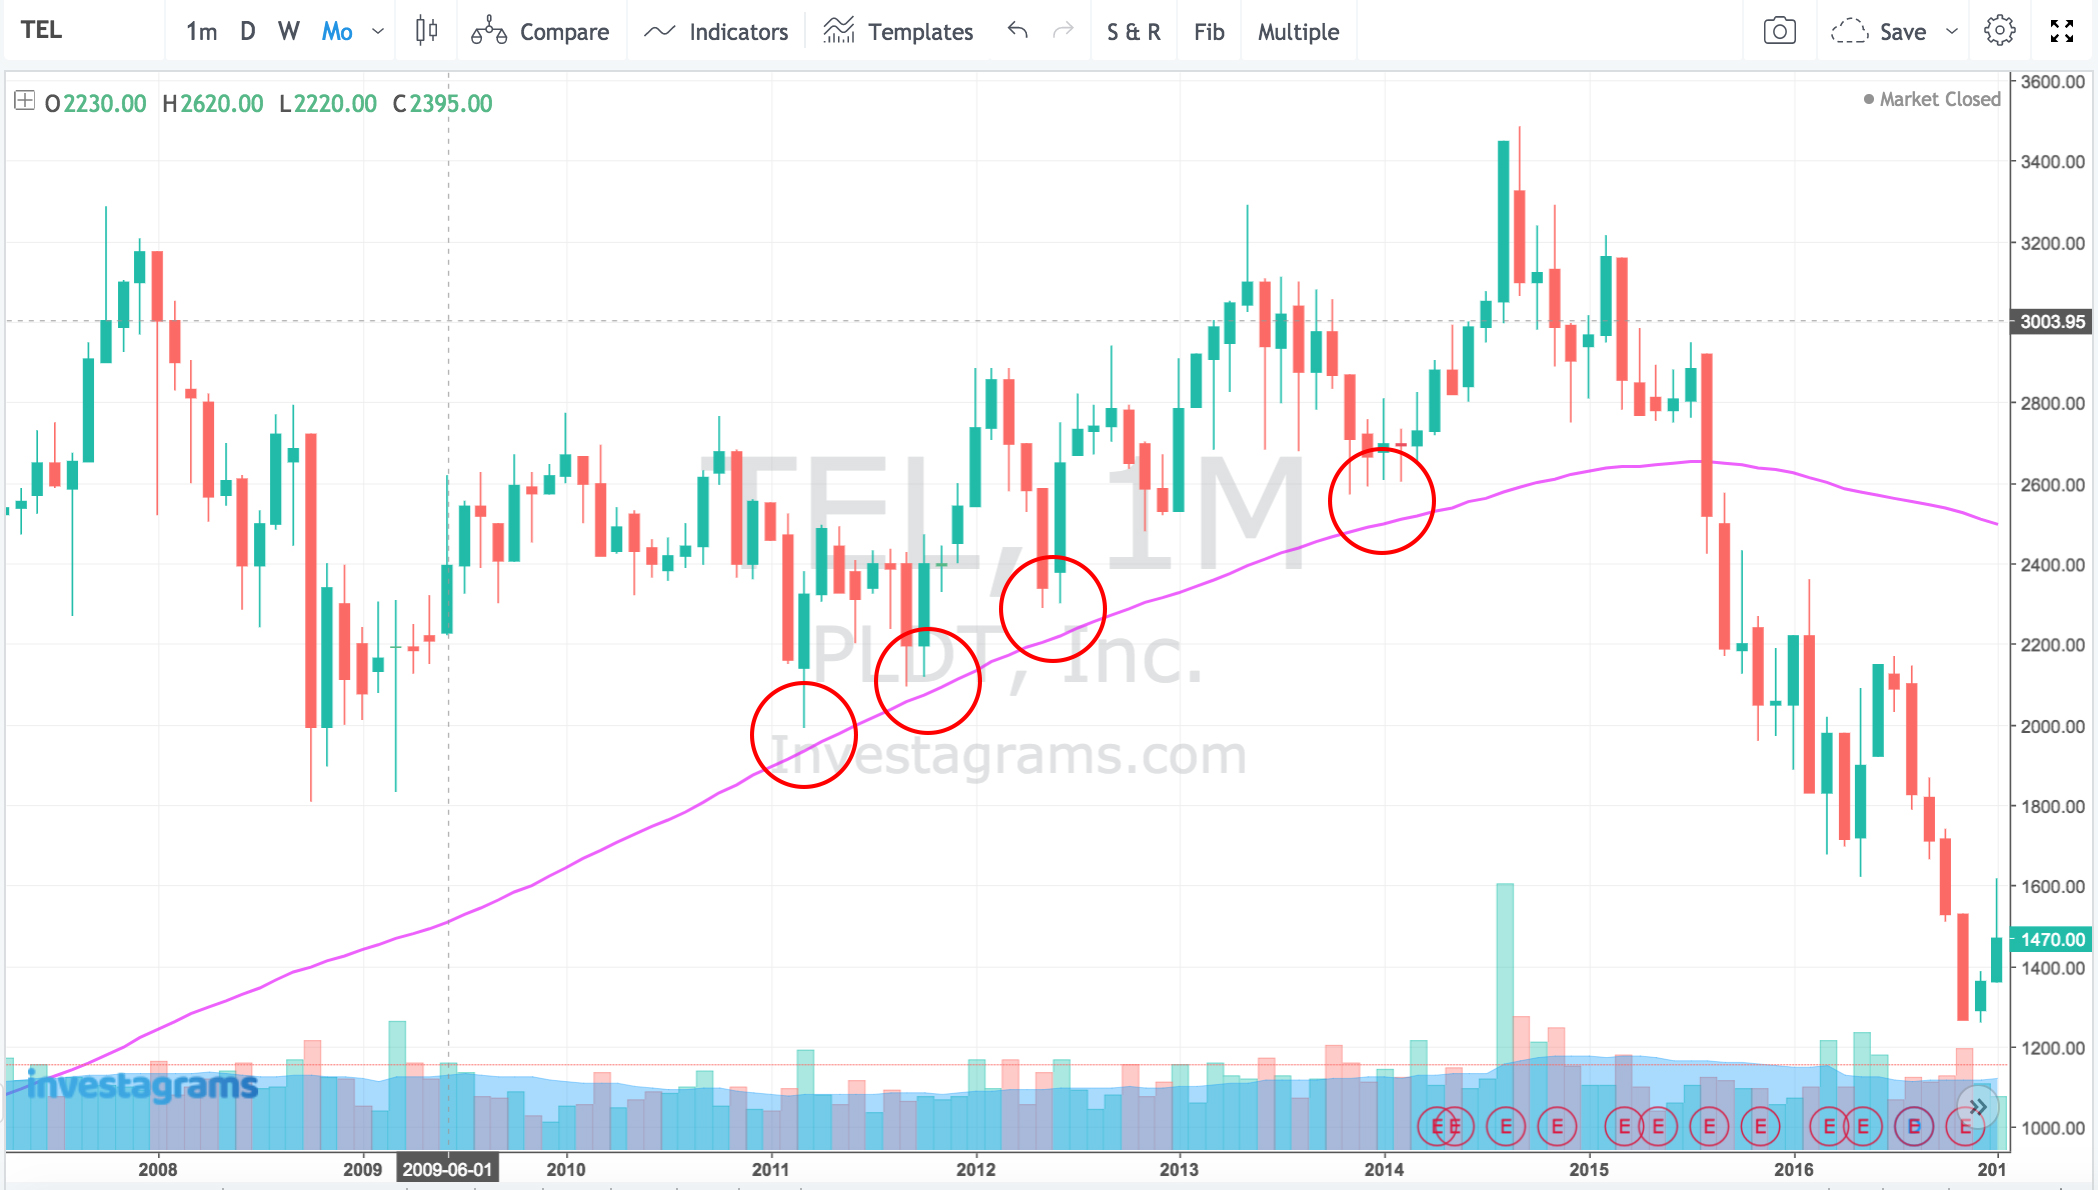
Chart-5. MA as Support
Similarly, look at the price of $TECH as the price of chart tells the same story. When in a downtrend, the 100 MA acts as a resistance and gives selling opportunities nearer to one’s average price. This would result into a chance for people to breakeven as they have a chance to sell near their average price.
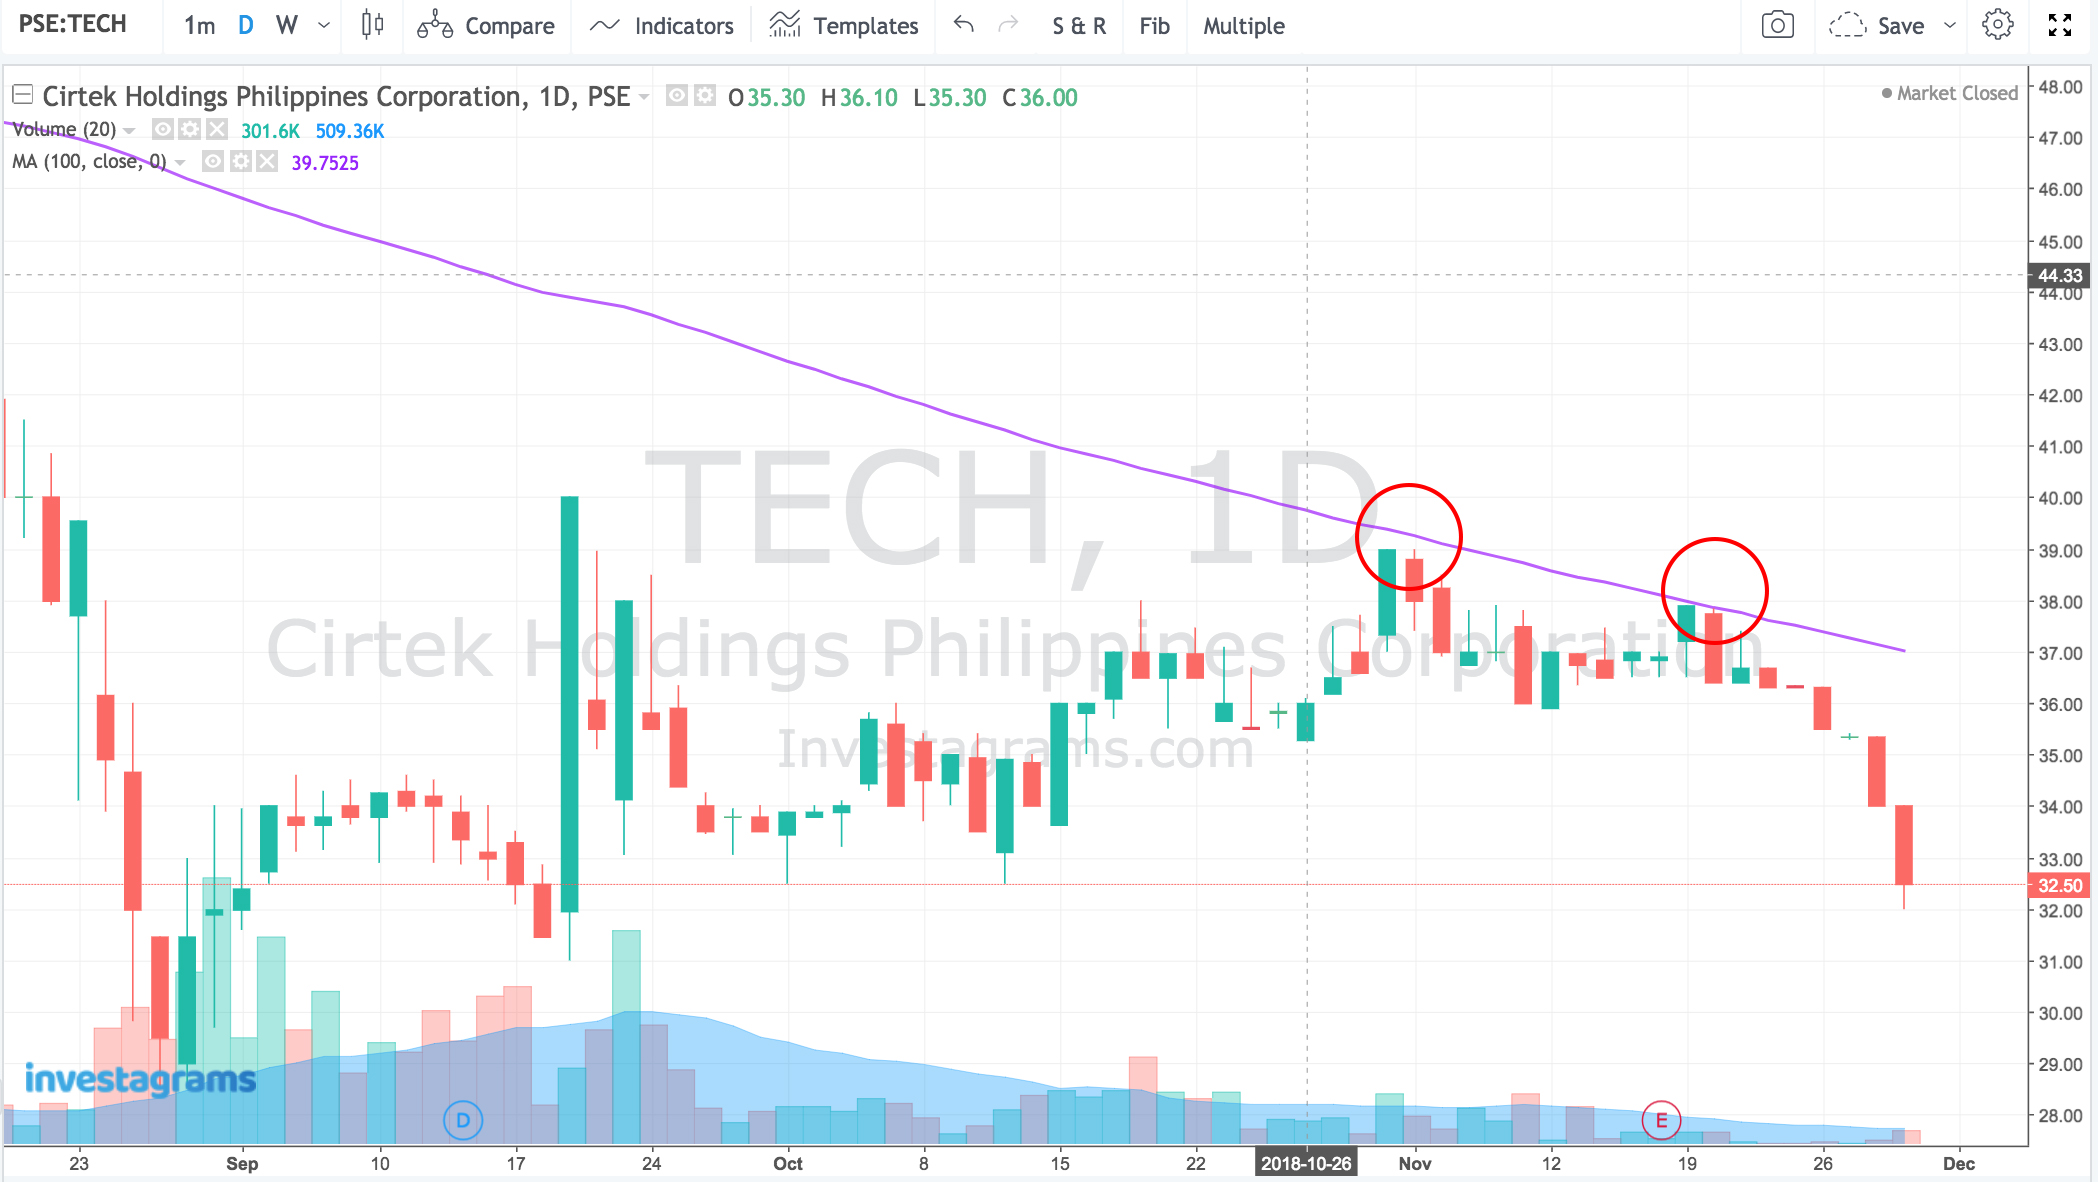
Chart-6. MA as Resistance
To wrap it up, Moving Averages are customizable indicators where you can choose whatever time frame you want to use when creating the average and if you want to know the confirmation of these MAs, you can use other indicators to support your validation.
Some traders use Moving Averages as the only indicator in their charts, for whatever reasons that they may have–whether for its simplicity or even to save up time as it is less time consuming in identifying trends, entry and exit, support and resistance and many more. With these MAs, they can now determine how the stock acted in the past and gives them idea how it would behave in the future.
While there are many other uses of Moving Averages aside from what has been discussed above, the important thing is you learn how to apply these simple MA strategies and then use it as part of your trading system for a profitable trading.
Happy Trading!