
In a quote by Ray Dalio, he says “In trading, you have to be defensive and aggressive at the same time. If you are not aggressive, you are not going to make money, and if you are not defensive, you are not going to keep the money.” Trading requires a lot of skill in order to be successful. Moreover, a strong mindset in trading requires you to have control over your emotions. Once you are able to achieve this, trading will simply be a walk in the park.
@ichigo33 takes the spotlight for this week’s featured trader as he shares his knowledge with us on stocks from the PSEI. Let’s take a look at how @ichigo33 uses this to his advantage.
@ichigo33 shared his thoughts on $SCC and its potential course of action
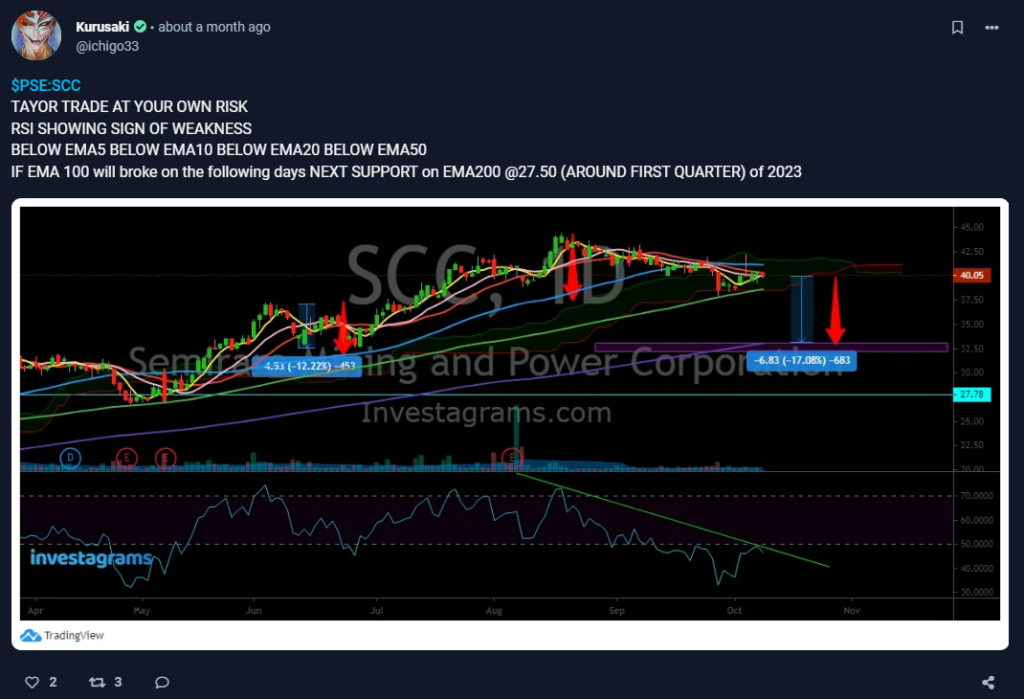
During this specific trading period, @ichigo33 has plotted out multiple indicators which helped in identifying the potential direction for $SCC. Let’s start with the exponential moving averages ranging from 10-50. This EMA provides a regularly updated average price to aid smooth out price data. Typically, a stock is in an uptrend if price is above the EMA. Conversely, it is in a downtrend if the price is below EMA. The RSI, a momentum indicator, can also be seen in the chart. This indicator tells us whether or not a stock is overbought (above 70) or oversold (below 30). We can also see support and resistance lines which help determine market psychology and supply and demand.
TECHNICALS OF THE TRADE
Technically, $SCC at the time was at a downtrend movement. As we can see in the chart below, the price is below all EMA indicators ranging from 10-50. This typically means that a stock is in a downtrend. Notice how every time the price touches the EMA line, it bounces back. This is because the EMA is already acting as a resistance line. We can also see that RSI is below 50, meaning that most traders are selling their current positions. Lastly, there seems to be a consistency in selling volume. Though it may seem like a good time to buy, it’s best to check out the stocks fundamental news.
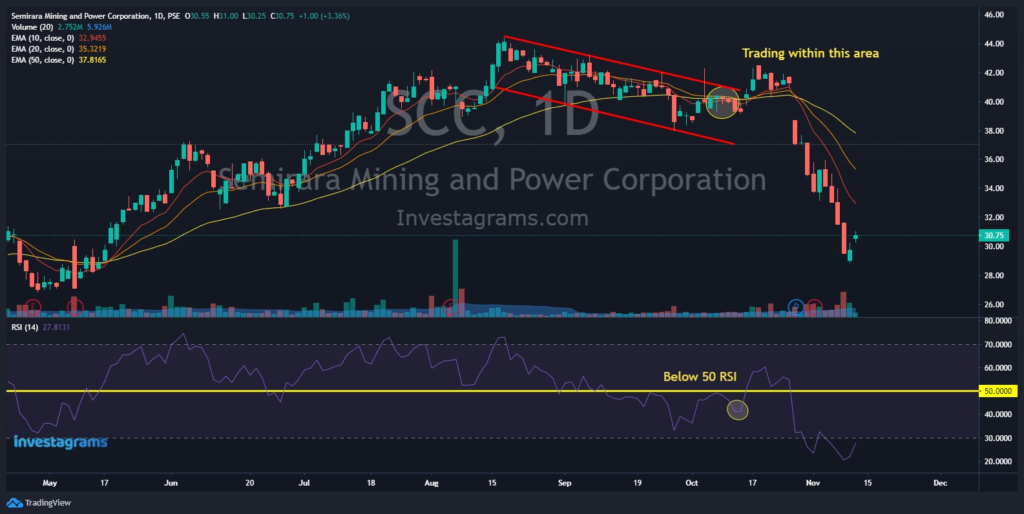
With all the information gathered and collected, @ichigo33 was able to predict price action and avoided a possible 20-30% loss.
FUNDAM ENTAL S OF THE TRADE
As officially disclosed in the PSE EDGE platform, $SCC has reported a Q3 profit of P10.1 billion, around 153% up from the 3rd quarter of 2021. However, it is currently down 6% from the second quarter of 2022, around P10.8 billion in profit.
$SCC then said that this could be the cause of high coal and electricity prices in the past months. Moreover, they noted that Q3 performance is at its lowest as a result from bad weather and low demand.
WHAT SHOULD BE MY NEXT MOVE
In the daily timeframe, $SCC seems to be reversing. The MACD, a trend following indicator, is showing signs of reversal. Not to mention, the RSI is also heading upwards, but towards a resistance level of 30 which can be a problem. We can also observe that the price is gaining buying volume after being in the bearish side for the past days.
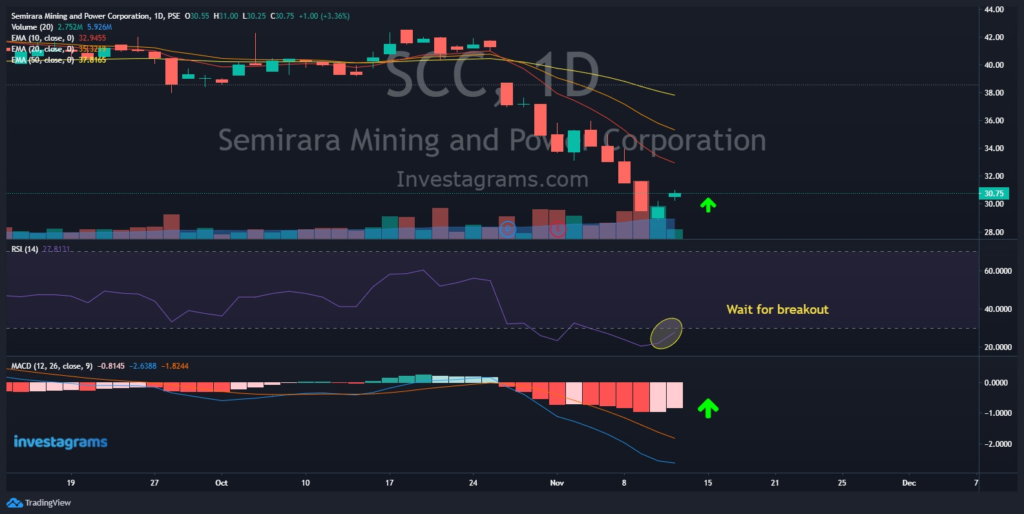
Given this, it is preferable to buy a few shares with its current price action. Once RSI has broken 30, you may buy more shares as well. Because the stock price is down so deep, accumulating shares of this stock would be the best option.
It would also be sage to buy the dips without spending a lot of money in view of the condition of the market. Always do your analysis and stay up to date on news that is pertinent to the stock you have picked.
Once again, KUDOS to @ichigo33 for being this week’s featured trader! Enjoy your 14-day InvestaPrime Access and continue to be an inspiration to the trading community.