
In a quote by Dana Allen, he says “The purpose of trading is not being right, the purpose is to make money, and I think that’s my number-one rule. Don’t get hung up on your current positions.” Earning money through trading may sound simple at first, but it’s not. In order to be profitable, you must have a proper trading strategy that will guide you along the way. Continue learning more each day to increase your chances of success.
@bogscab takes the spotlight for this week’s featured trader as he shares his knowledge with us on stocks from the PSEI. Let’s take a look at how @bogscab uses this to his advantage.
@bogscab shared his thoughts on $FNI and the potential course it might go after analyzing commodity prices.
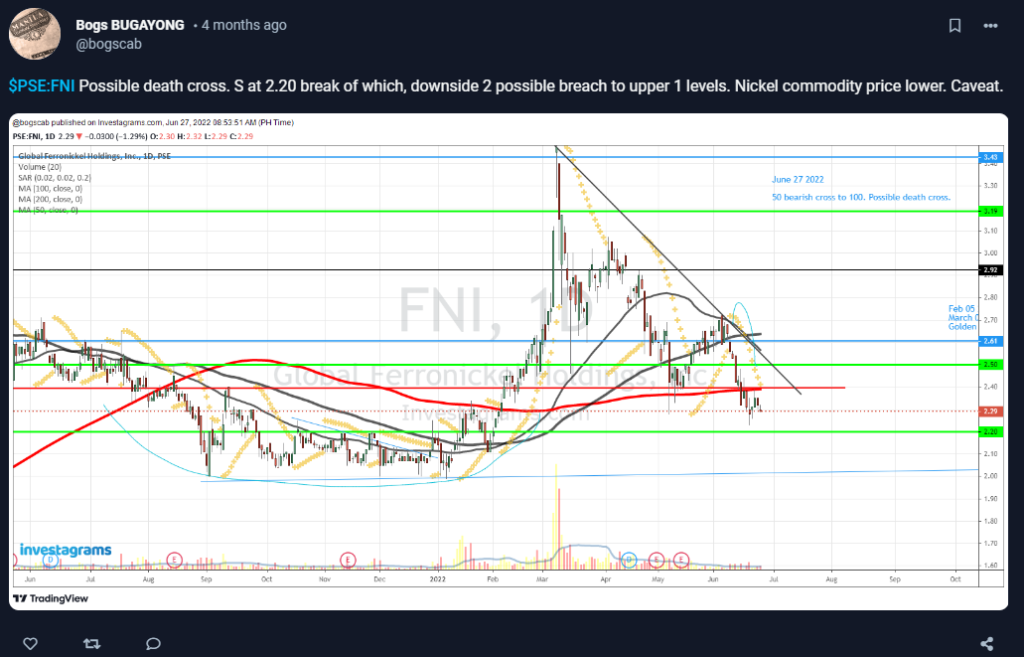
During this specific trading period, @bogscab has plotted out multiple indicators which will allow us to understand where price action might be headed. Let’s start with the MA from 50-200. A common stock indicator in technical analysis is the moving average, which provides a regularly updated average price to aid smooth out price data. A stock is in an uptrend if its moving average is increasing, whereas a downtrend is indicated by a dropping moving average. Next we can see the Parabolic SAR (dotted yellow), which is used by traders to determine trend direction and potential reversals in price. When the price is rising upward, a dot is placed below the price, and when it is trending downward, a dot is placed above the price. We can also see support and resistance lines which help determine market psychology and supply and demand.
TECHNICALS OF THE TRADE
Technically, $FNI at the time was in a downtrend movement. As we can see in the chart below, it has formed a bear flag indicating that the price would soon drop. Moreover, we can observe that prices were below the MA 50 and 100 indicators, meaning that it is in a bearish situation. Looking at his original chart, we may also see that he stated “death cross” of MA 50 and 100 which indicates a bear market. We can also observe it in the Parabolic SAR indicator as the price is below the yellow dots.
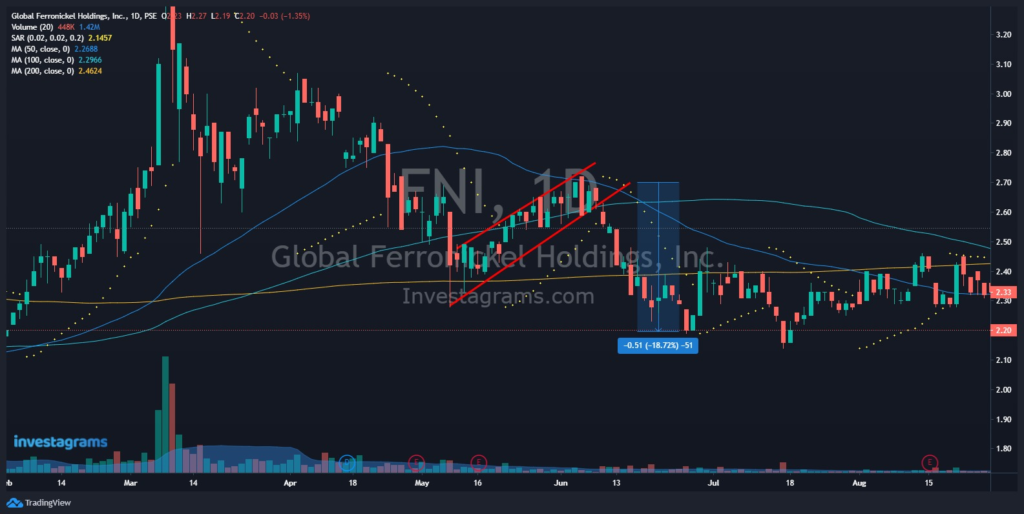
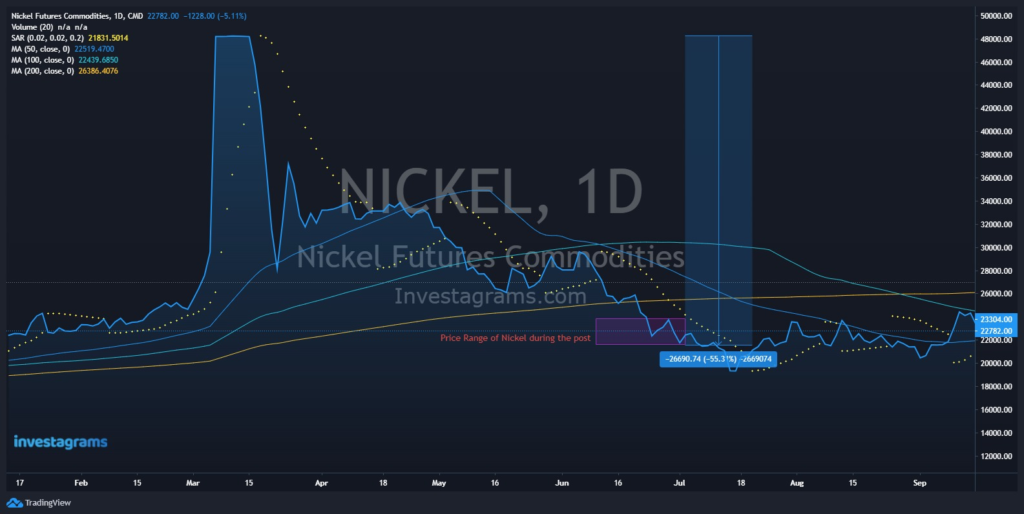
With all the information gathered and collected, @bogscab was able to predict price action and avoided a possible 18-20% loss. Moreover, he also based his analysis on the price of Nickel at that time, in which it was seen to be low.
FUNDAMENTALS OF THE TRADE
The demand for nickel may rise by a four-fold increase globally over the next 30 years as electric vehicles replace conventional cars in a practically full fashion. The largest miner in the world predicts that by 2040, nine out of 10 cars will be sold, driving up demand for nickel and other crucial battery components internationally. The nickel industry is already evolving as vehicle batteries overtake stainless steel as the key market for expansion.
WHAT SHOULD BE MY NEXT MOVE
In the daily timeframe, $FNI seems to be heading downward. The MACD, a trend-following indicator, is showing signs of reversal. Not to mention, the RSI is also heading downward to oversold levels. We can also observe that the price is below all 3 MA (50,100,200) meaning that it is bearish. The next support for this stock is seen to be around 2.00 levels, a possible entry point to accumulate this stock.
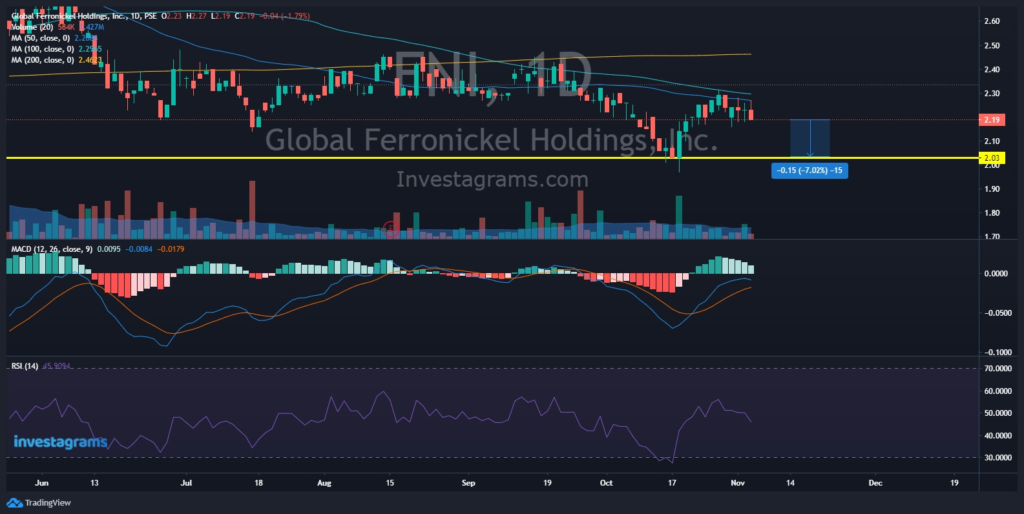
Given this, it is preferable not to buy yet and wait until the price reaches support. With everything going on in the market, it is best to play safe and not let our emotions get in the way.
Considering the state of the market, it would also be wise to buy the dips without spending a lot of money. Always conduct thorough research and keep abreast of news that is relevant to the stock you have chosen.
Once again, KUDOS to @bogscab for being this week’s featured trader! Enjoy your 14-day InvestaPrime Access and continue to be an inspiration to the trading community.