
This post is a continuation to our first post about reading between the lines.

First, I’m going to tell you right off the bat after reading this you might get inclined to getting rid of the usual Moving Averages that you would use in your chart view.
So instead of looking at all of these lines in one chart…
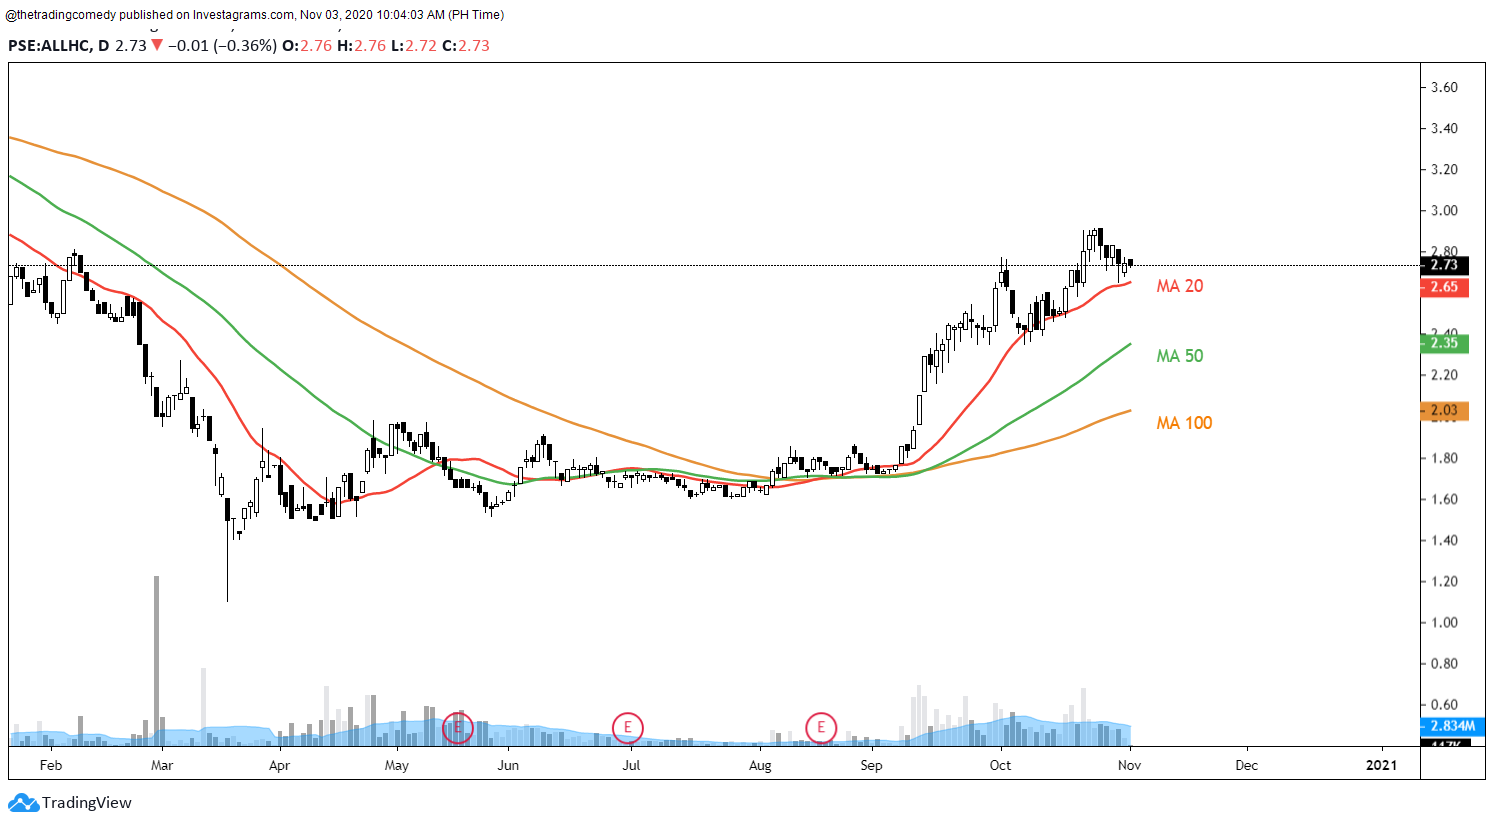
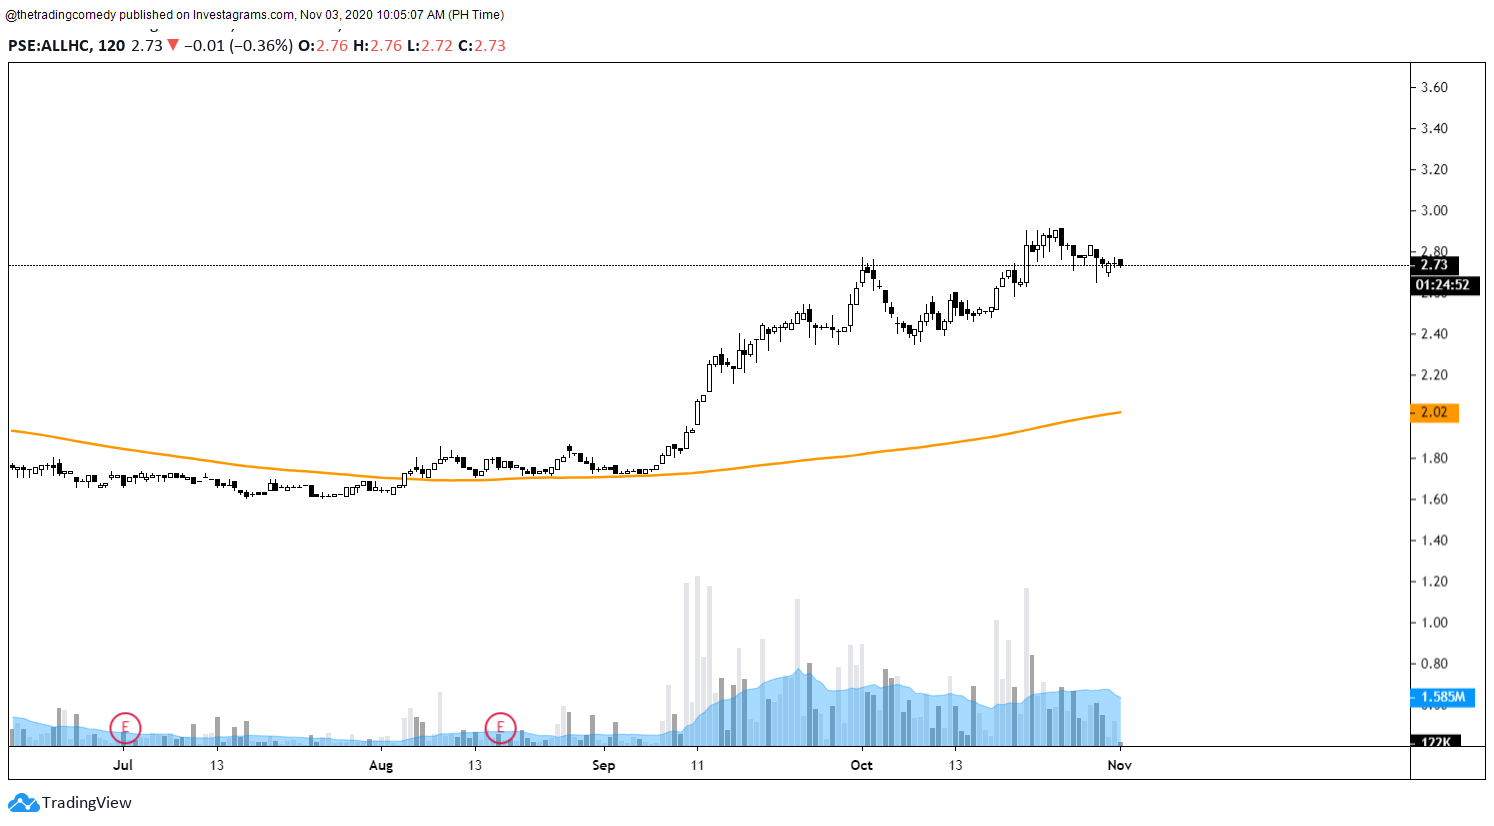
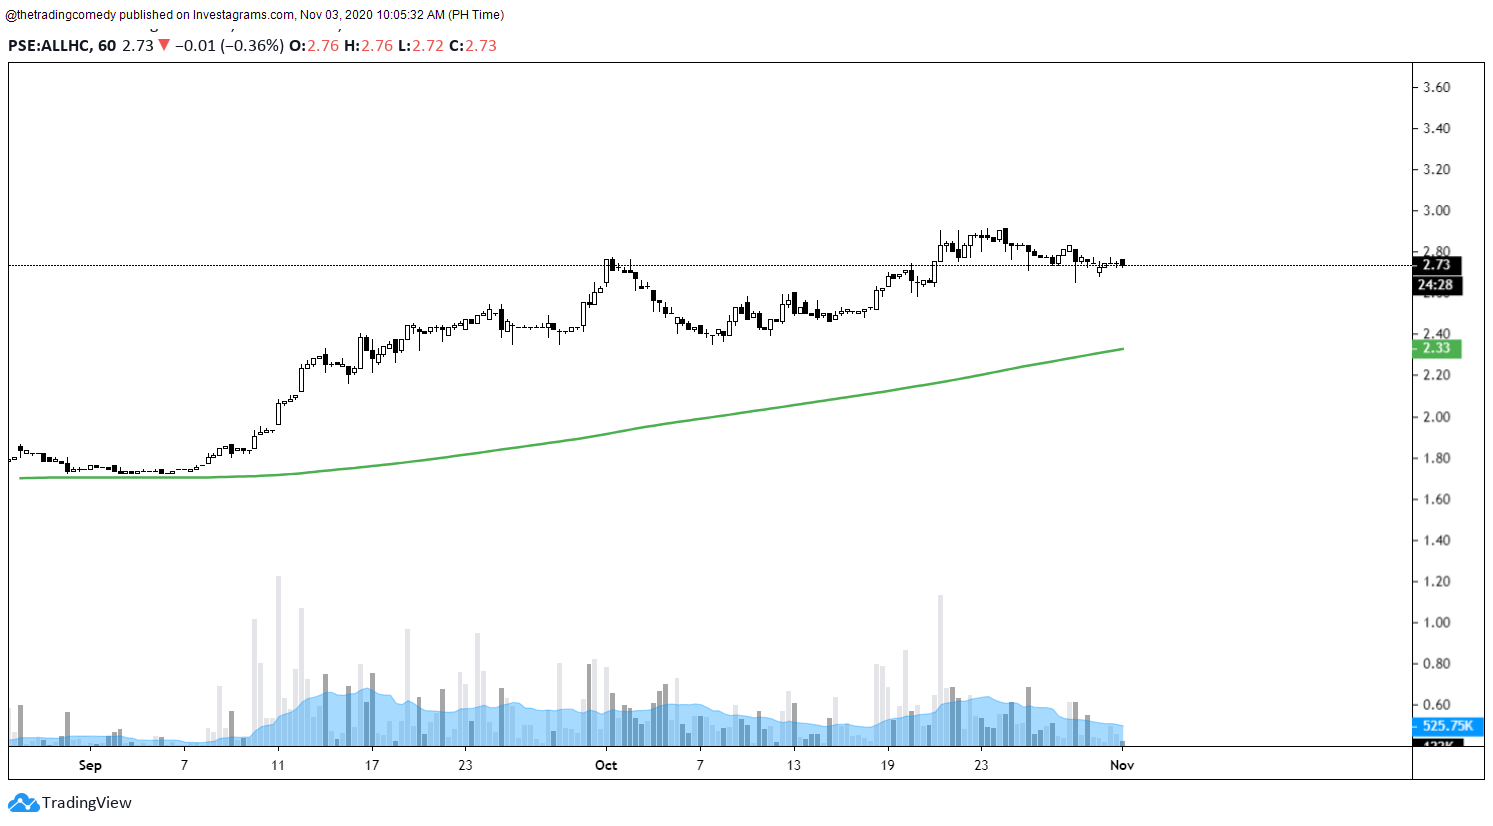
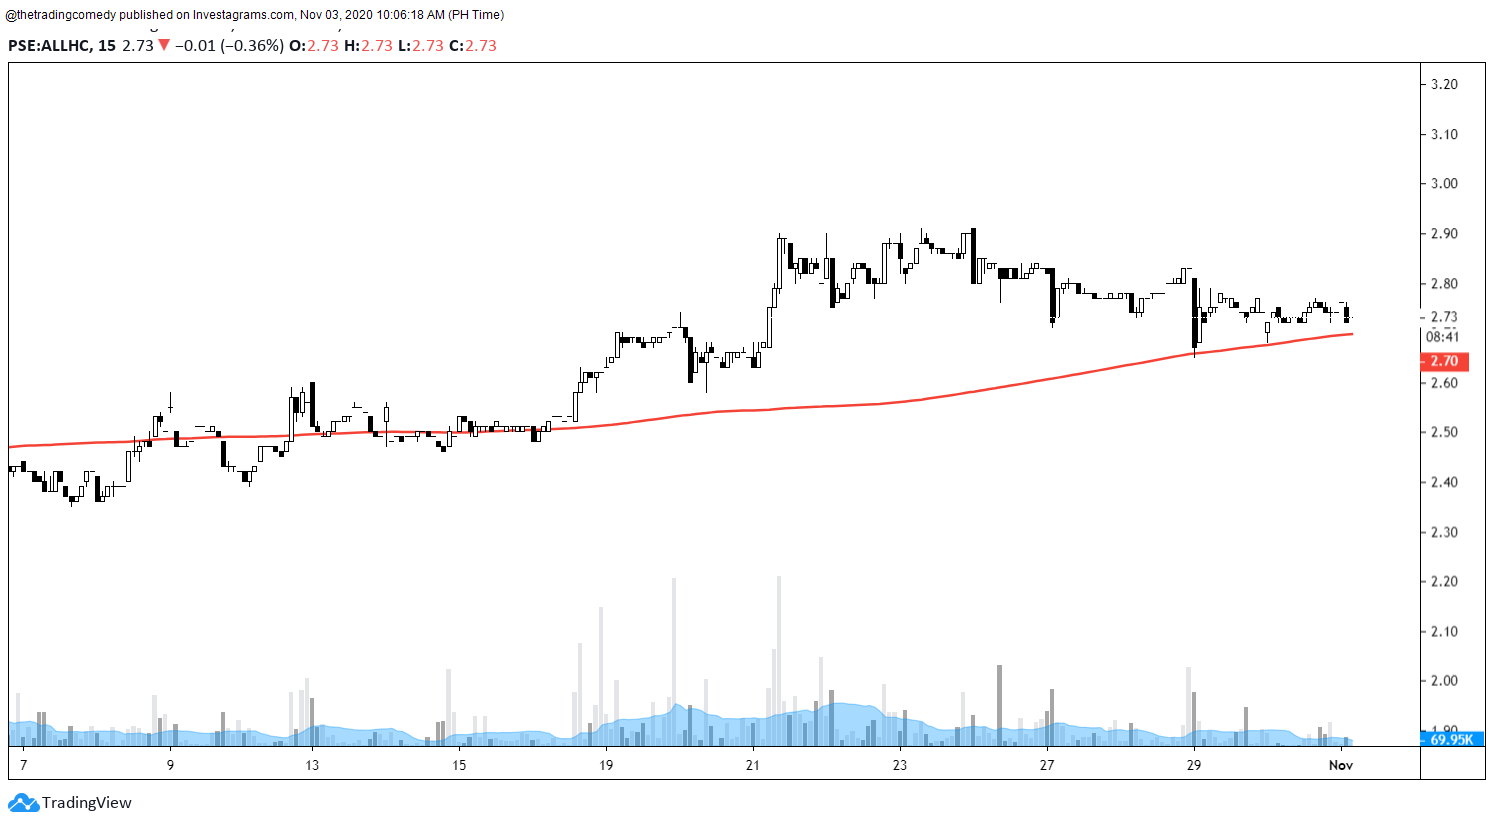
We’ll break it down into time frames using only one Moving Average. This way, you get a clearer picture on how you would approach a certain trade and you can confidently approximate how long you will hold on into that certain stock.
If you try to go back to the first picture of this post you would observe that each colored line is almost identical to each other.
Why breakdown a chart into more time frames when the Daily is already enough?
I know some of you would already ask this question. Let me share to you a typical scenario that I would always encounter whenever I traded using only the Daily time frame. Some traders can fall for this trap as well.
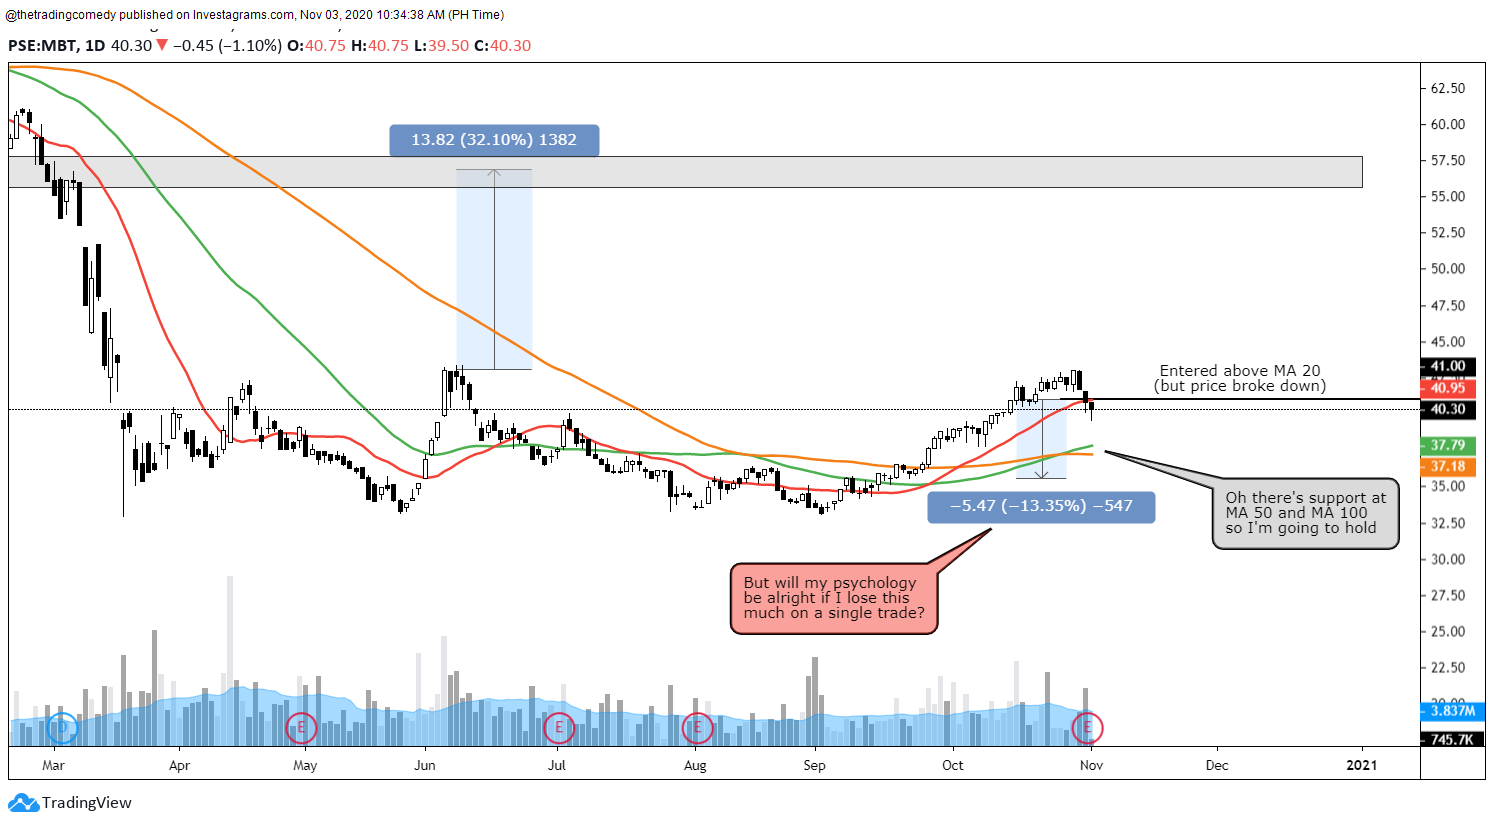
The chart above is an example of a simple trend following strategy wherein you buy above the MA 20 (red line) and say you only have a risk tolerance of 5% to 7% per trade.
However in this case, the price broke down MA 20. But because the MA 50 and MA 100 are acting as a dynamic support and the last candlestick is giving you a hint of hope that it might bounce because of the wick, you suddenly decide to hold without realizing that you could potentially lose 8% to 13% in the process.
Aside from checking if your psychology would be alright with the scenario, you should also check if it’s worth the time to wait for your trade plan to materialize or should you move on and look for stocks with a trade plan that has a shorter time to materialize .
From a trend follower’s perspective, there are times where you’ll get tempted to hold longer that you lose your awareness that you are already beyond your risk threshold. The worst thing that you could do is cling to that false hope that the price would hold above your remaining moving averages
Should you want to proceed with fully immersing yourself in line charts with the possibility of “unlearning” candlesticks in the process (because yes they generate a lot of noise too if you think about it), then this guide is for you.
We will talk about the only Moving Average that you’ll only need especially if you’re the type who has the tendency of switching time frames — the 200 period average!
What time frames to analyze when screening stocks?
From a line chartists perspective, we approach moving average screeners differently compared to the candlestick chartists wherein they can just use the Daily time frame to plan their trades in most cases.
Also, there are times that we can get impatient whenever we look at a higher time frame praying that the price should move quickly.
If you’re looking at a Daily chart, align your expectation to that time frame and DON’T LOOK AT ITS BEHAVIOUR LIKE A 5-MINUTE CHART! (unless there is momentum)
To solve this time frame anomaly, we’ve tabulated these time frames to set your expectations as well as making your time frame jumping easier (more about this later) — and you don’t even have to show the other Moving Averages in your chart view as long as you memorize these by heart whenever you’re looking at a specific time frame:
| Time frame (w/ SMA/EMA 200) | Daily SMA/EMA Counterpart |
| 2 hours | 100 |
| 1 hour | 50 |
| 15-minutes | 20 |
| 5-minutes | 10 |
So when filtering your stocks whether it be by 20-day, 50-day or 100-day moving average, you already have an idea which time frame to look at whenever you want to analyze some stocks regardless of the time objective.
Personally, I don’t use the 2-hour timeframe or the 5-minute time frame but if your trading system involves using a Daily 10-period or 100-period moving average then feel free to use the time frames.
Additionally, you will also have a rough idea of how long you’ll probably hold on to that position and yes, we also roughly estimated it for you so you know what to expect (at least based on my trading experience)
| Time frame (w/ SMA/EMA 200) | Estimated Holding Time |
| Daily | Weeks to Months (or Years) |
| Hourly | Days to Weeks |
| 15-minutes | 5-minutes | Minutes to Hours | Hours to Days |
200 in action!
Let’s take a look at an example. Here’s a recent trade that I attempted using only the Hourly time frame with an EMA 200 and Parabolic SAR (also consult the estimated holding time and the expected Daily counterpart on the last table)
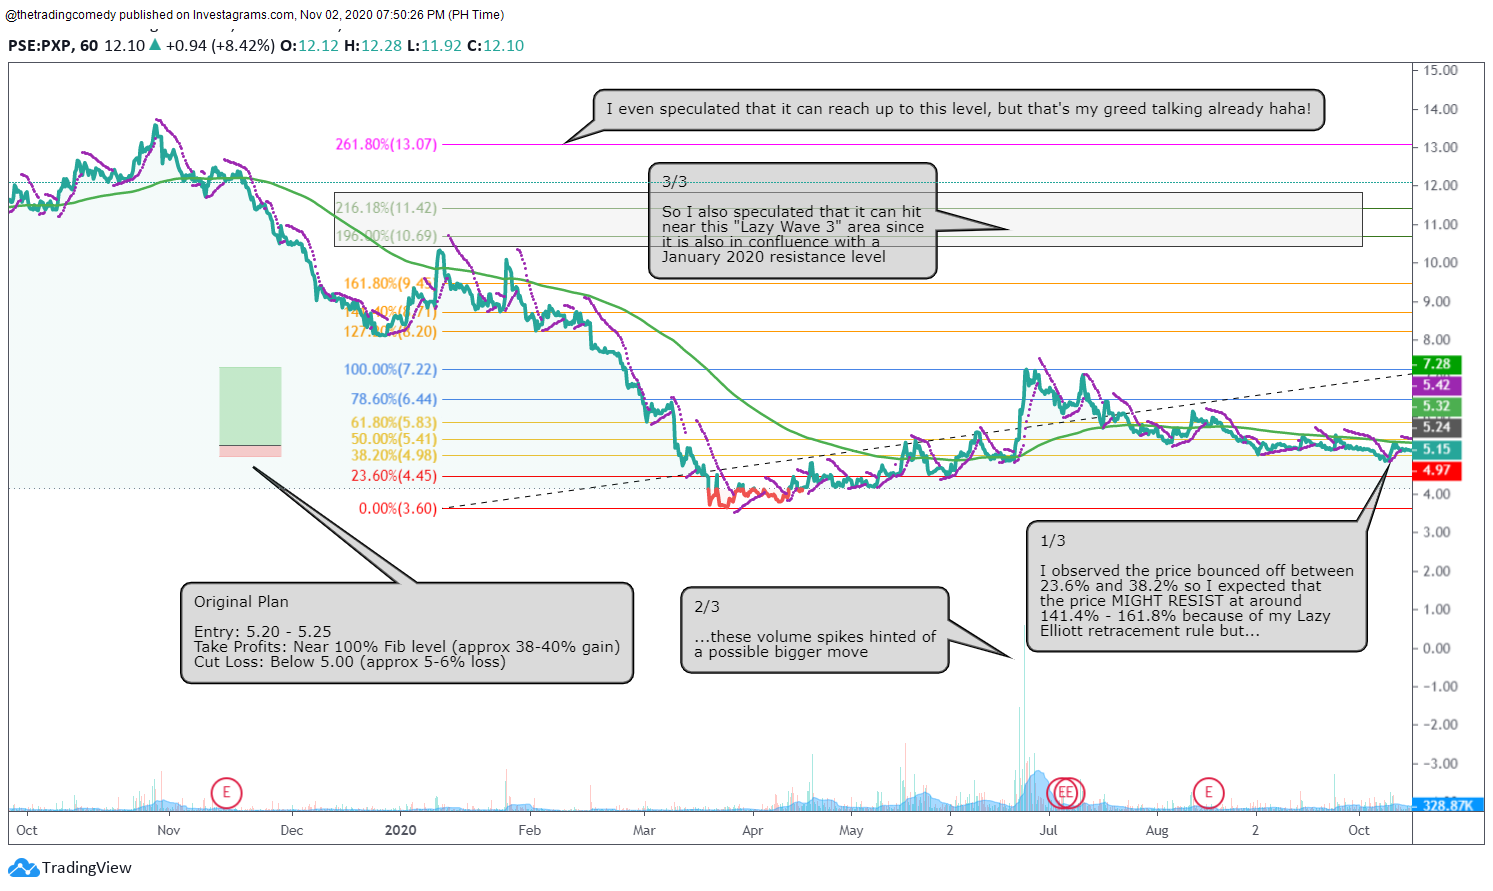
$PXP Hourly Chart w/ EMA 200 (EMA 50 view at the Daily) + PSAR
With my noted estimated holding time, I did not have to guess on how long I will have to wait for the trade to materialize given the conditions.
But I know some of you will ask why I still entered despite the EMA 200 and PSAR showing downtrend signals. This is where the art of switching time frames comes into play!
I switched to a 15-minute time frame (or my “Daily MA 20 view”) to check if there is an early opportunity to enter the trade and I saw this PSAR made an uptrend signal which convinced me to enter.
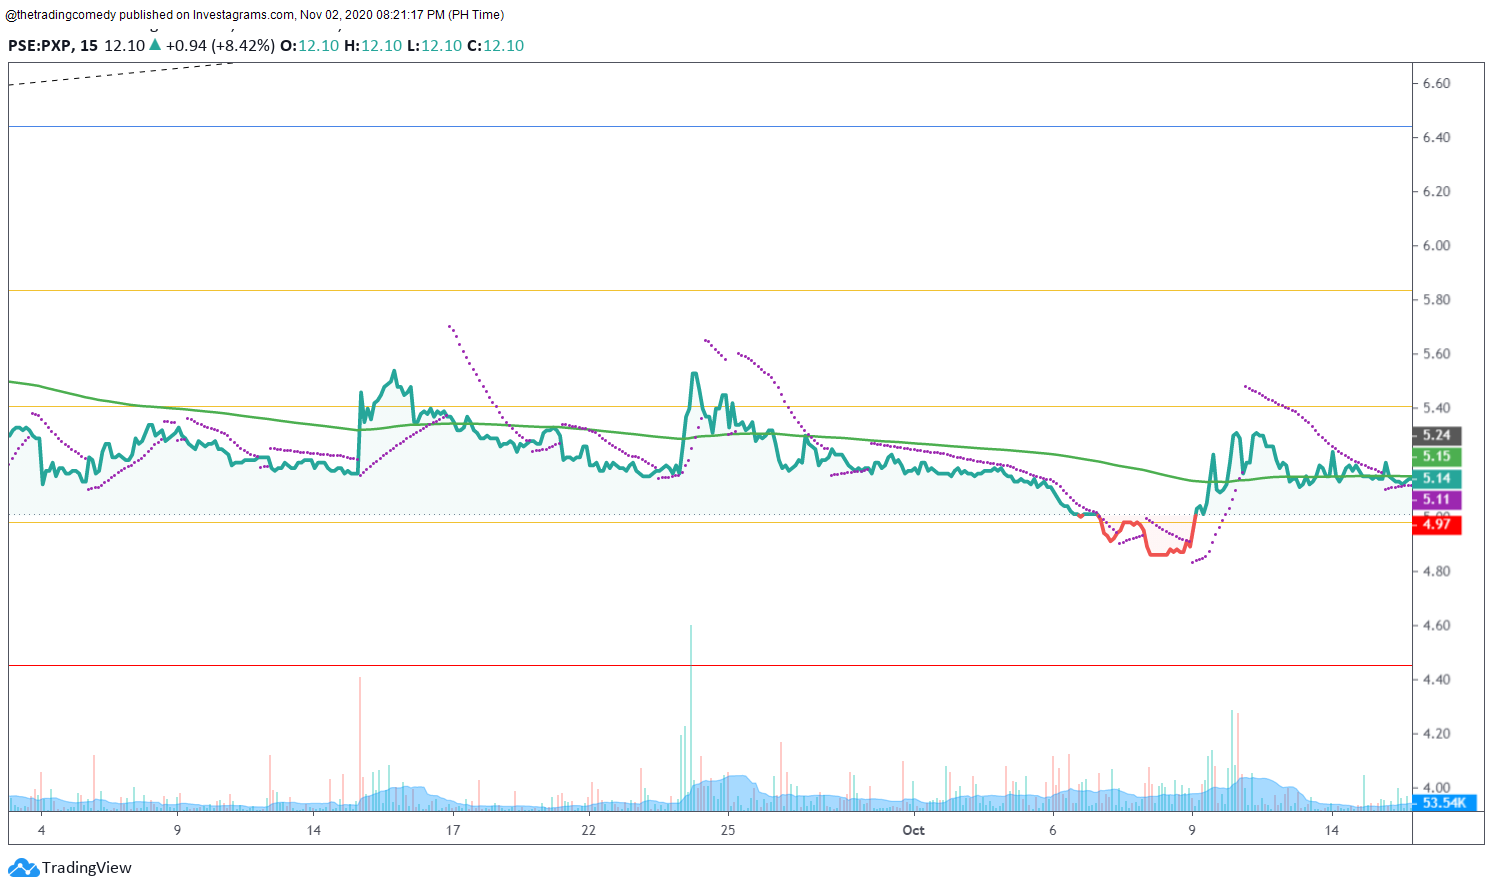
Don’t worry about the time frame switching for we’ll cover it in depth in our next post. Anyway, going back to the trade, here’s what happened after a few days…
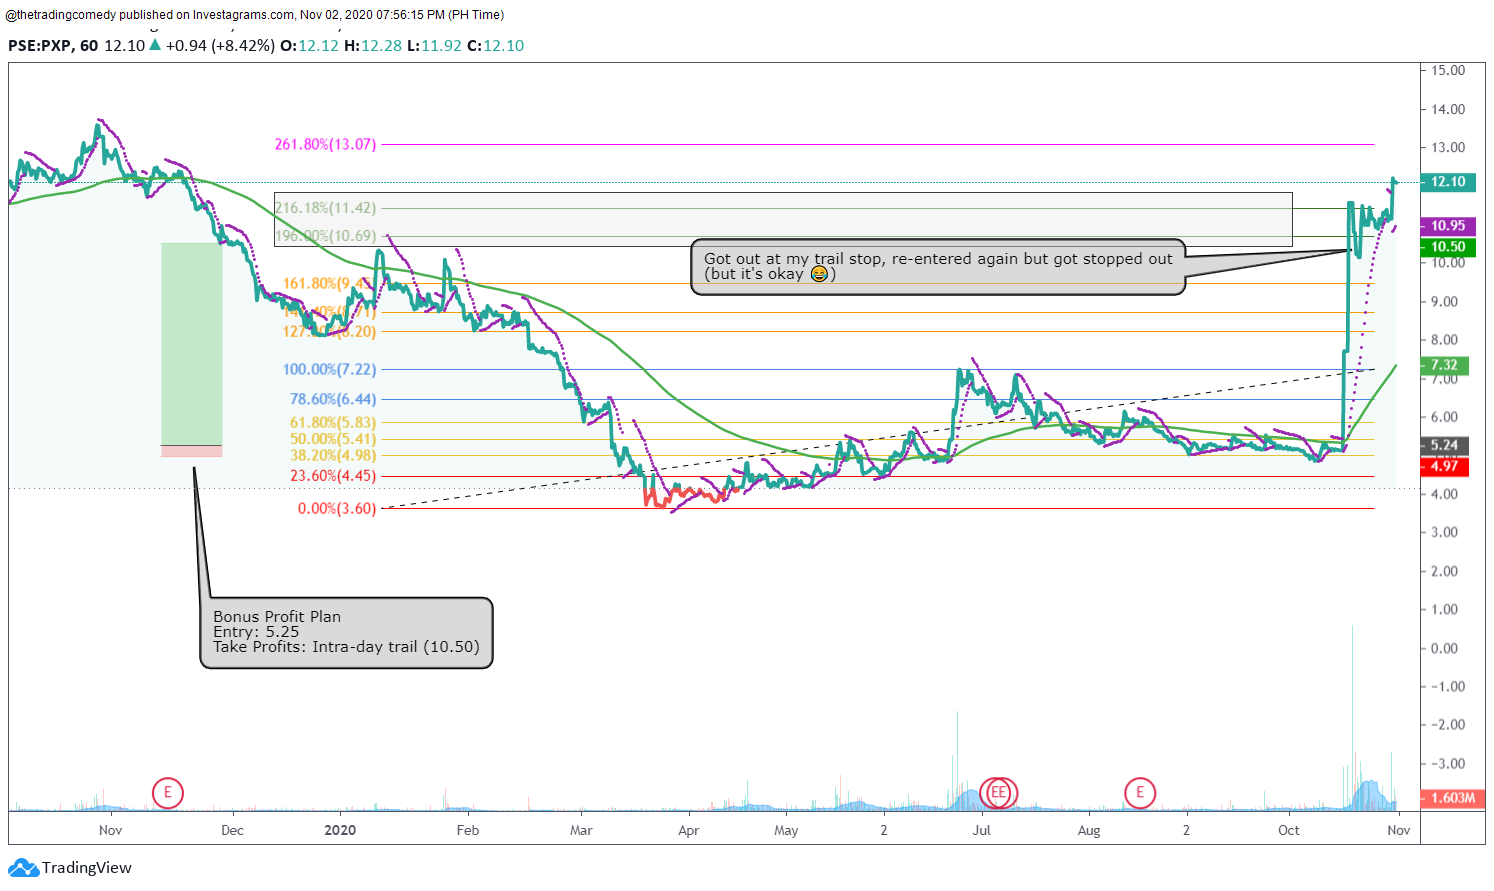
Yep that’s almost 100% gain because the stock went ceiling for a few days! And we only used the hourly time frame to create the trade plan. Here’s what my Investa Journal recorded.
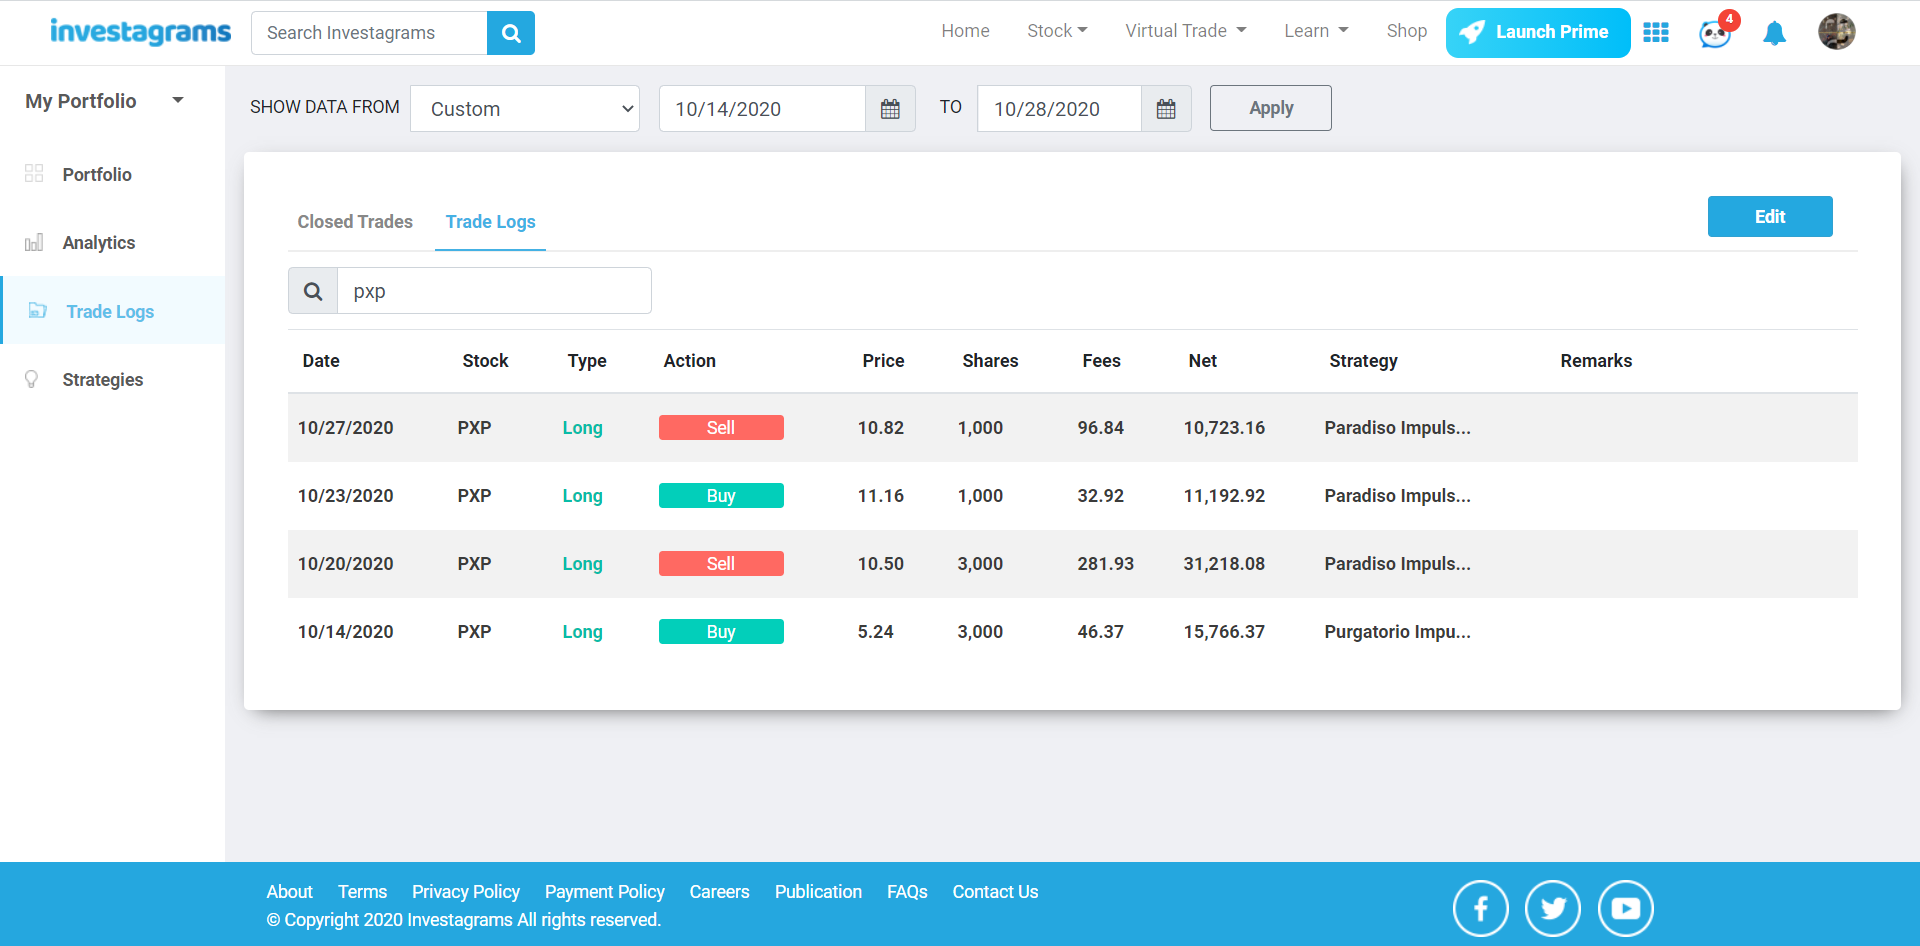
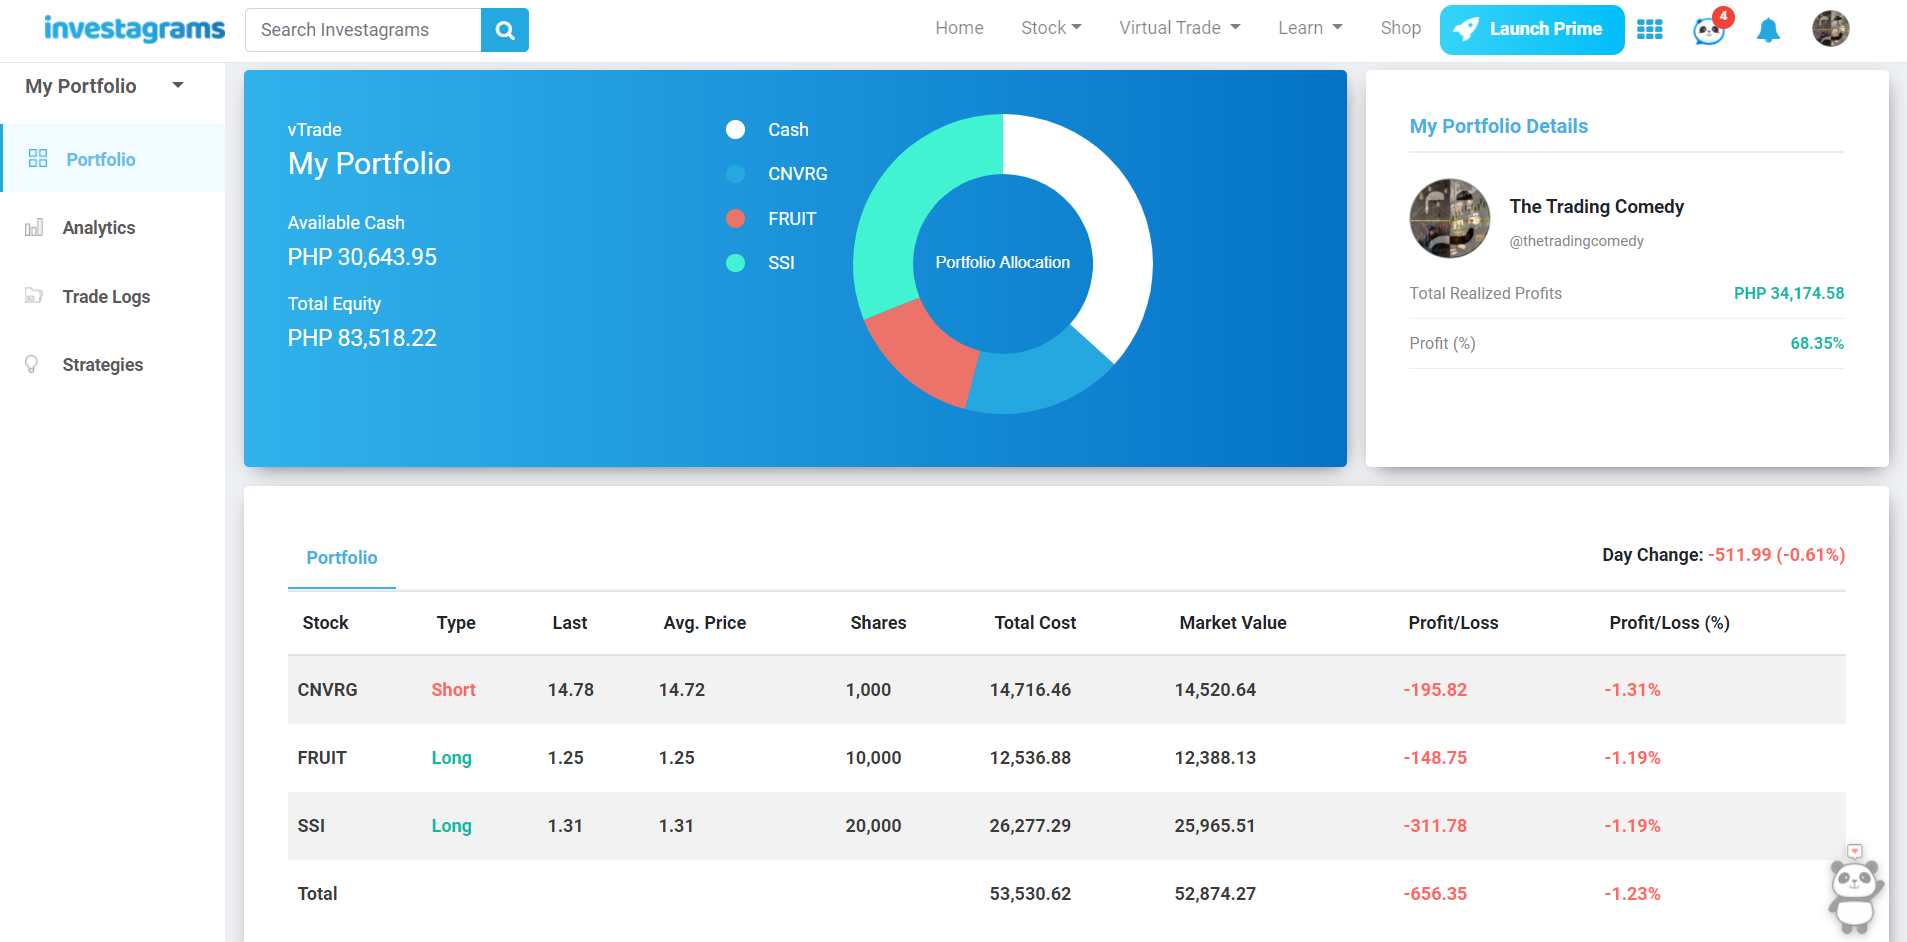
Based on the journal data above, I only held the stock for less than a week which is roughly 4 to 6 days (at par with our estimated holding time expectations) for both my huge win and minor loss. As of this writing, My Portfolio 50K 2020 Challenge port is now up by almost 70%!
One moving average is enough
Bombarding your charts with a lot of moving averages can sometimes paralyze your executions especially if you’re on the winning side of the trade and you become too complacent. With this guide, your expectations should already be set whenever you trade on your chosen time frame.
Stay tuned for the next post as we talk about my thought process on traversing properly through these timeframes.
Contributor:

Name: Marvin Alec Padua
Investagrams Username: @thetradingcomedy
Channels:
www.facebook.com/thetradingcomedy
www.twitter.com/alecscorner
www.instagram.com/thetradingcomedy
www.thetradingcomedy.finance.blog
https://tinyurl.com/AlexCornerSpotify
https://micky.com.au/author/apadua
About the Contributor:
A self-proclaimed “Lazy Elliottician”, Alec is a former mobile app developer turned independent singer-songwriter and busker, who goes by the stage name “Alex Corner”. He has a couple of songs on Spotify and other music digital platforms. A self-taught trader, he also created his own trader persona – “The Trading Comedy”, where he documents his trading journey in the Philippine Stock Market and beyond. He is currently a finance writer for Micky News as well as a casual gamer and streamer.