We’ve covered the basics of technical analysis previously, and we’ve even discussed how to use some indicators. As you progress in your trading journey, you’ll undoubtedly learn more indicators along the way. This begs the question, how do use the knowledge you gained to improve your trades?
Usually, people depict professional trading as using a big slew of indicators. Price charts filled to the brim with oscillators, bars, and others. However, something you’ll learn through experience is that you don’t need to know each one. You don’t even need to use all of the technical indicators you know. The more important aspect is your EFFICACY when using technical indicators.
“I fear not the man who has practiced 10,000 kicks once, but I fear the man who has practiced one kick 10,000 times.”
– Bruce Lee
What are indicators and what’s their purpose?
Trading indicators are tools used to analyze the price movement of assets. They are based on calculations based on how prices behave. What’s important to note here is that they are always derived from price action. They mainly serve as heuristics for traders to understand price movements faster.
As such, using technical indicators is bound to how you analyze price action. If you use momentum indicators, you should have a good grasp of how momentum plays out in the markets to make full use of the indicators. Otherwise, you’re no longer trading the stock’s chart. You’re already trading the indicator itself which could lead to worse performance.
Deep diving into some technical indicators
MACD
The MACD is a popular technical indicator that keeps track of momentum. What many don’t know is that the MACD itself is only one line.
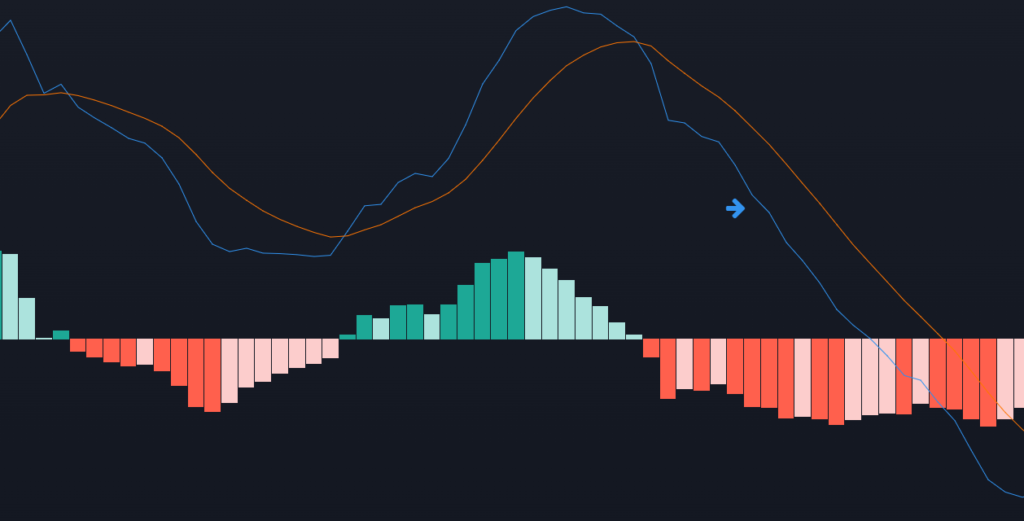
The other things that commonly load with the MACD are the signal line and the bars. While it has become a popular strategy to buy and sell whenever the MACD crosses above or below the signal line, this doesn’t fully encapsulate the use of the MACD.
In essence, the technical indicator works by tracking the distance between two moving averages of different time frames. When momentum is strong, short-term moving averages tend to rise faster than long-term moving averages. The MACD captures this by rising as well. On the other hand, when prices consolidate after a strong rally, the moving averages tend to coil together. This often signifies that profit takers are exiting the market. The MACD tends to slope downward closer to zero when it happens.
The MACD buy/sell signal can be a viable strategy. However, it doesn’t do the indicator justice if it’s only used in that way, especially if the underlying market dynamic behind the signal isn’t understood. There are many ways to use the MACD as a tool to keep track of momentum. All you have to do is to try and understand how it tries to encapsulate certain market behaviors.
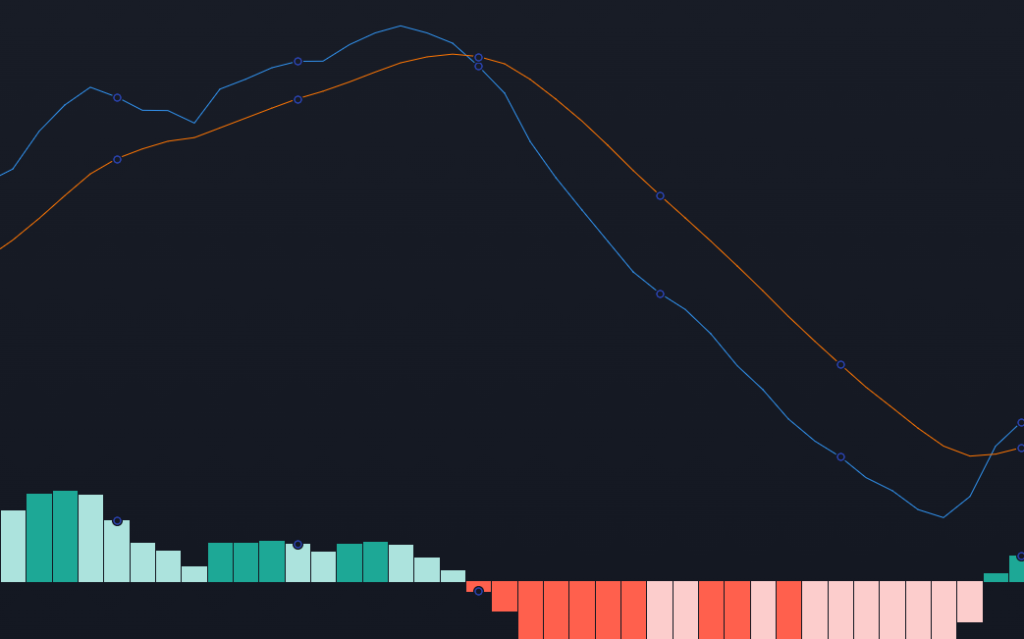
RSI
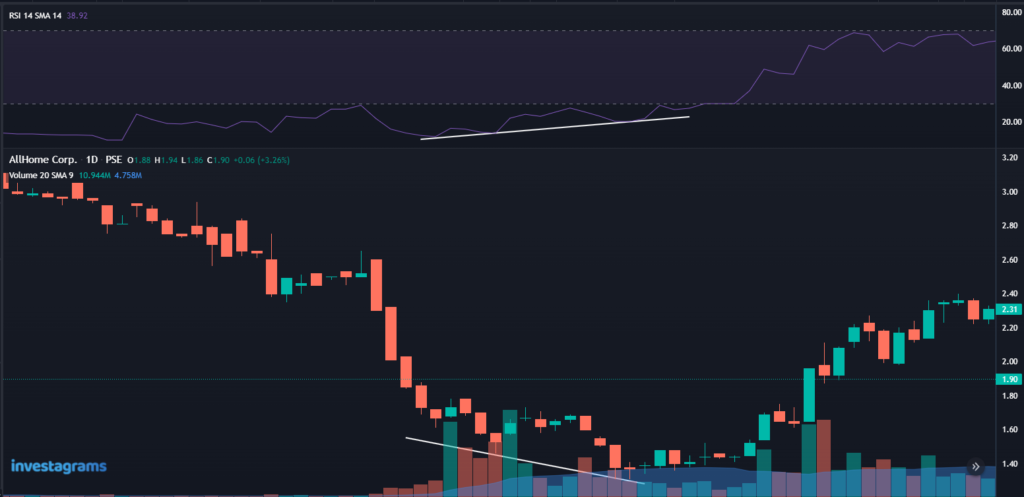
The RSI is another popular technical indicator among traders. Like the MACD, it keeps track of momentum. The difference is that it bases readings on the speed and change of price action. It does so by creating a ratio between the average gains and losses for a certain period, then turning it into a scale from 1 to 100.
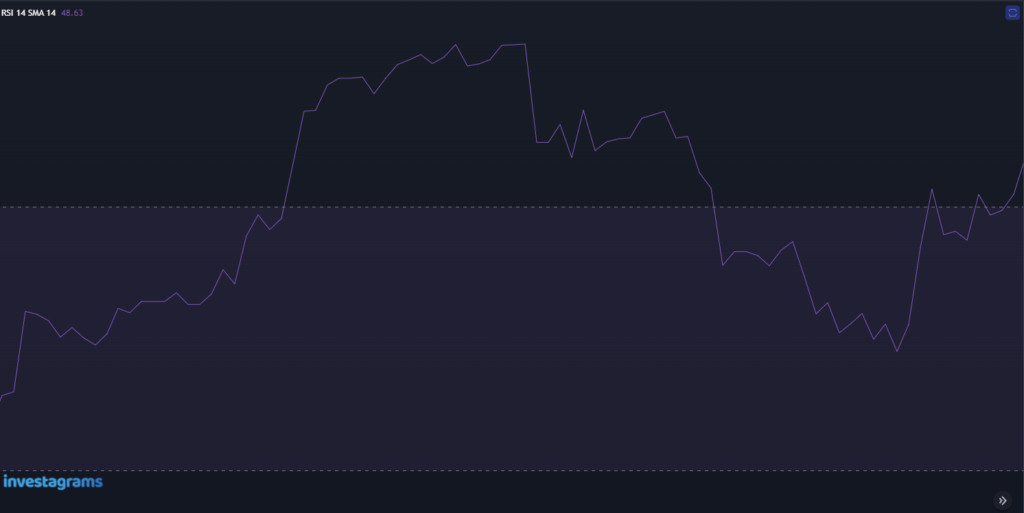
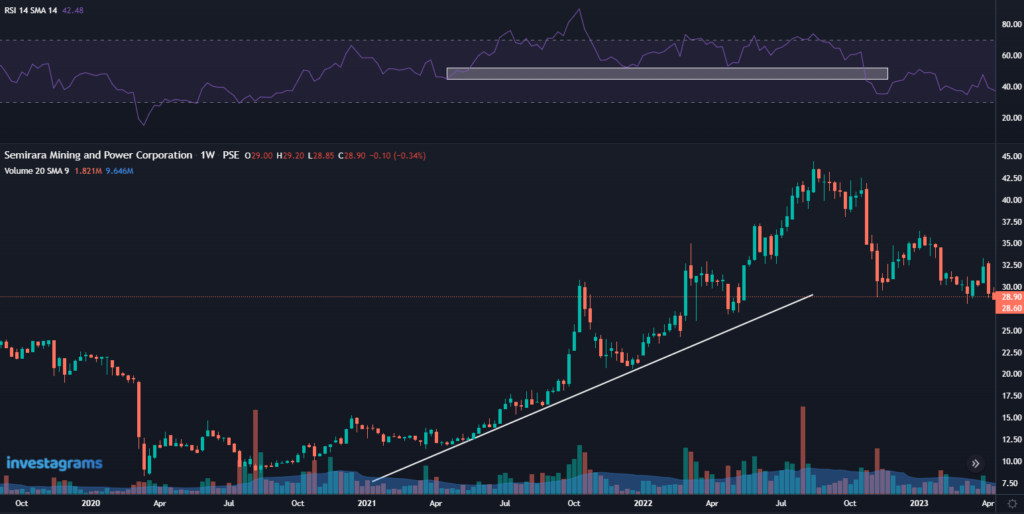
One common way to use this is to identify readings above 70 as overbought and below 30 as oversold. While this holds true, only using the RSI for this purpose would be a crude way of using it. You need to understand that during uptrends, the RSI will tend to go and sometimes stay at overbought levels. On the flip side, the RSI will also tend to stay at oversold levels during downtrends.
The key thing to remember when studying the RSI is that it keeps track of the speed and change of price action. The market tends to move in waves. When there’s a disruption in how strong prices are going in one direction, this can be inferred as a very early signal that the tides may turn. Hence, the use of RSI divergences for reversal plays.
Likewise, RSI consistently at high or low levels signifies the dominance of either buyers or sellers. Many professional traders tend to use this as a tool to screen for trades. Since the trend is your friend, it makes sense that you’d buy those that don’t have low RSI readings.
Different indicators have different nuances. There is usually more than one way to use an indicator other than what is commonly taught. By extensively studying how a technical indicator is derived, you can get a better understanding of how an indicator can help you analyze the markets.
Moving forward
If you want to get better at using indicators, make sure to focus on QUALITY OVER QUANTITY. Focus first on getting a better grasp of market behaviors. Then, try to understand deeply how indicators work and how they can be used in tandem with your price action analysis.
Check out our different lessons. From educational videos to articles, we provide knowledge applicable to traders of different levels. All it takes to get better as a trader is to put in the work and do so with fervor.
Easily track your PSE and Crypto portfolio on Investagrams for FREE!
Try it today: https://invs.st/PortfolioDaily