This week’s featured trader is @probabilitypilot! He was able to find an accurate entry as $EEI was continuing its rally.
Elegant and simple, he was able to figure out at what point the stock was in the Elliot Wave cycle. Through confluences with the use of moving averages, a precis entry was found.
Let’s take a look at how @probabilitypilot analyzed the high-flying $EEI.
ANALYSIS FROM @probabilitypilot
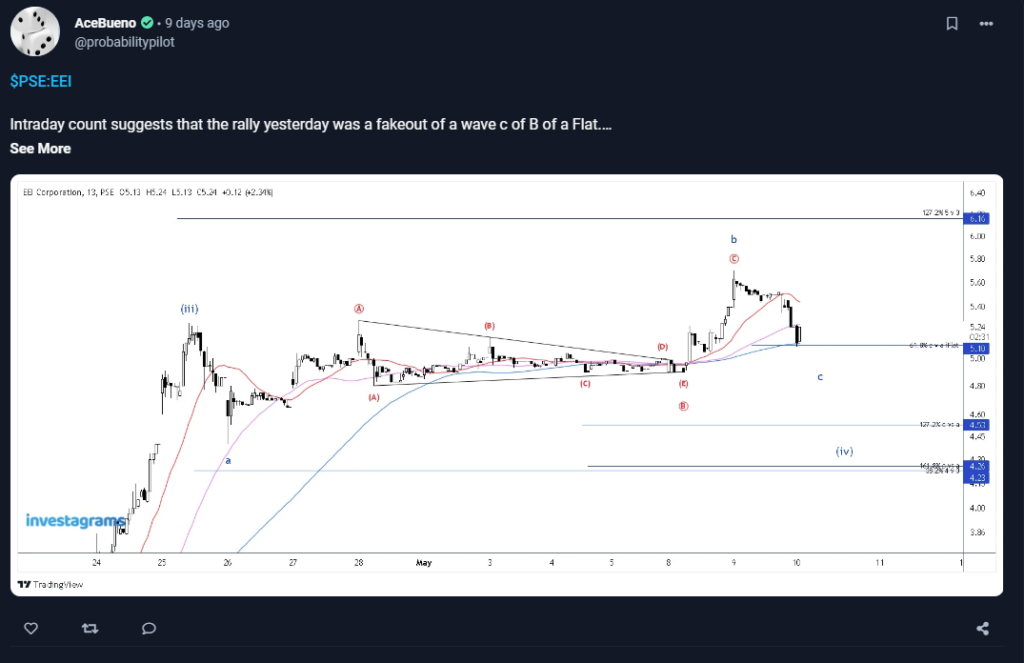
During the time of his post, $EEI was one of the high-flying names in the local stock market. Prices strongly broke out of a bottom, reaching gains of 100% in only a matter of days. Given that momentum was very strong, prices only made a shallow consolidation – barely even reaching the 10-day EMA. As demand was shown to be strong, it made sense for traders to look for a momentum play in the intraday charts.
@probabilitypilot did just that and created an intraday count in order to try and forecast the scenarios that might happen. By formulating both a bullish and bearish case, he would be ready for anything that happened to the stock. The analysis was spot-on. Based on the levels provided, traders who attempted the same trade would now have already gained more than 18%!
TECHNICALS OF THE TRADE
The most noticeable part of @probabilitypilot’s analysis has to be his Elliot Wave count of $EEI’s intraday chart. While most people usually employ wave counting to long-term charts to gauge an asset’s general movement, he used wave counting as a means to make micro decisions. Tied in with confluences using moving averages, and he got himself a solid thesis for a trade.
Generally, Elliot Wave counting is a technique used to try and predict the price movements of stocks. The whole theory is based on the idea that prices don’t go in straight lines – they tend to move in waves. Oftentimes, there are motive waves which tells you what the general trend is. There are also corrective waves wherein prices correct or pull-back. By identifying and labeling the different waves, you can work towards a deeper understanding of what the market’s current position is. When used in conjunction with other TA tools, this can become a powerful way of finding and executing trades.
FUNDAMENTALS OF THE TRADE
EEI is local company that provides construction services and supplies manpower both domestically and internationally. Specifically, it specializes in the installation and construction of power generating facilities, oil refineries, food and beverage manufacturing facilities, assembly plants, and many more.
While the pandemic was hard on the company as most economic activity died down, the lifting of lockdowns and revival of the economy was enough to help EEI get back on its toes. With the resurgence of its cash inflows, the company recently announced that it’s giving out a whopping 5.76% dividend for the quarter. Although bottom-line numbers have yet to turn positive, the dividends are a big sign that the company is heading towards the right direction.
WHAT SHOULD BE YOUR NEXT MOVE
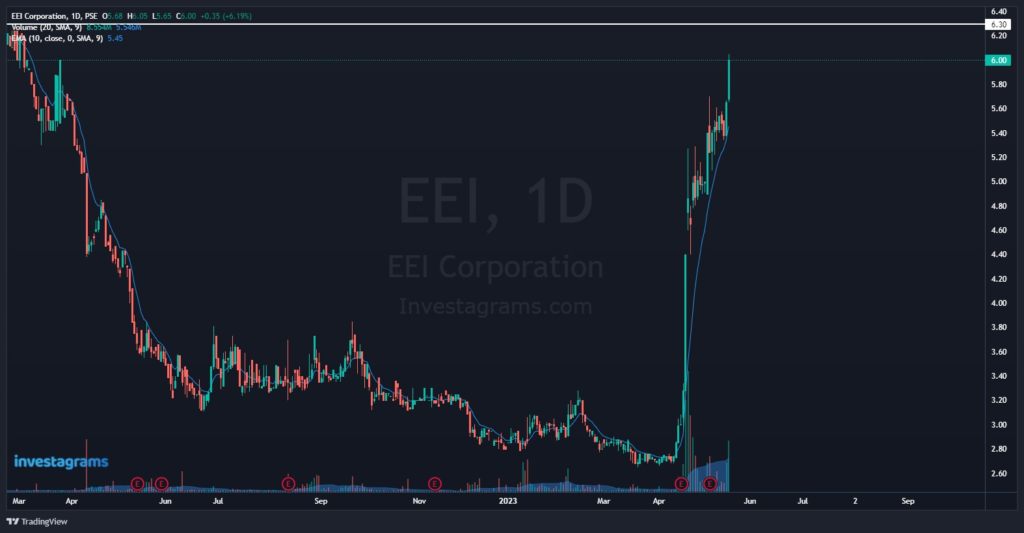
Currently, $EEI prices still continue to rise. If you’re just looking to get into the stock now, it might be best to wait for the pullback. Momentum is currently strong, but as always the market moves in waves. Given that the rally has already overextended, the risk-reward for entries right now is currently low. However, if you already bought shares of the company previously, make sure to trail your stops and to follow your plans for selling closely.
Once again, KUDOS to @probabilitypilot for being this week’s featured trader! Enjoy your 14-day InvestaPrime Access, and continue to be an inspiration to the trading community.
Easily track your PSE and Crypto portfolio on Investagrams for FREE!
Try it today: https://invs.st/PortfolioDaily