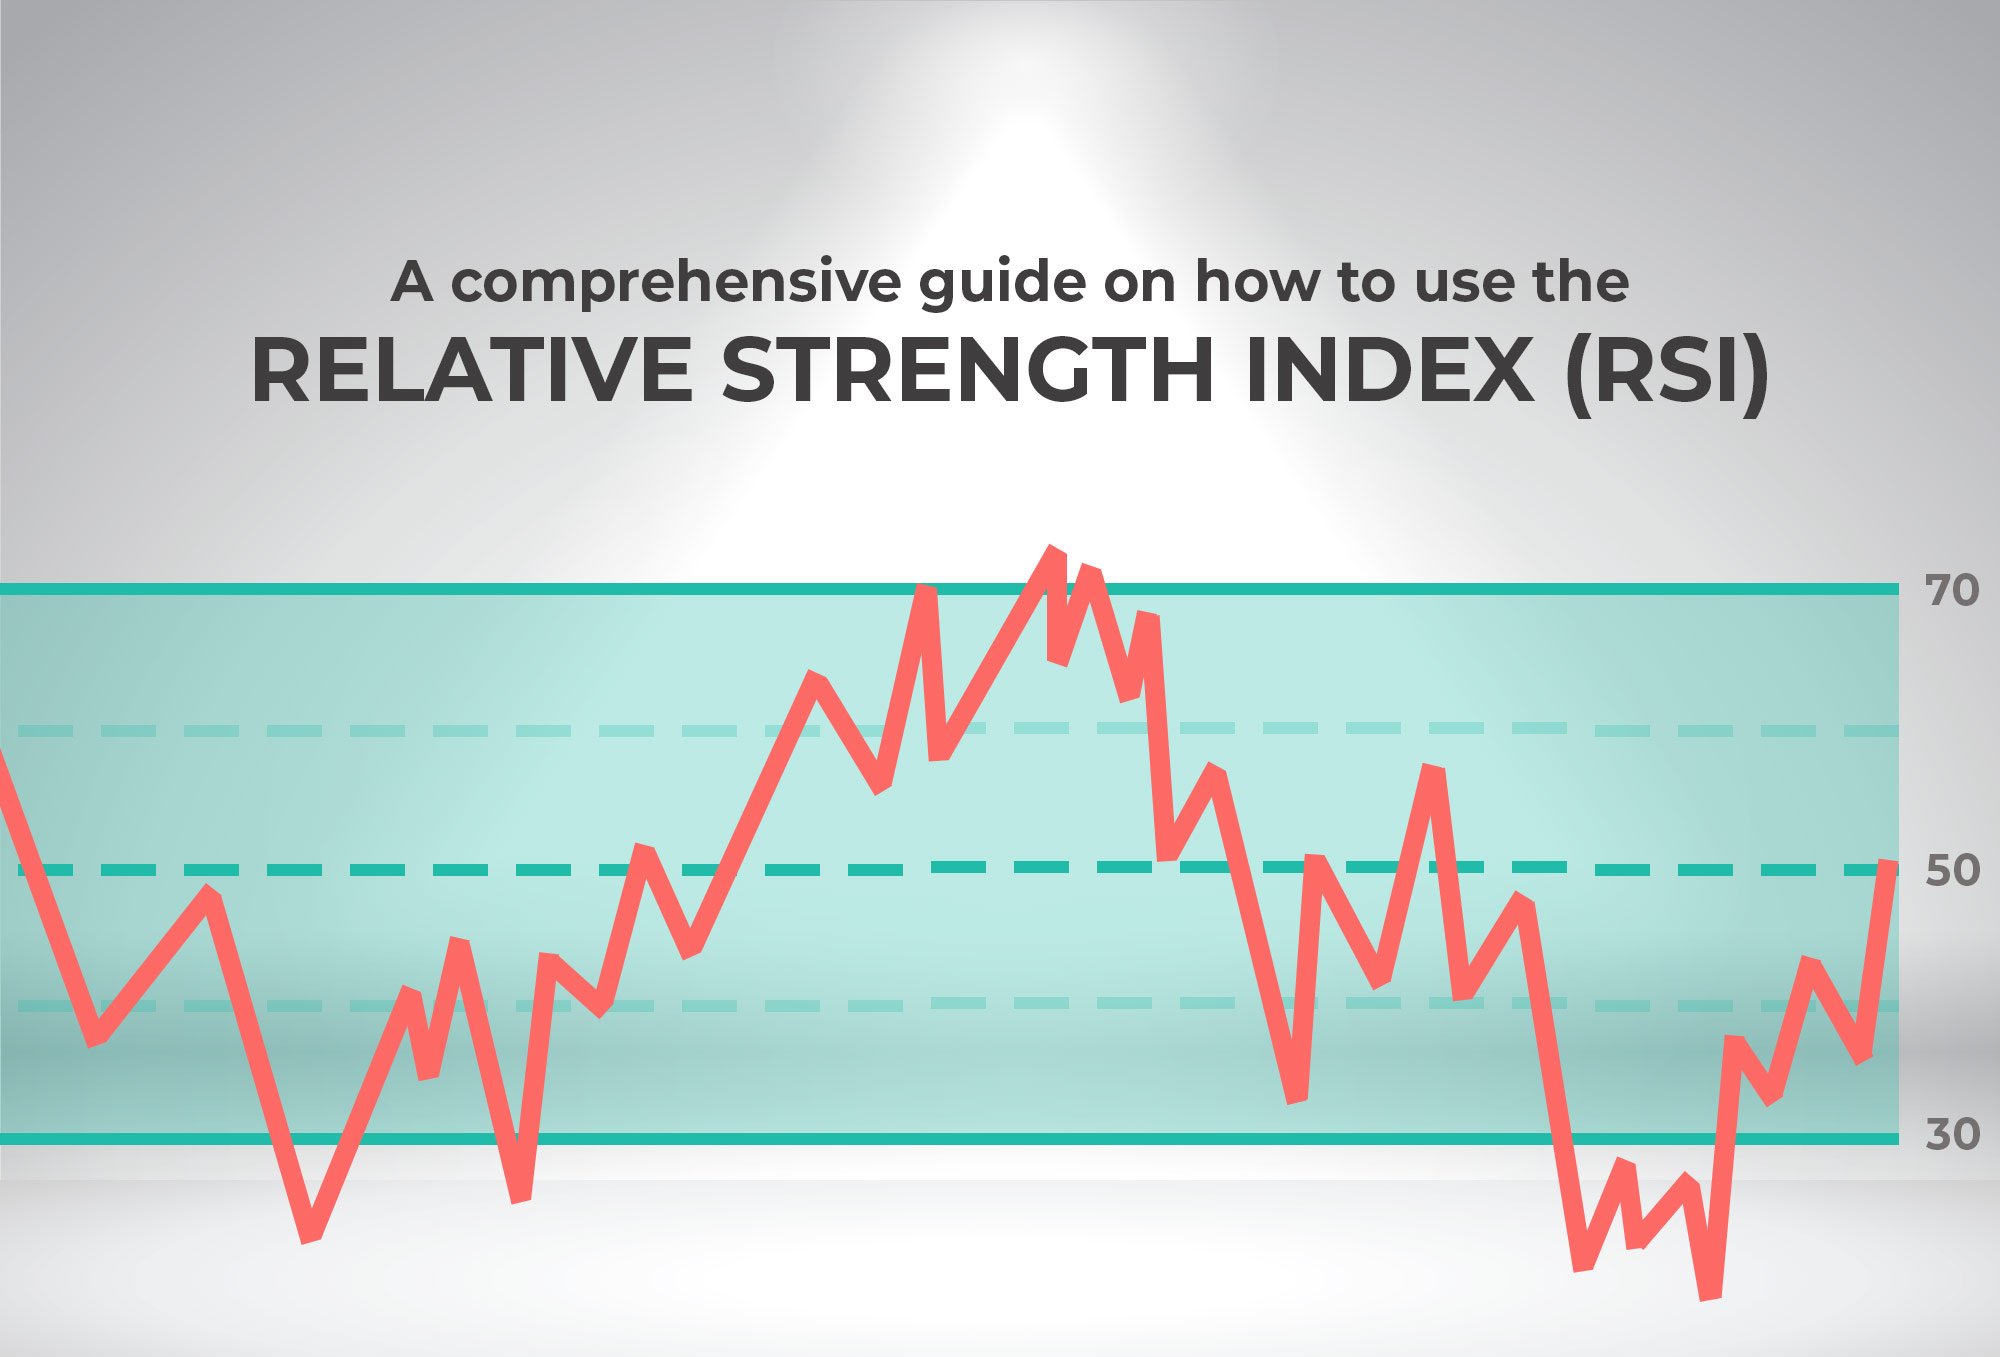
One of the most commonly used technical indicators across all markets is the Relative Strength Index or RSI. Developed by an American technical analyst named J. Welles Wilder, the RSI is a momentum oscillator (whereby oscillators are the most common type of a technical indicator) used primarily by traders to identify the speed and change of price action. The standard setting for the RSI is the 14-period average that oscillates between 70 (cross above is the overbought region) and 30 (cross below is the oversold region). RSI can be used in any timeframe relative to your trading objective.
For those who are puzzled as to what the RSI is, a simple analogy for it is a car’s speedometer. Say you’re driving down South Luzon Expressway (SLEX), the minimum and maximum speed for a car is 60kph and 100kph, respectively. Let’s consider the minimum and maximum speed limit as oversold and overbought. When you go over the speed limit of SLEX, say you’re going 160kph, you’d still be able to go from point a to point b, but the risk of getting apprehended or a vehicular accident is now doubled, if not tripled. Same goes on with RSI, when you entered/bought stock in the overbought region, say in the 90 levels of the RSI, the odds of the stock pulling back is high (meaning it will depreciate in price value due to profit-taking overwhelming buying). So, it’s more likely that you’ll end up in a loss rather than a gain.
The RSI is often used for the following reasons:
• To identify overbought and oversold conditions
• To spot classic and hidden divergences (bullish and bearish)
• To serve as a leading indicator to generate buy and sell signals
Overbought/Oversold Conditions
The chart below shows you the overbought and oversold levels of the RSI (14-period). A stock can proceed to go lower than the oversold line (30) or higher than the overbought line (70) depending on the speed of the movement of price.
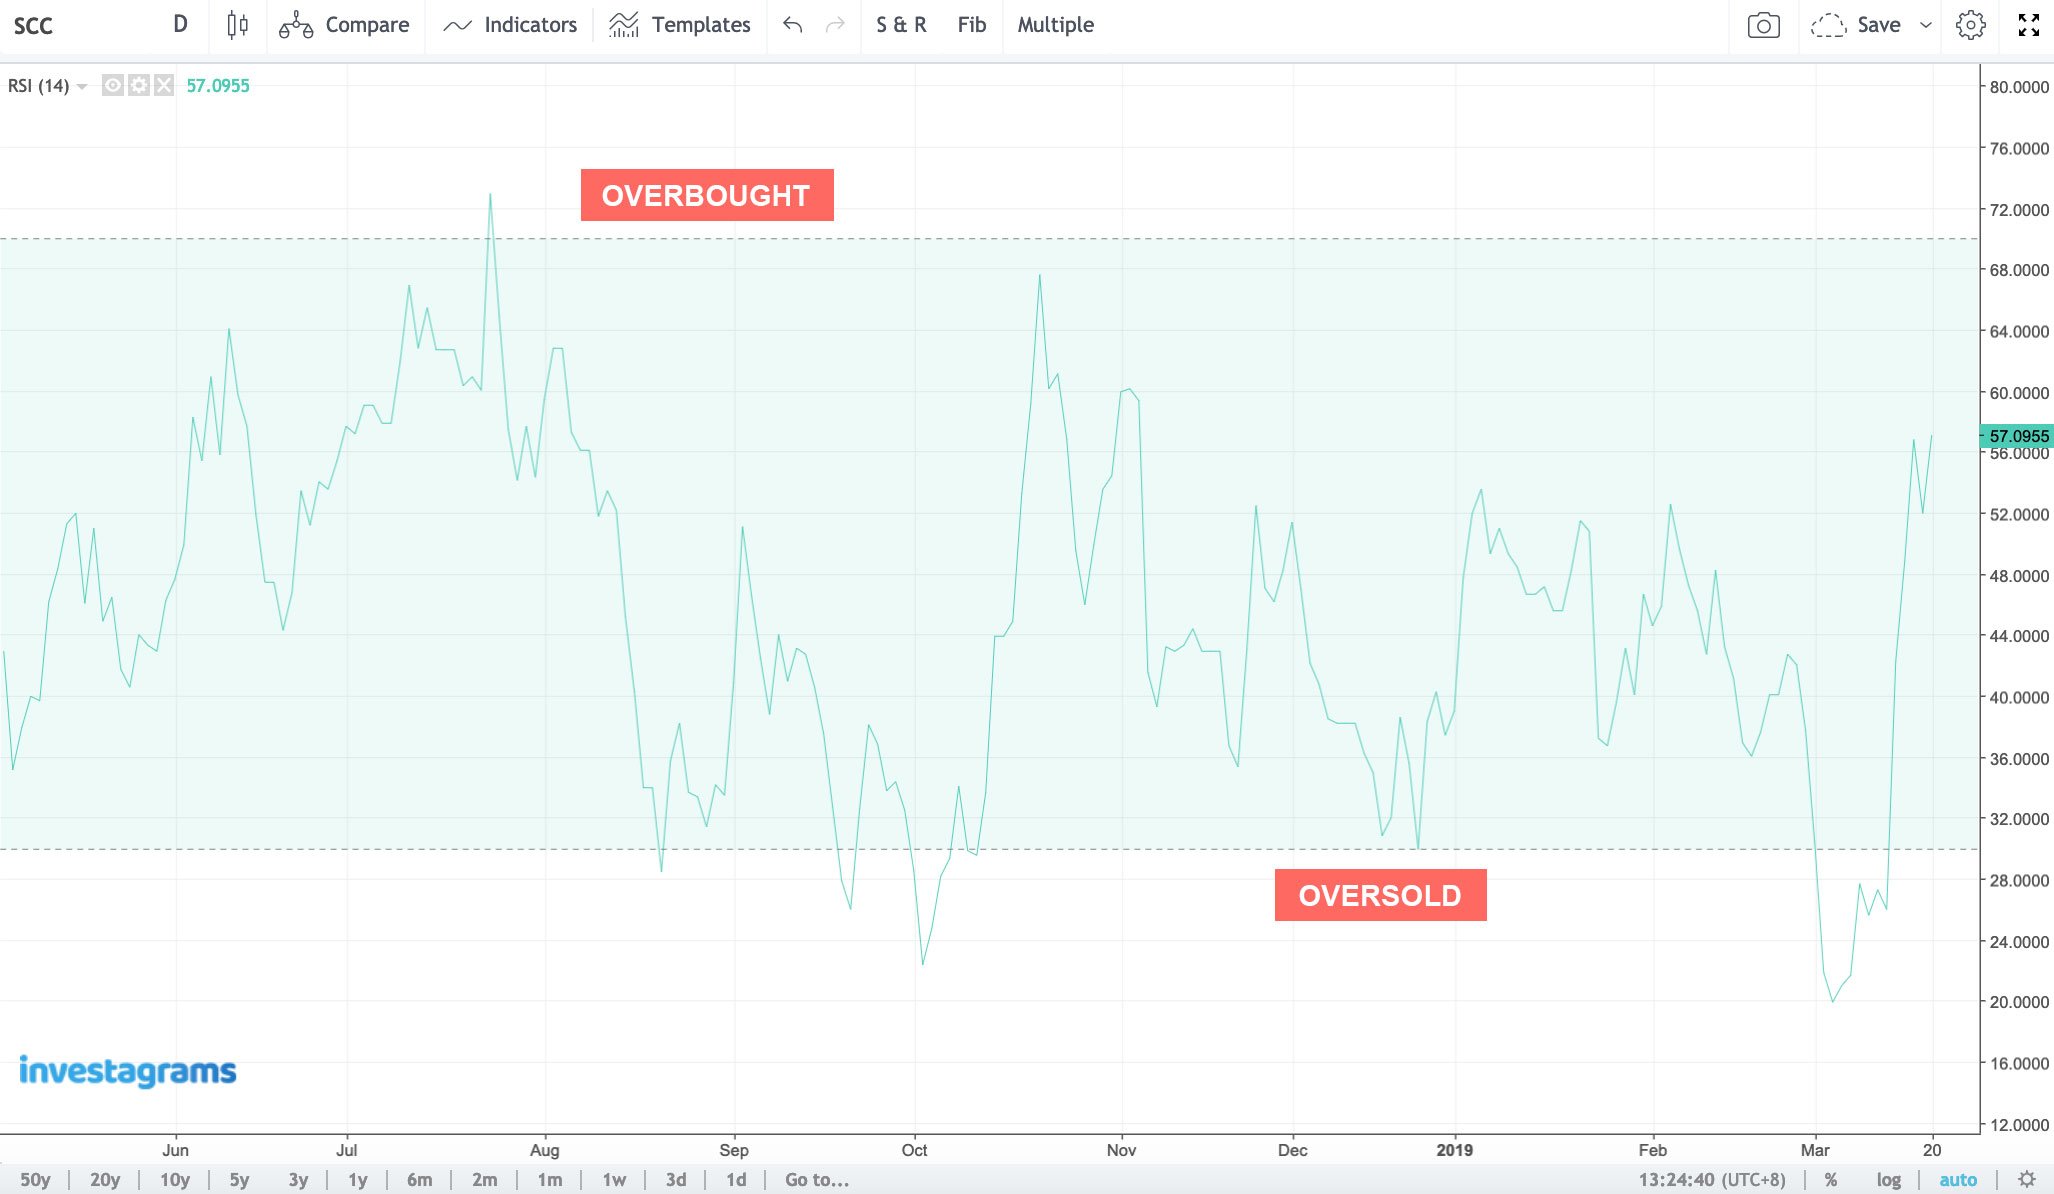
The RSI readings below show that a stock can proceed to go over or under overbought and oversold regions and still go into the same direction.
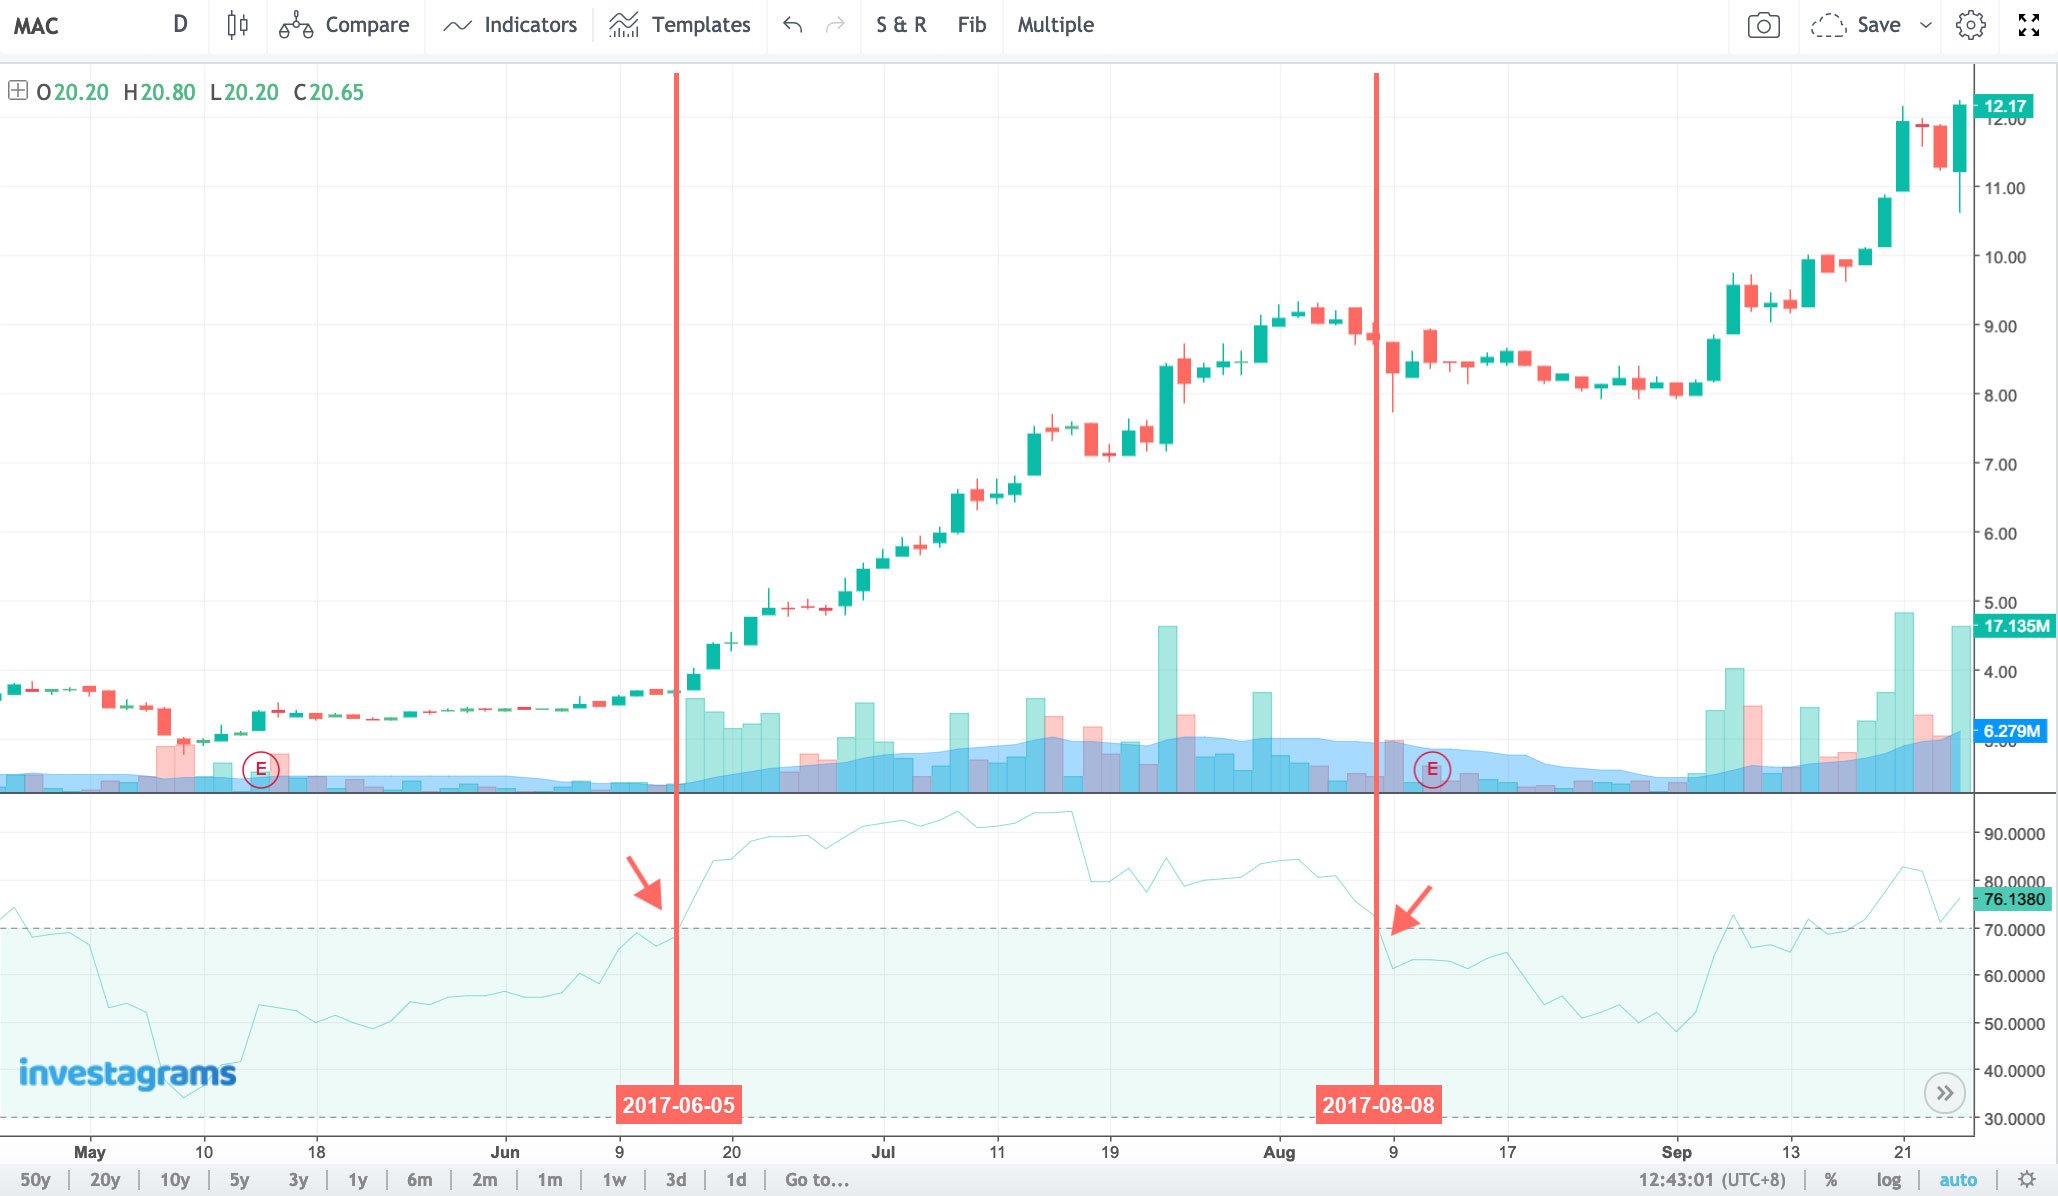
Overbought conditions can be used as a signal to trim down your shares when you are in gain to cash-in some of your profits. It can also be used as a possible signal that a pullback is about to impend. So if you’re the type of trader who’s good at pullback setups, then this may be of use to you.
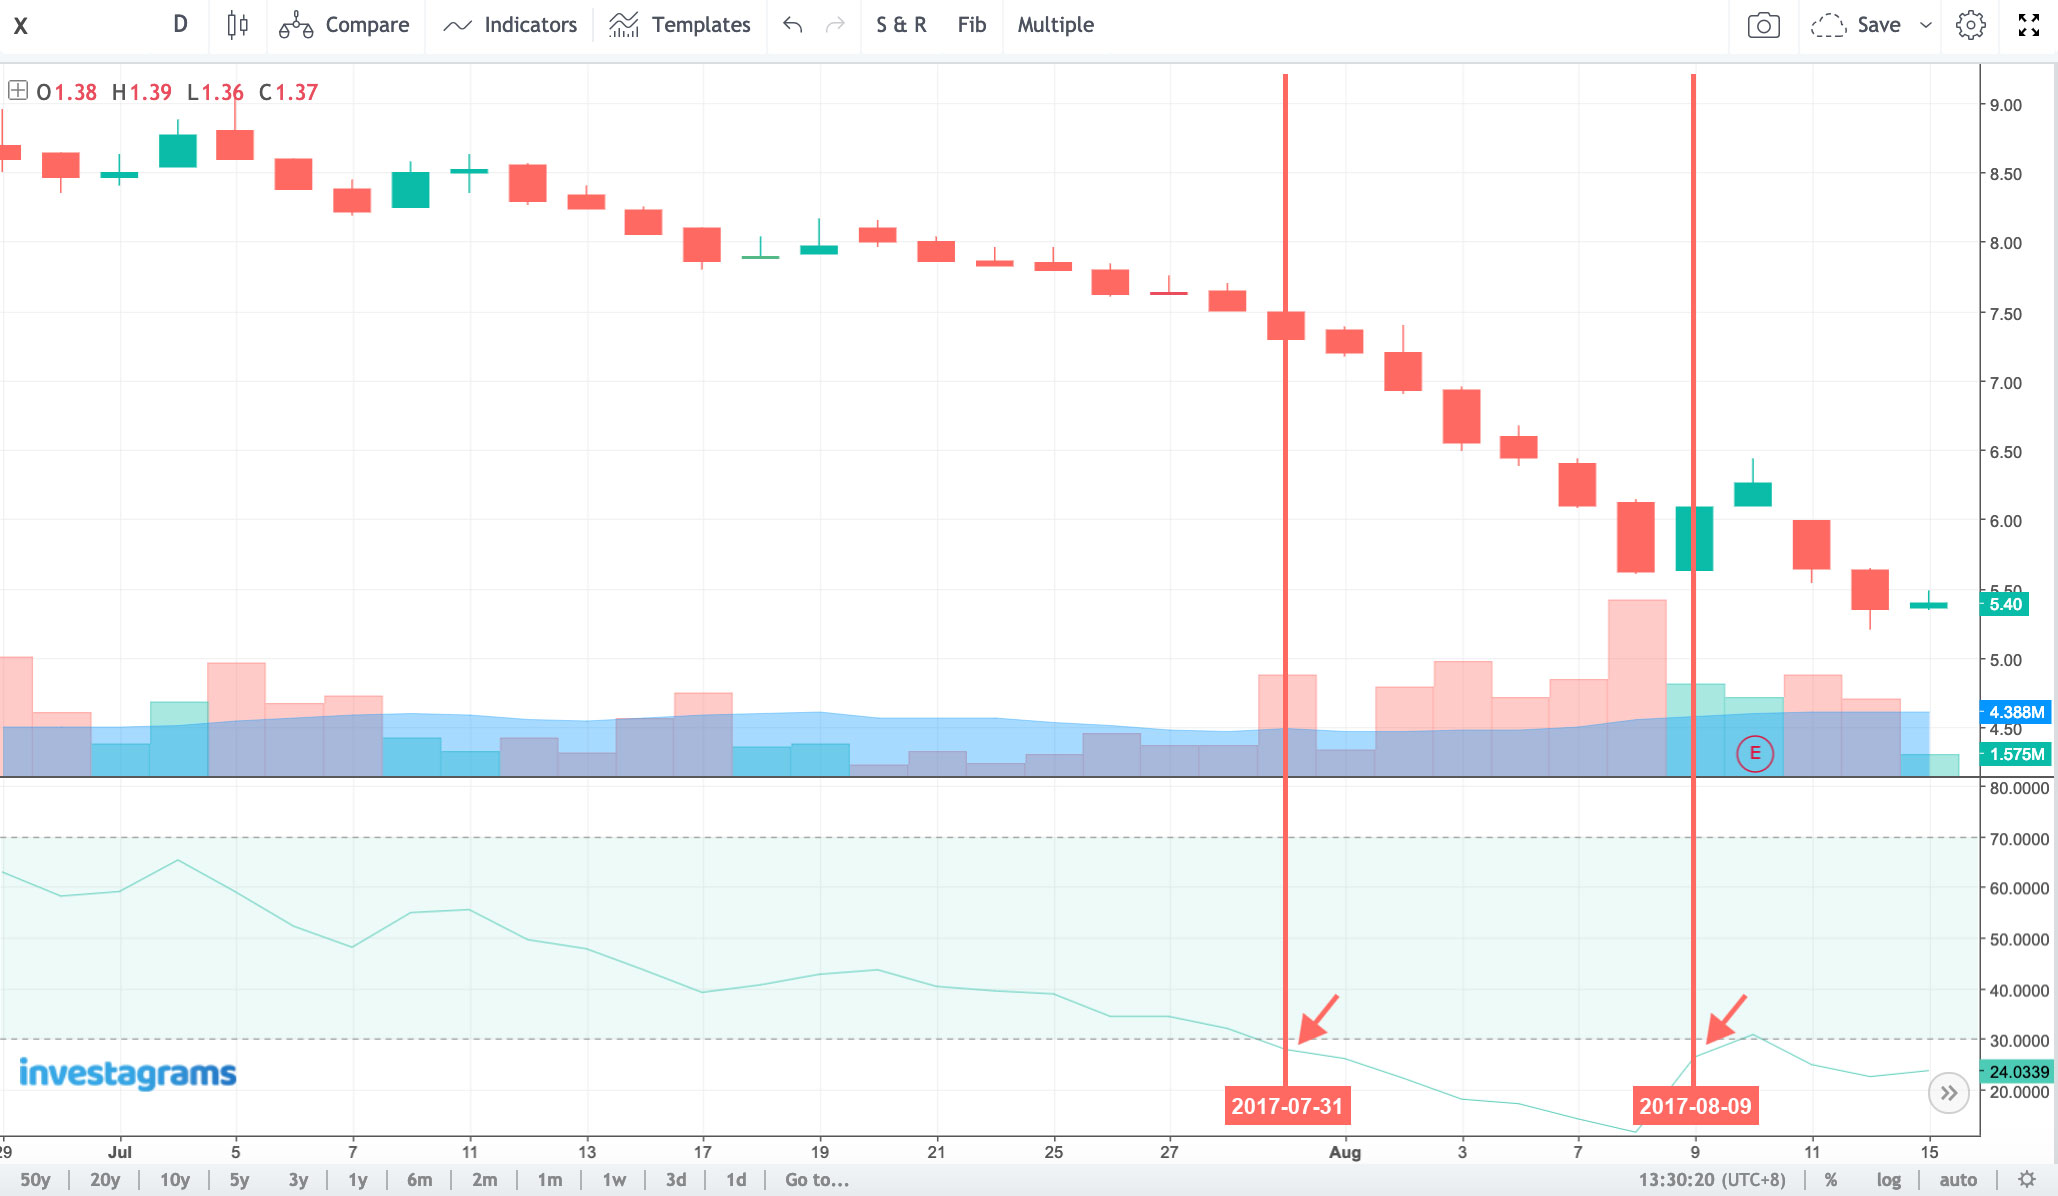
Oversold conditions, meanwhile, can indicate a possible exhaustion in selling. This is where traders who trade bounce plays sometimes look at when they identify their trading setups.
Note that it would be unwise to passively buy stocks just because they’re oversold or to automatically sell all your position when it’s overbought. Always be systematic when buying or selling so that you won’t let greed, fear, or hope, take over your trading.
Divergences
A divergence indicates a possible change or reversal in the underlying trend. It happens when price is not “in-sync” with momentum. Divergence is not limited only to the RSI as this could also be seen in other indicators such as Moving Average Convergence/Divergence (MACD) and the Commodity Channel Index (CCI), to name a few. When divergence is found in a higher timeframe (like weekly, monthly), it’ll give a much stronger signal.
There are two types of divergences: the bullish and the bearish. When looking for the latter, search for lows. For the former, look at the highs.
Bullish Divergence
A bullish divergence (positive divergence) happens when price makes a lower low whereas the momentum indicator makes a higher low. This means that there is a high probability that selling-pressure is weakening and buying (demand) could soon take over.
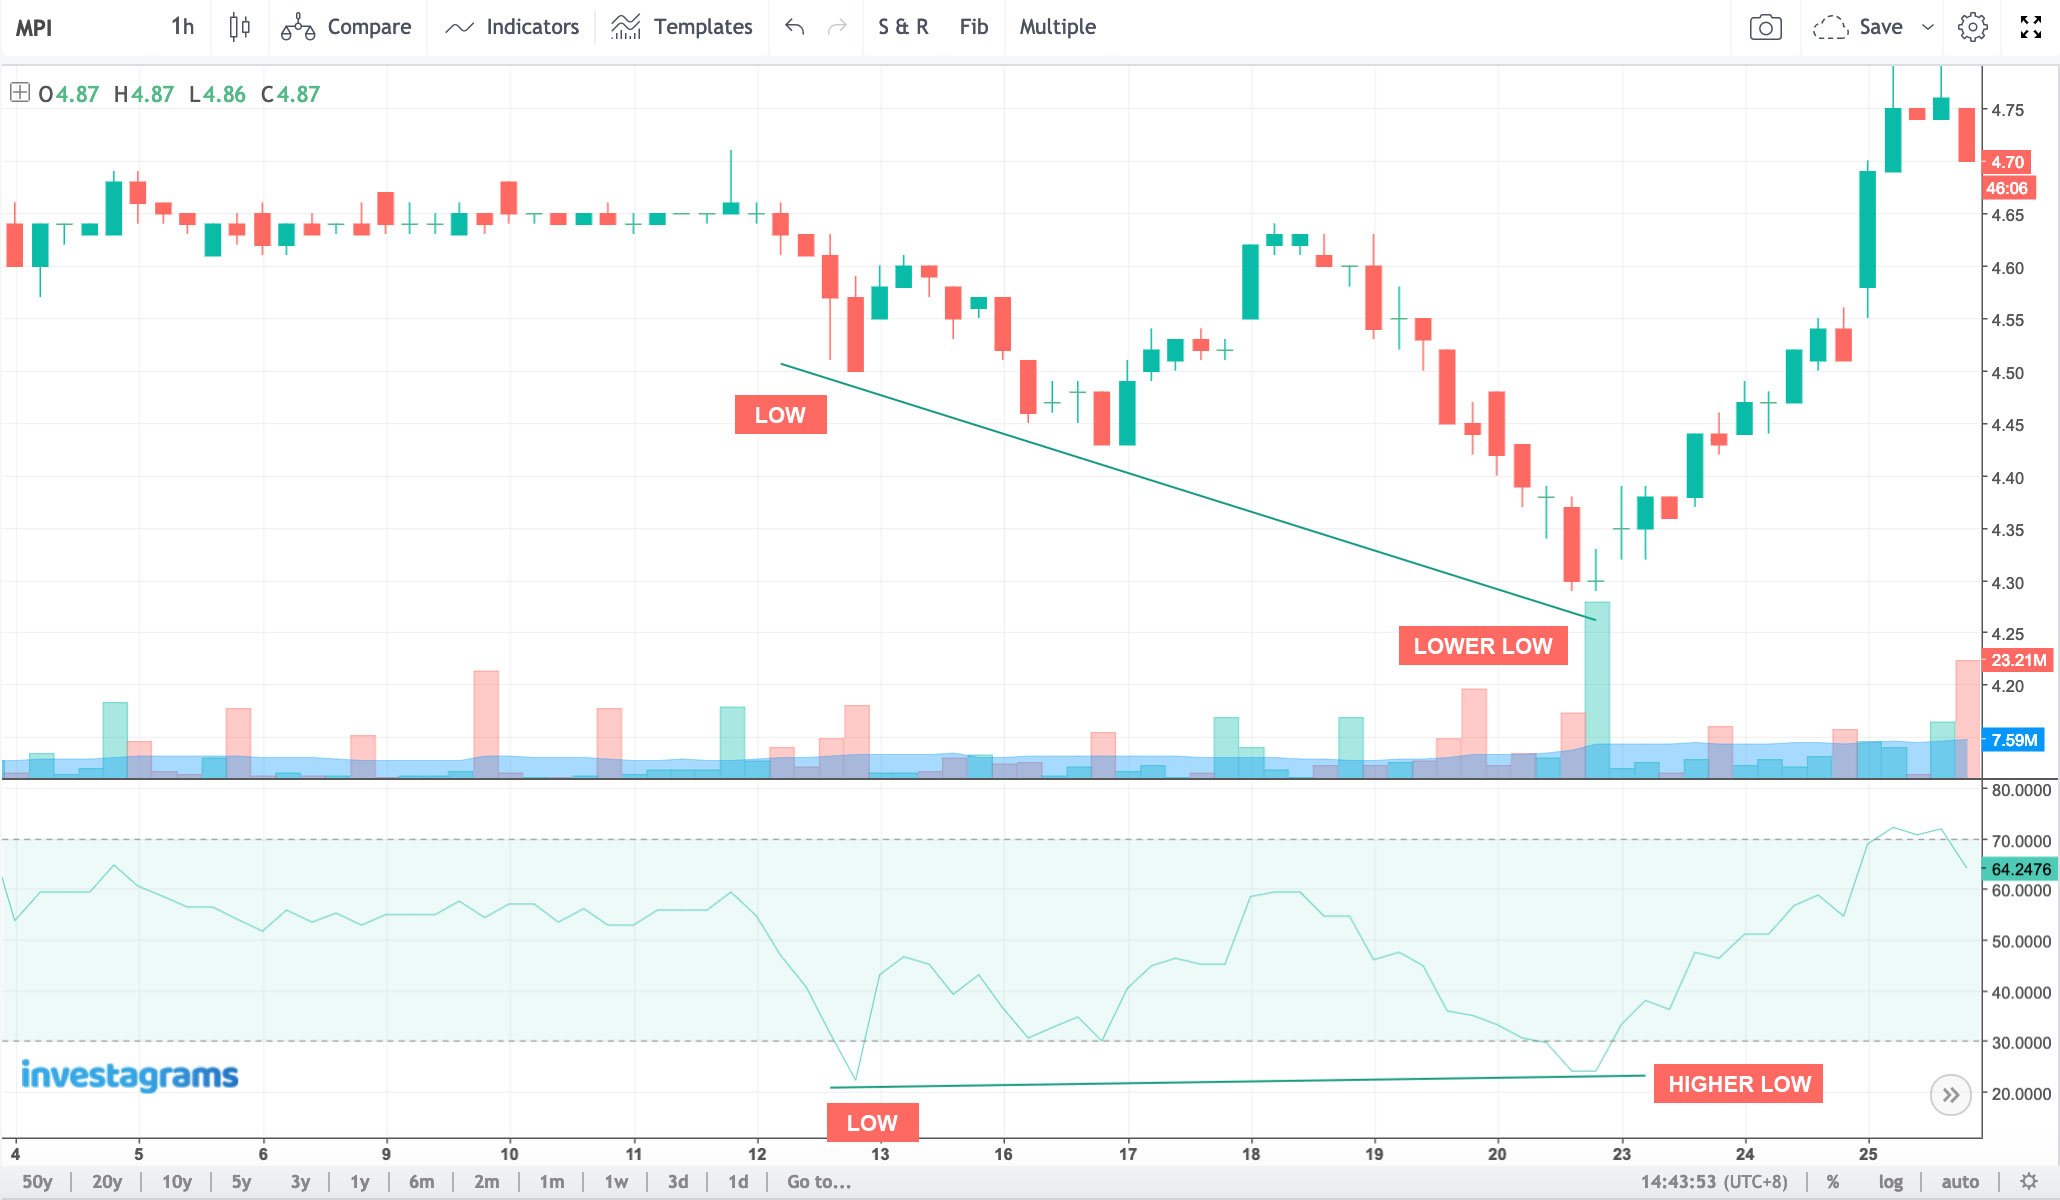
After Metro Pacific Investments Corporation (MPI) generated a bullish divergence using the RSI (14) in the 1-hour timeframe, it went on to break the previous high around 4.65/sh and then created a higher high around 4.75/sh. It also created a higher low in the few candlesticks. The bullish divergence signified the change in trend, from a downtrend to an uptrend, for MPI.
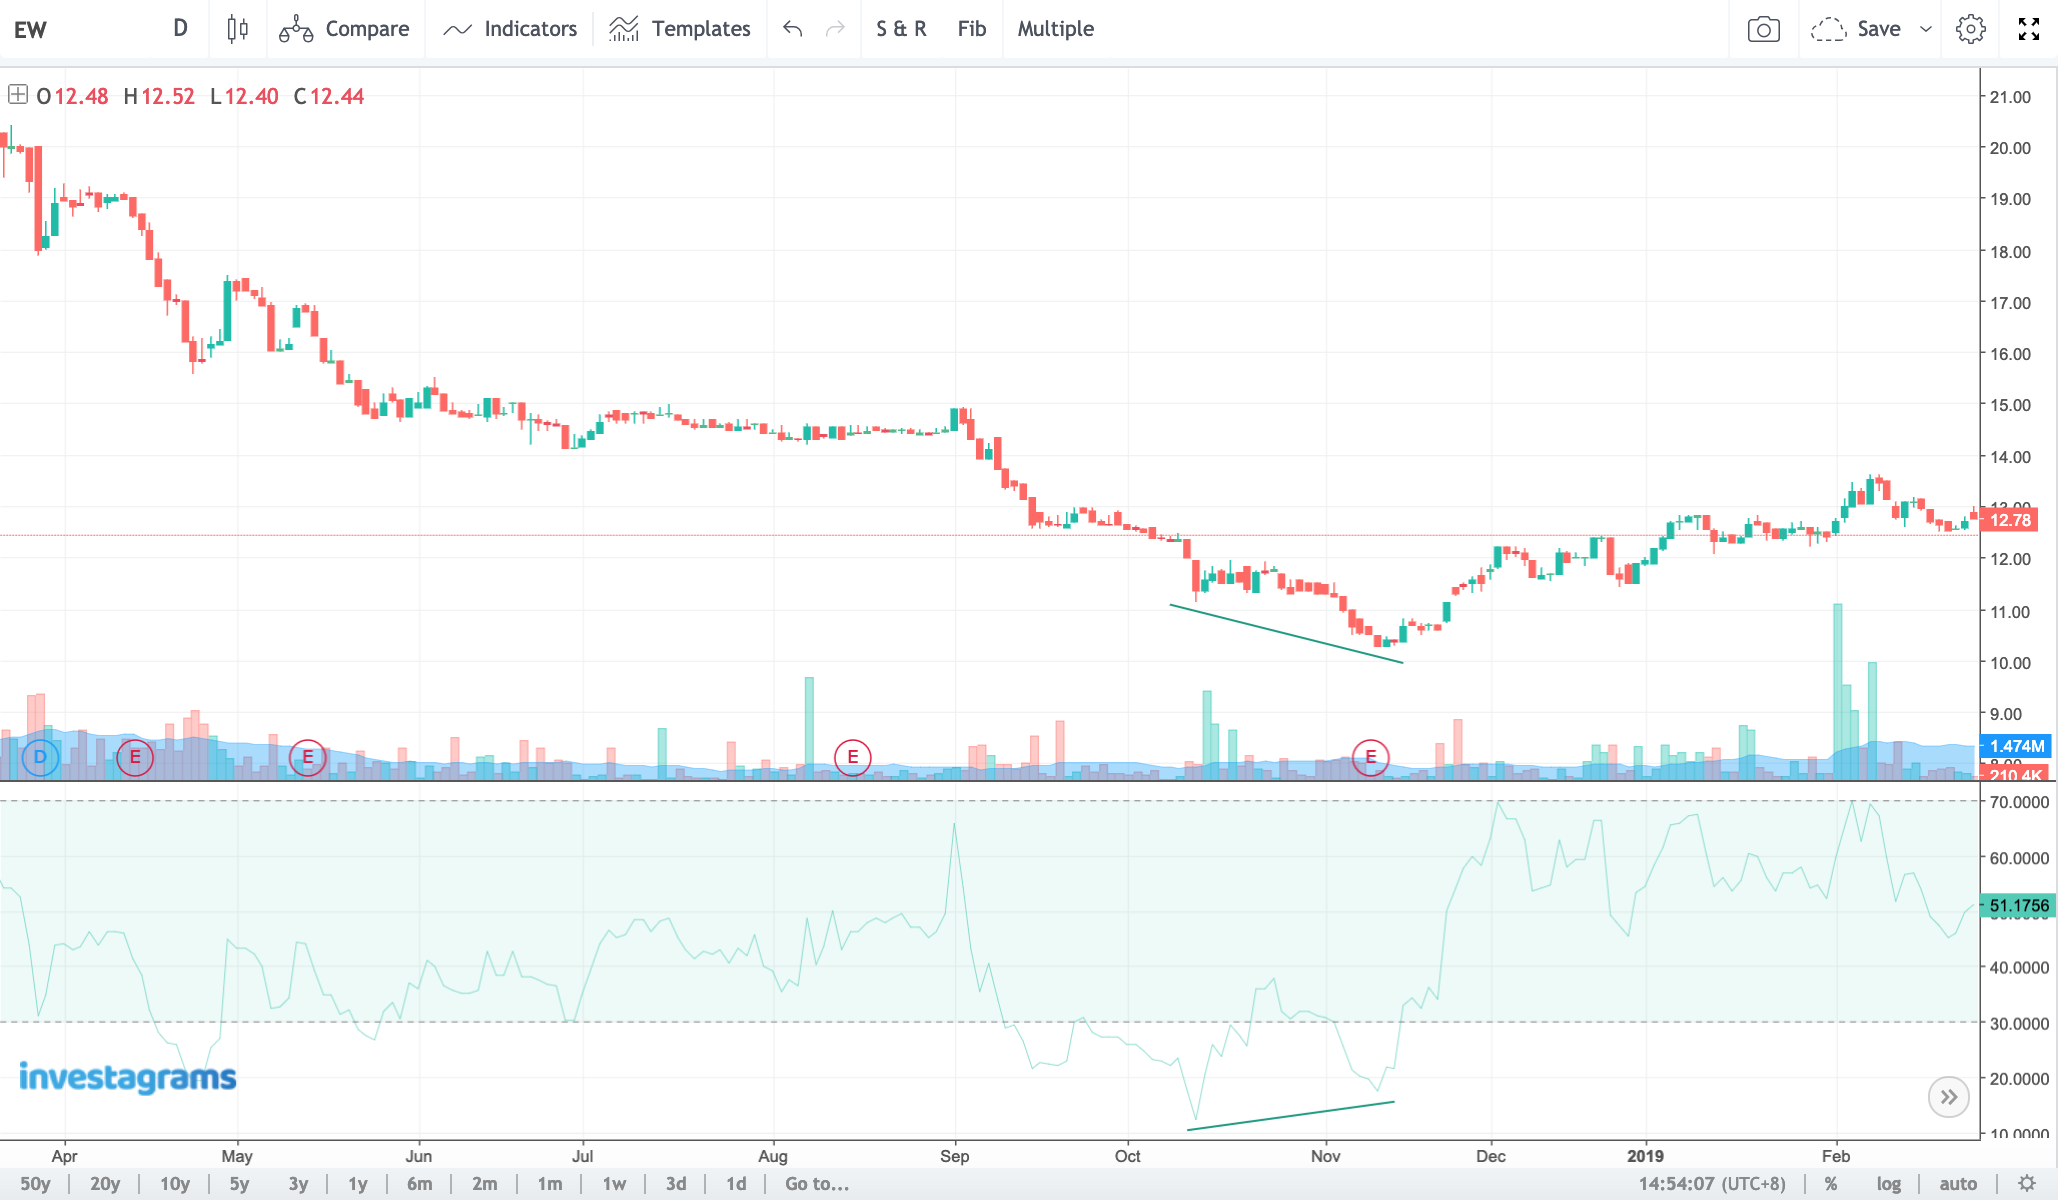
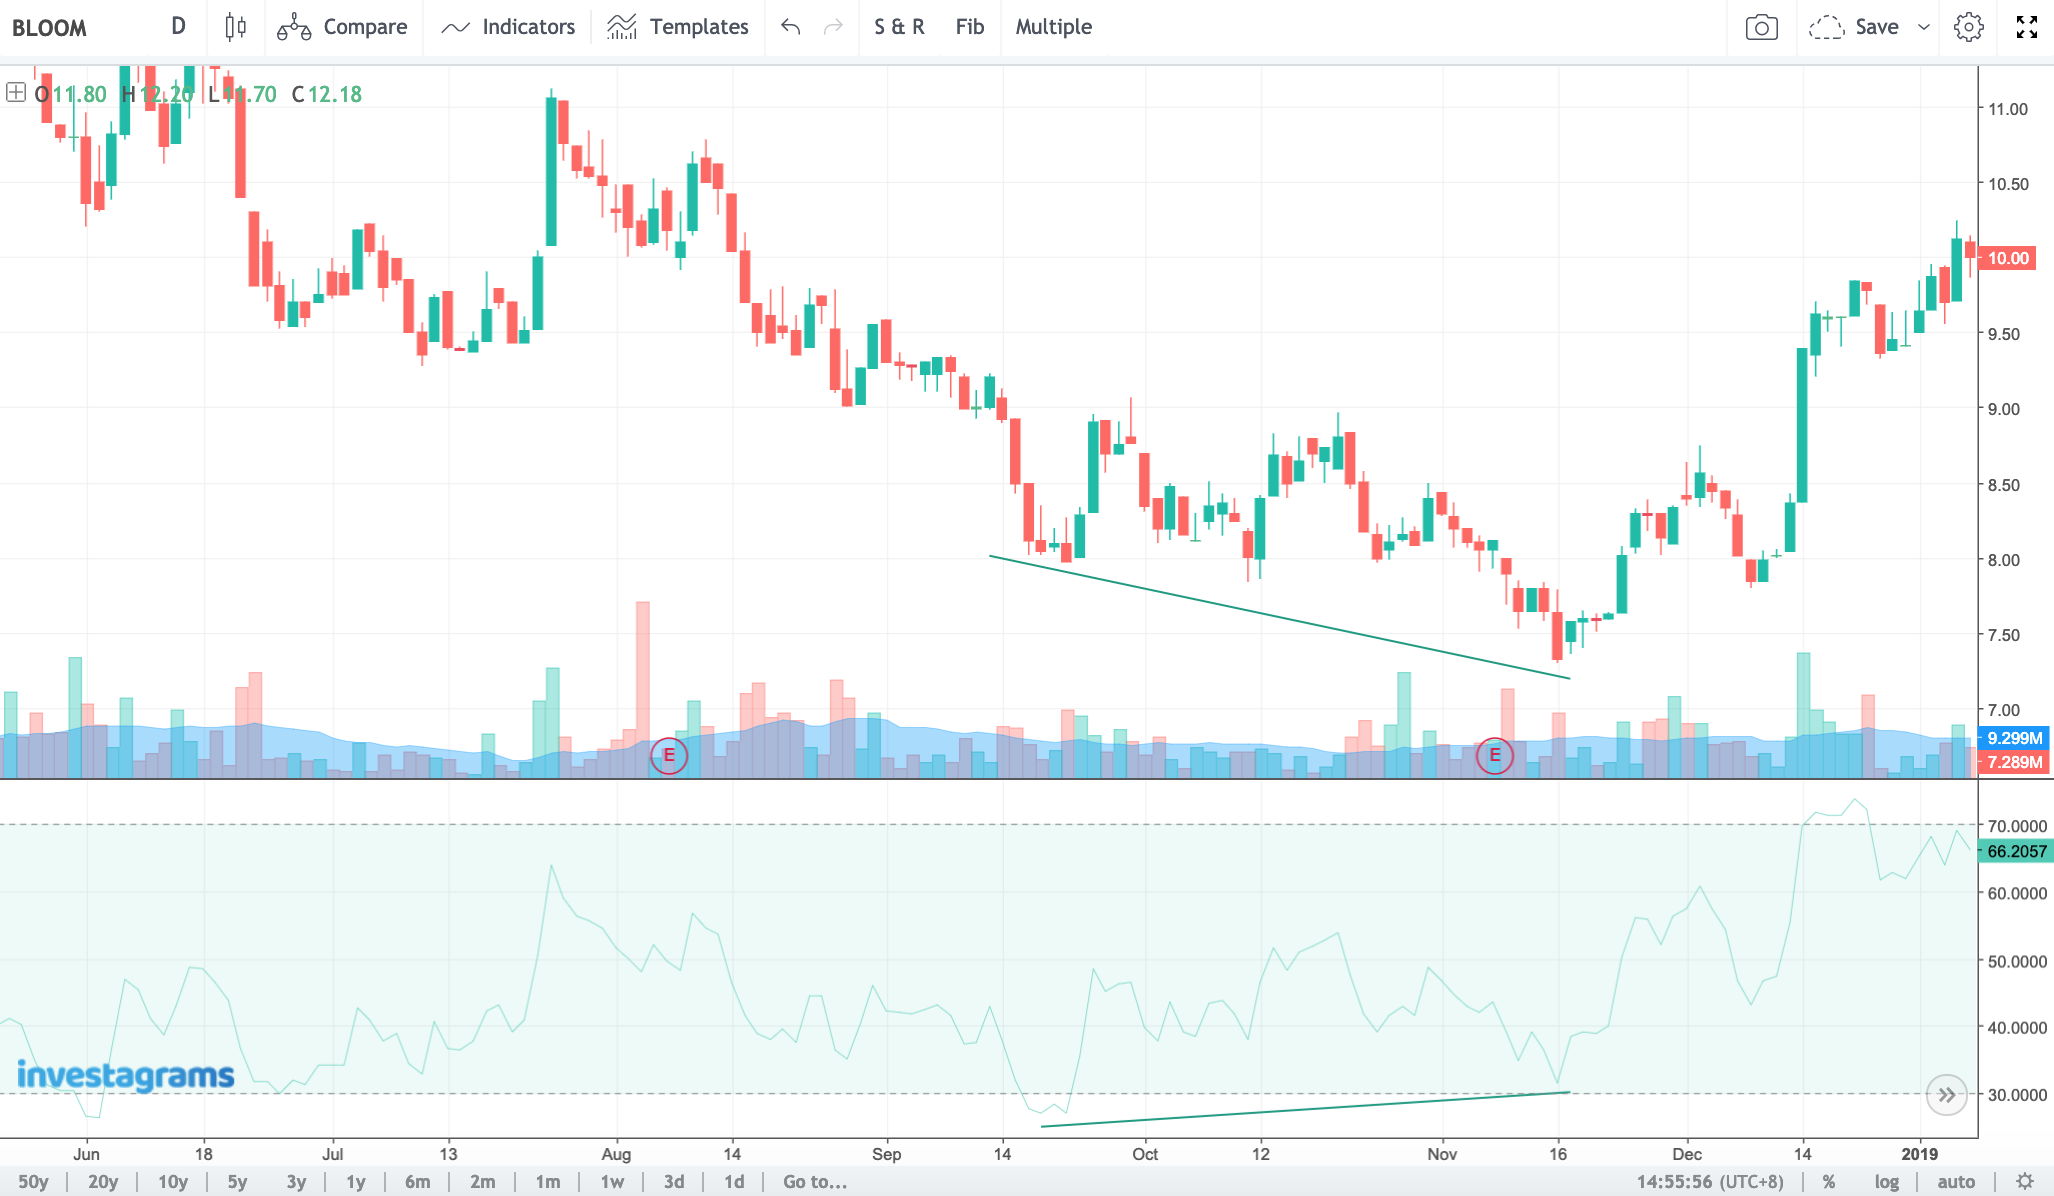
Below are a few more examples:
Bearish Divergence
A bearish divergence (sometimes called as negative divergence) happens when price makes a higher high but the momentum indicator makes a lower high which means that the buying momentum was not strong enough to warrant a new high. It could be an indication that buying is waning down, and profit-taking is imminent.
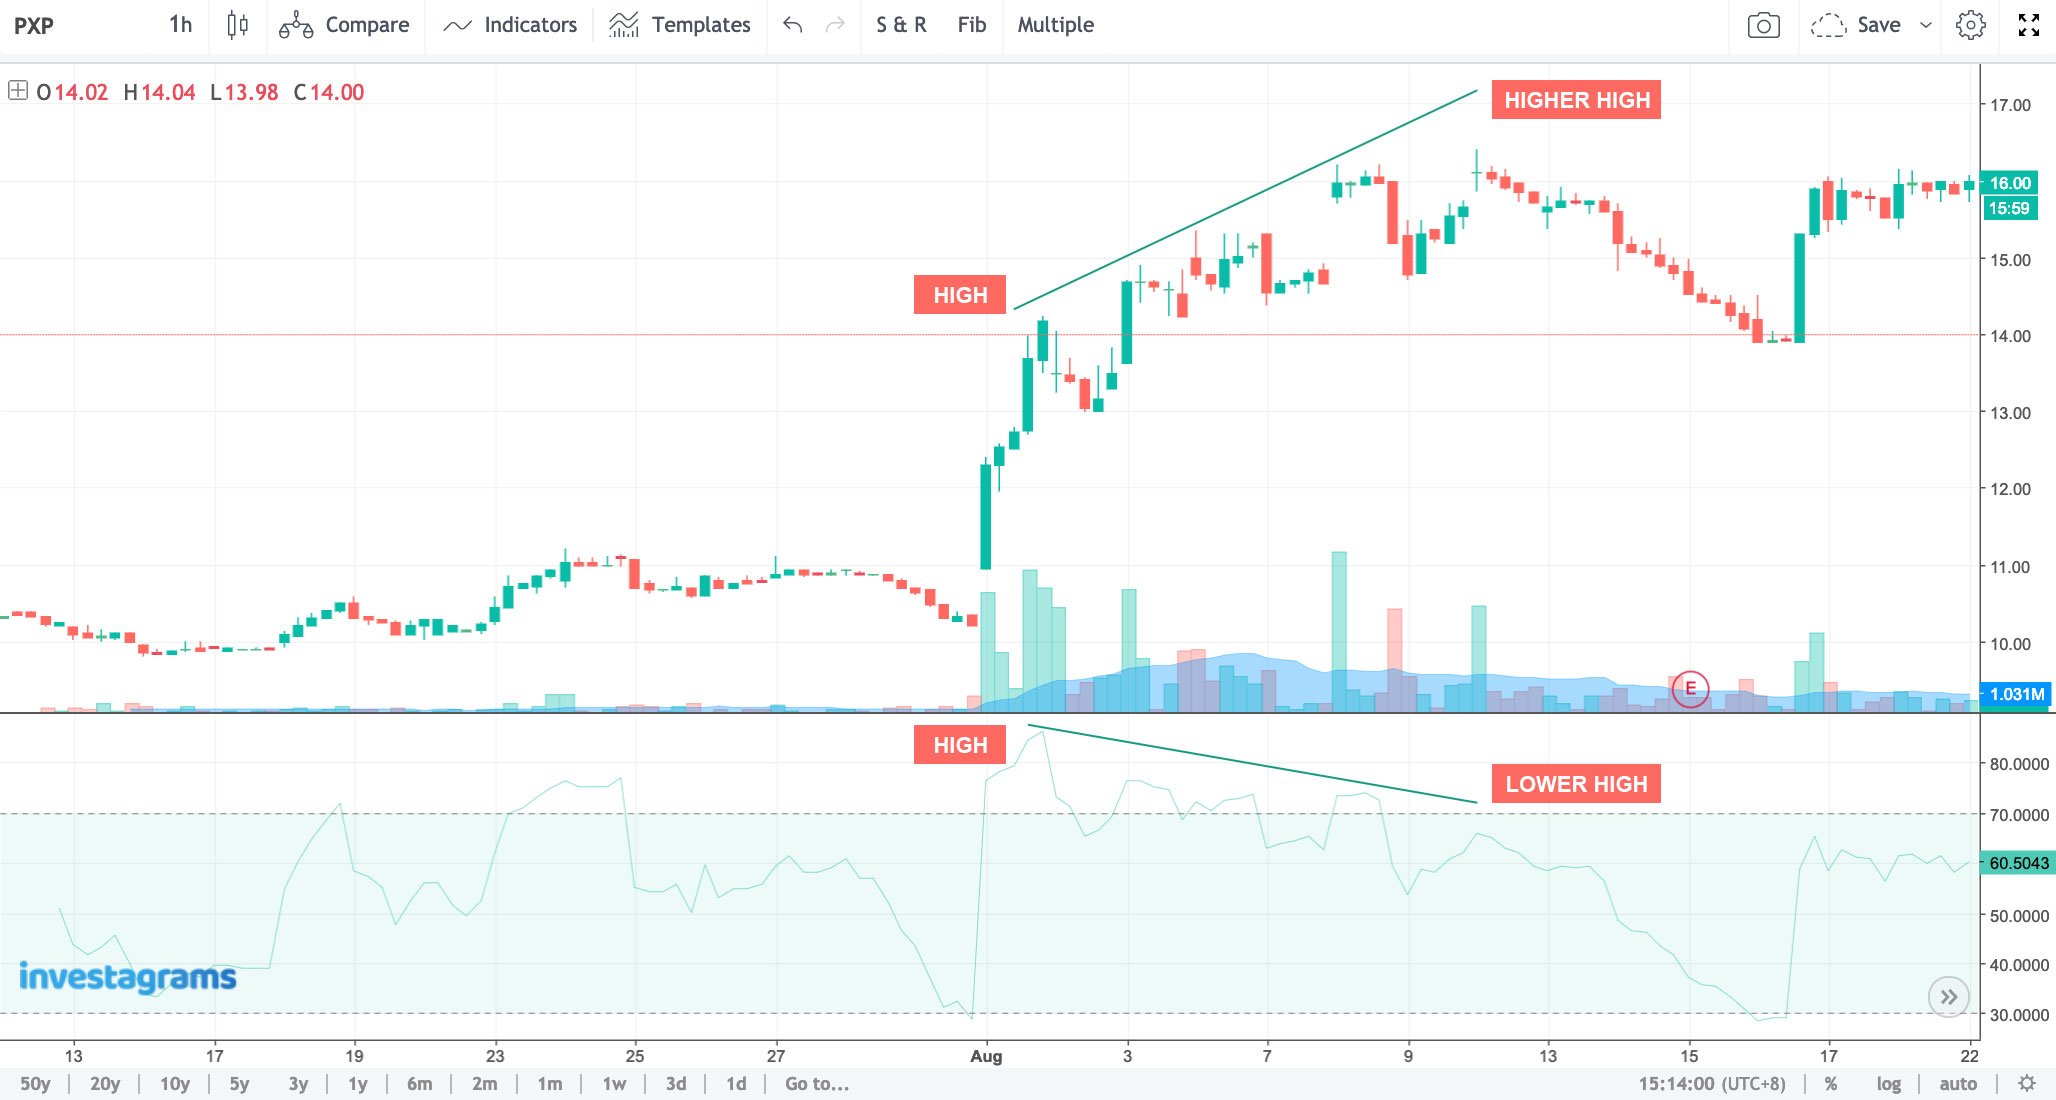
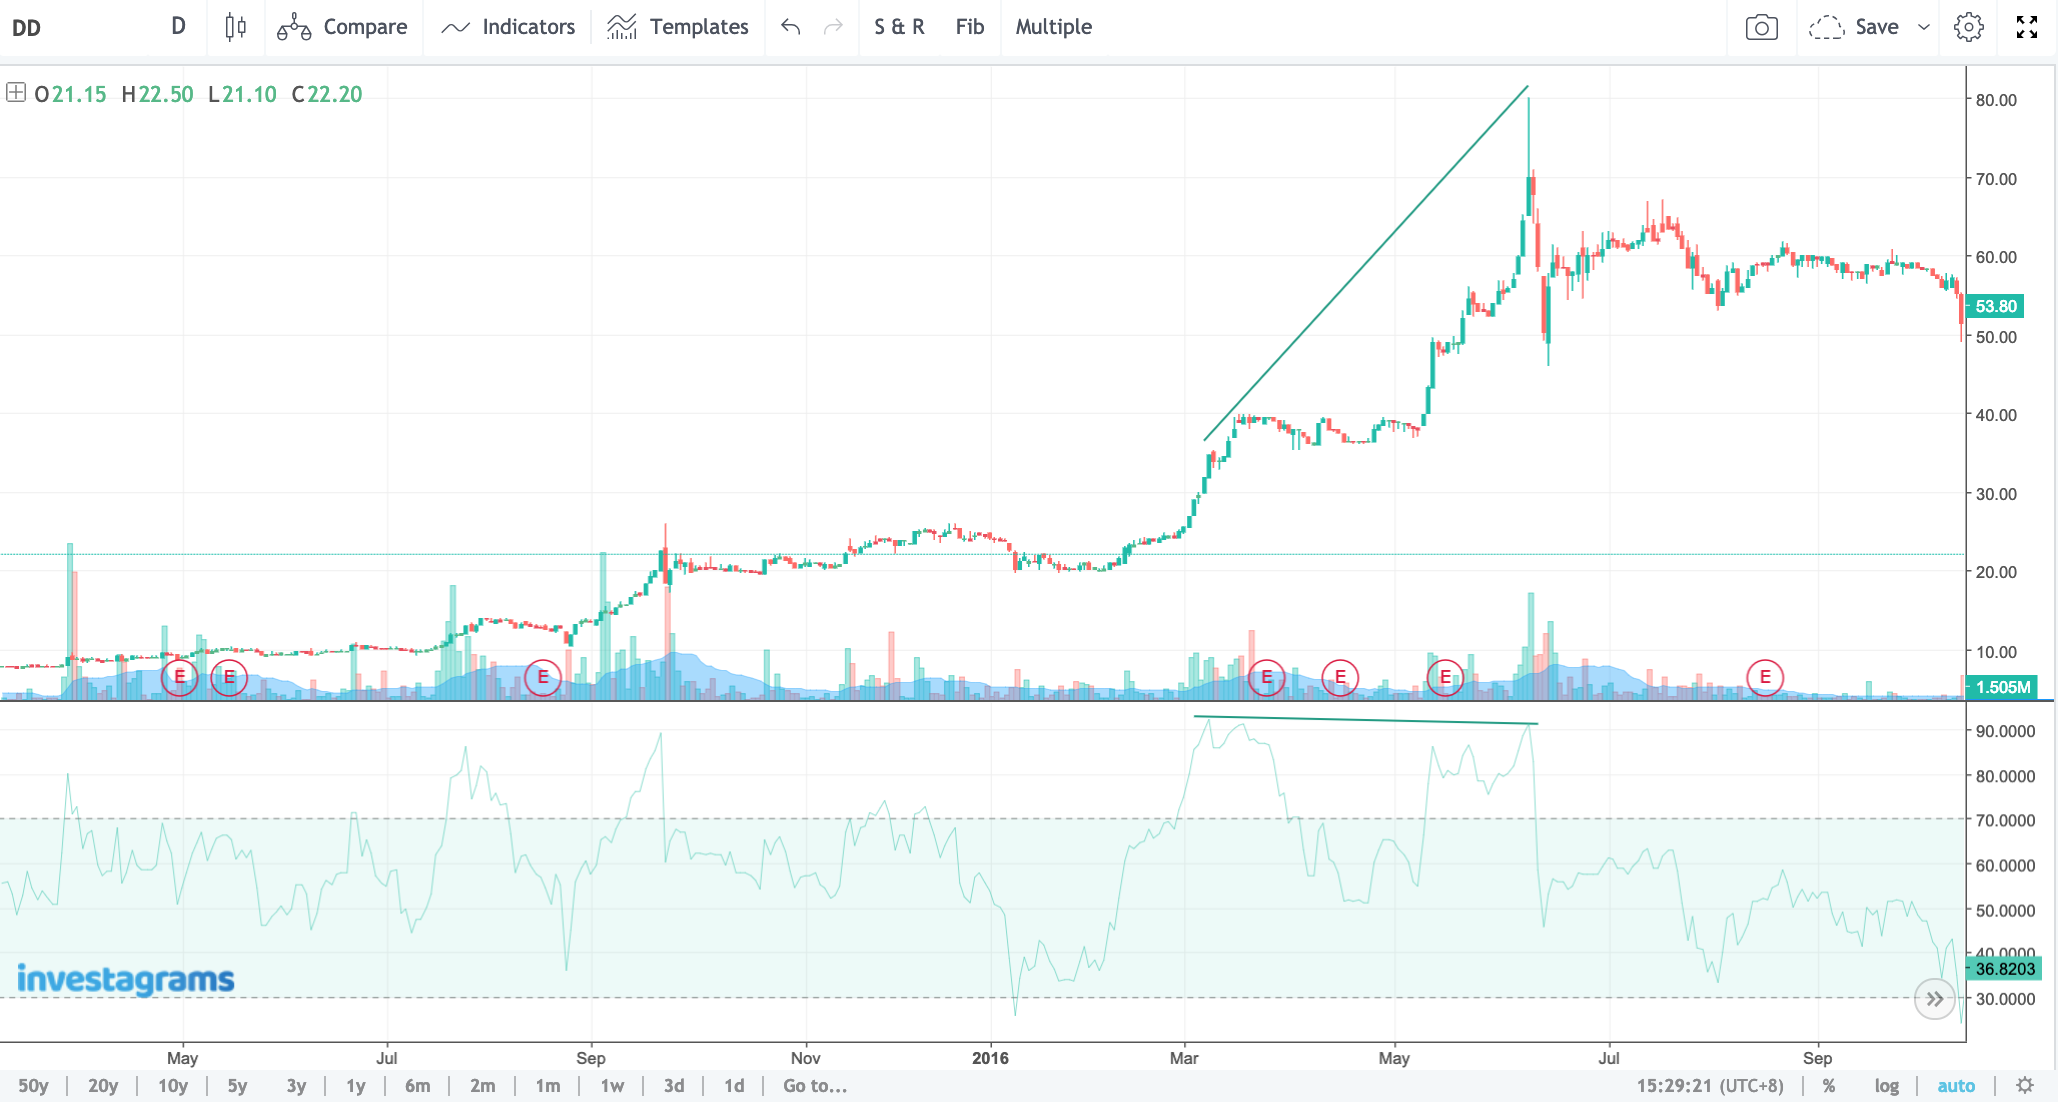
Divergence can be as subtle as the one you can see below. The angle of the slope line may not be as angled as the previous charts you saw. But if you observe closely, the exact RSI reading of the high on the left (RSI = 92.3651) from the high on the right (RSI = 91.4676), it would show that it indeed made a lower high. And as you can see on the right side of the chart, the stock went on to start a downtrend (series of lower lows and lower highs).
Hidden Divergences
Hidden divergences are different from classic divergences. The latter indicates that there could be a reversal (uptrend to downtrend or downtrend to uptrend) to the underlying trend, whereas the former could sign as a continuation in the current trend. The theory of “buying the dips, selling the rallies” may be utilized here.
Hidden Bullish Divergence
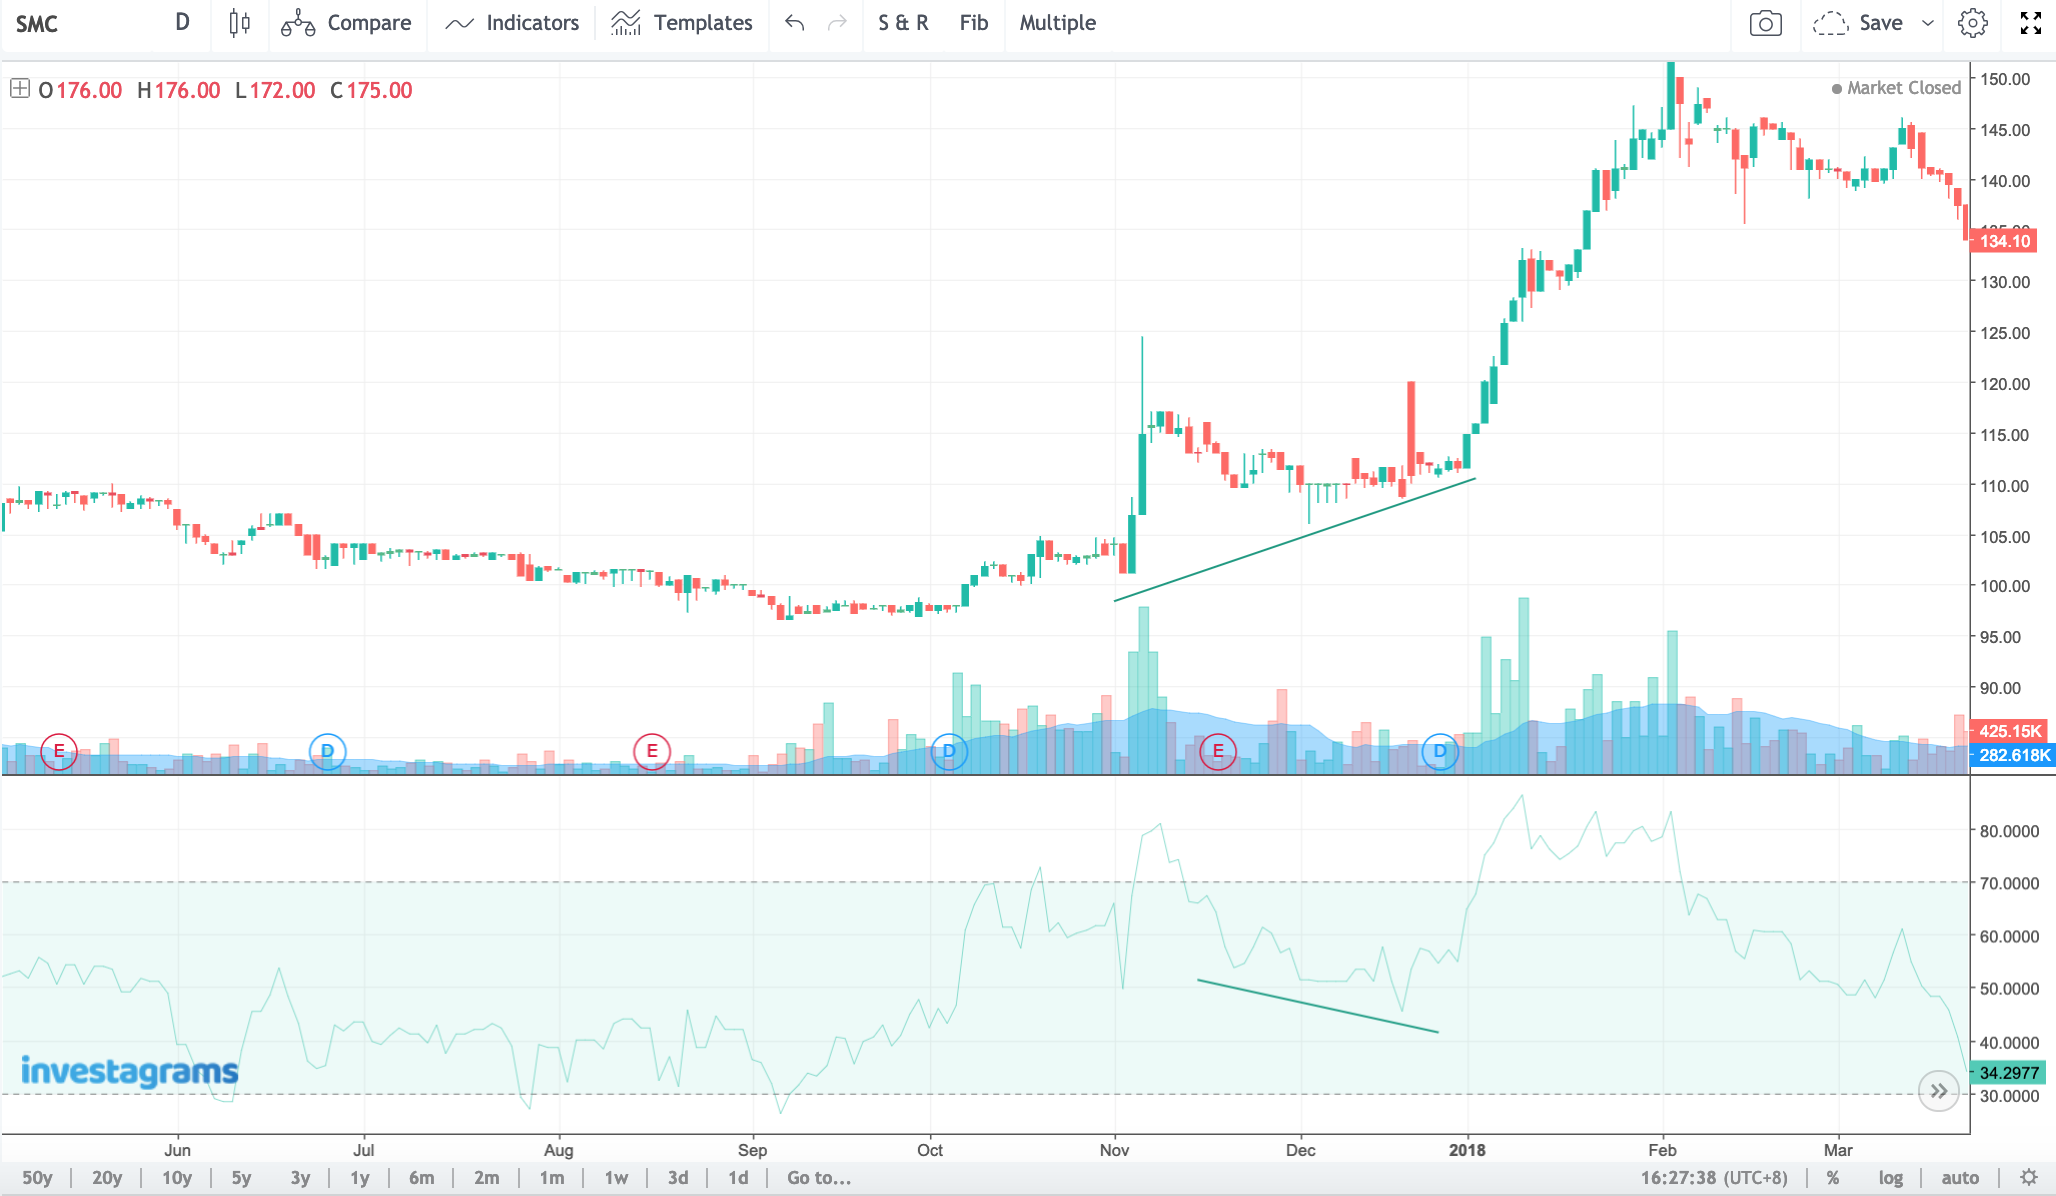
Hidden Bullish Divergence often found during retracements in an uptrend. As you can see in the chart below, San Miguel Corporation (SMC) is in an uptrend when the hidden divergence is spotted during the pullback in price action. The concept of “buying the dips” can be used here.
Hidden Bearish Divergence
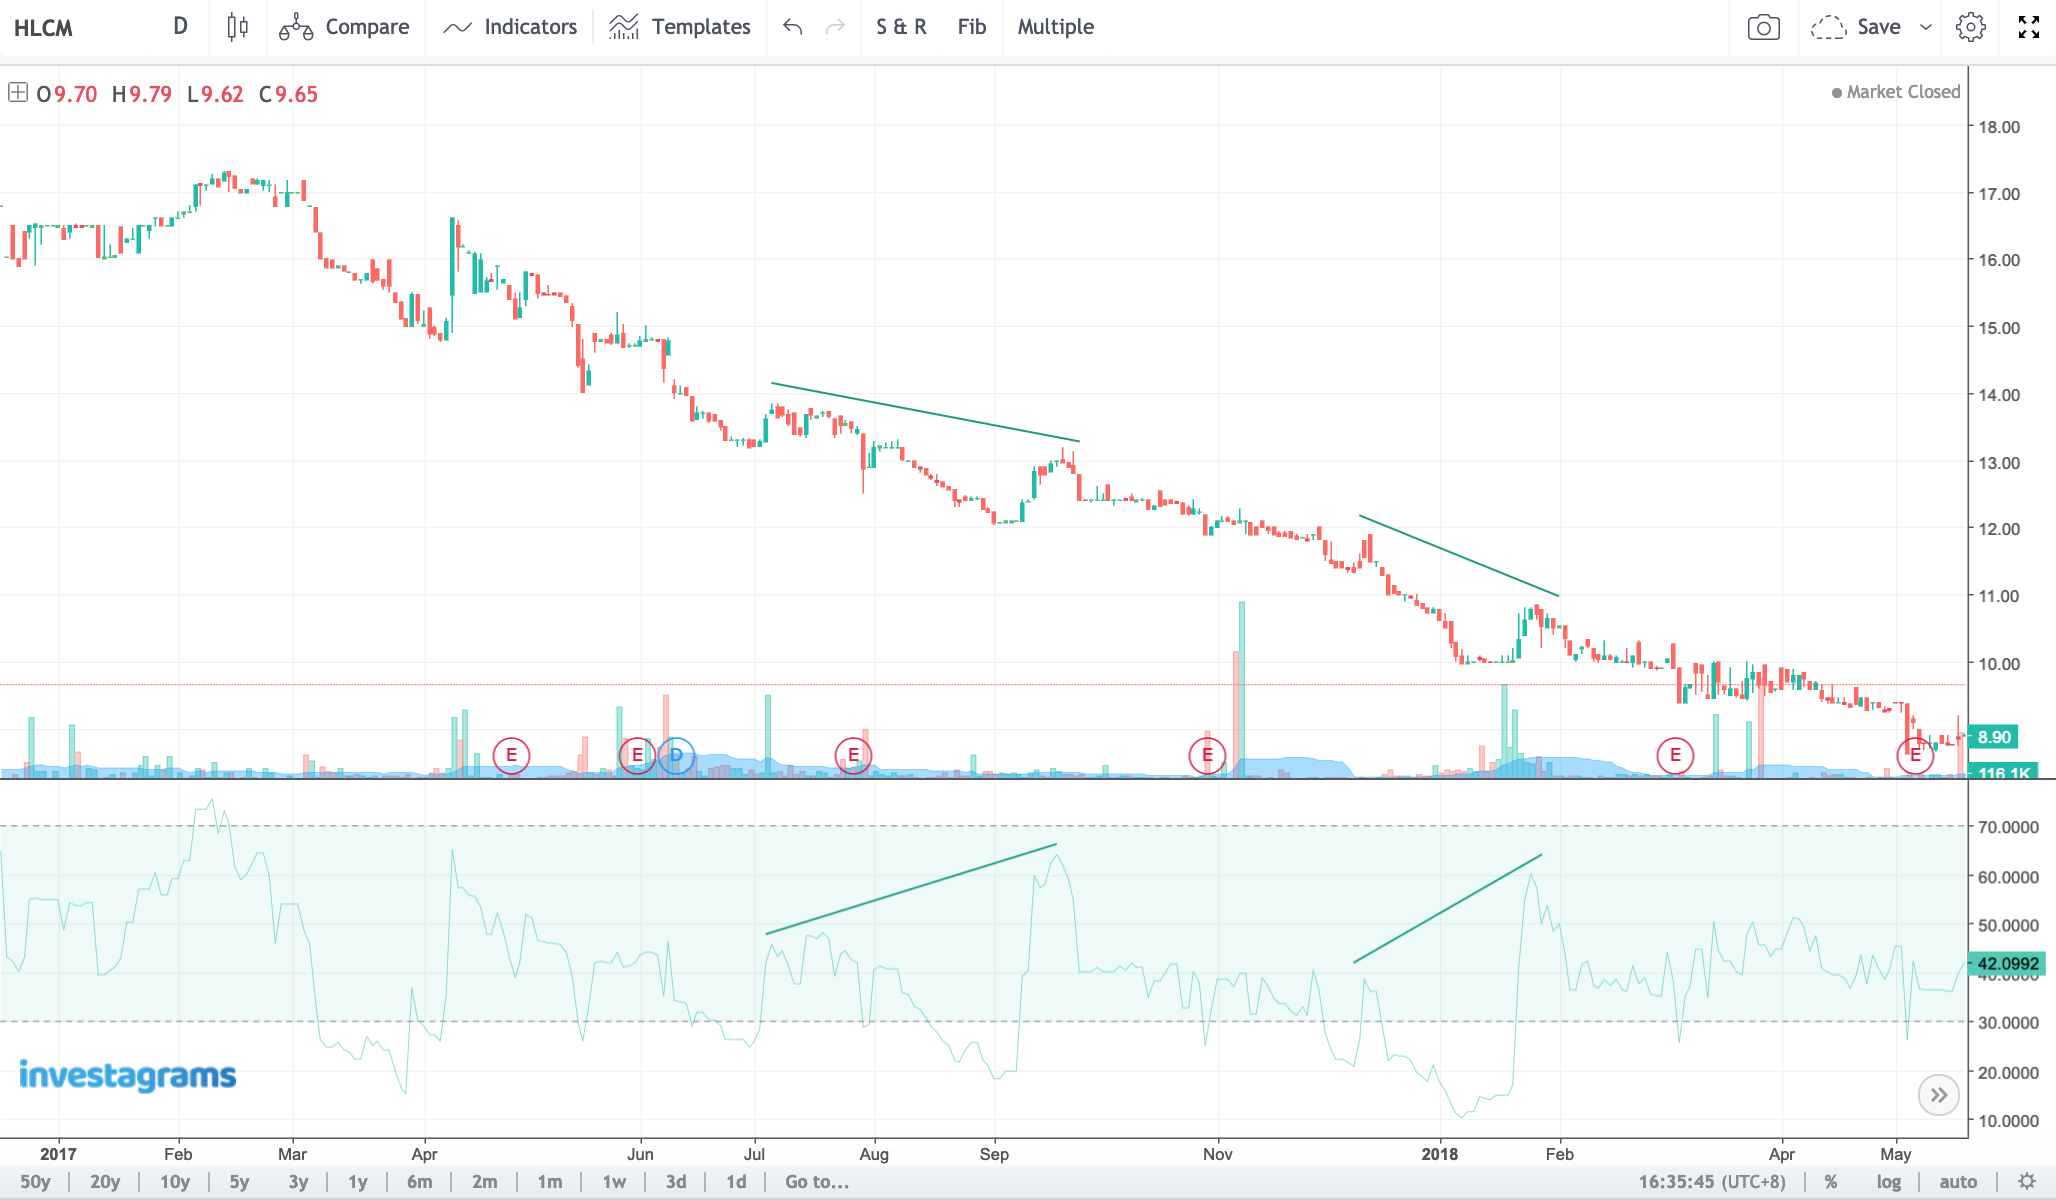
This type of divergence tells us that there is a strong likelihood that an underlying downtrend will continue. Holcim Philippines, Inc. (HLCM) shows us how this works. We can see that price action made lower highs whereas the RSI created a higher high, an indication of a continuation of the downtrend. The concept of “selling the rallies” can be used in this regard.
Potential Buy and Sell Signals
The RSI can be used to generate entry and exit signals if coupled with other indicators such as the MACD or even just price action itself. If you backtest the divergences above and have a proper grasp of candlestick patterns and support and resistance, then you may utilize the RSI in your favor. It will help you craft your trading techniques so that you would be able to develop your own system to trade the market.
If confused, always remember:
• A bullish divergence (price action gives a lower low, momentum indicator shows a higher low) indicates a reversal from a downtrend. Look for the lows here.
• A bearish divergence (price action makes a higher high, but momentum indicator creates a lower high) indicates a reversal from an uptrend. Search for the highs here.
• A hidden bullish divergence signifies a continuation in an uptrend. Observe the lows here.
• A hidden bearish divergence suggests a continuation in a downtrend. Spot for the highs here.
• Classic divergences are a possible reversal of the underlying trend.
• Hidden divergences are a possible continuation of the underlying trend.
In conclusion
At first, it would be difficult to understand the RSI especially the signals it gives off. It is essential to train your eyes as you progress in technical analysis because it will help you handle future market opportunities, so there’s no reason to rush and get impatient. You won’t be able to memorize all these jargons in one read, so take notes, backtest, and be patient.
Trust in the process as trading is a journey! ?