
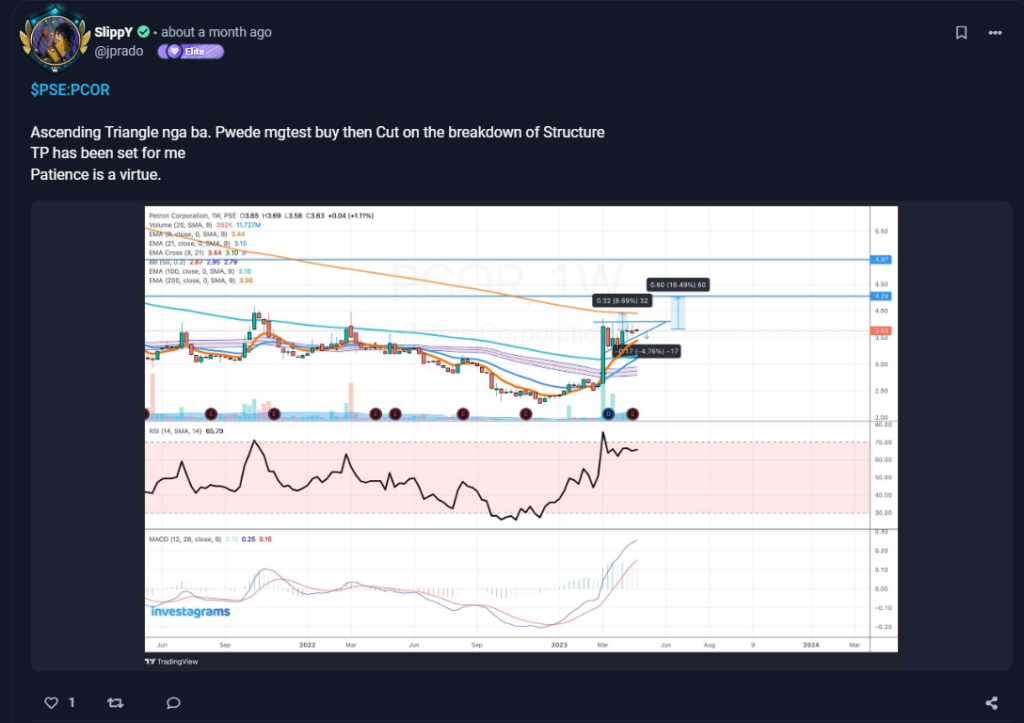
This week’s featured trader is @jprado as he spotted a solid trade in $PCOR! As his technical indicators started pointing upward, he was able to tell that there was an opportunity present.
Trading the ascending triangle became a viable option given that the RSI and MACD were giving bullish signs. From there, it was as simple as taking an entry, setting a TP, and making sure to set a cut loss on the break of the market structure – something @jprado clearly stated.
TECHNICALS OF THE TRADE
There were 4 main indicators present in the analysis from @jprado. He made use of the Bollinger Bands, RSI, Moving Averages, and the MACD.
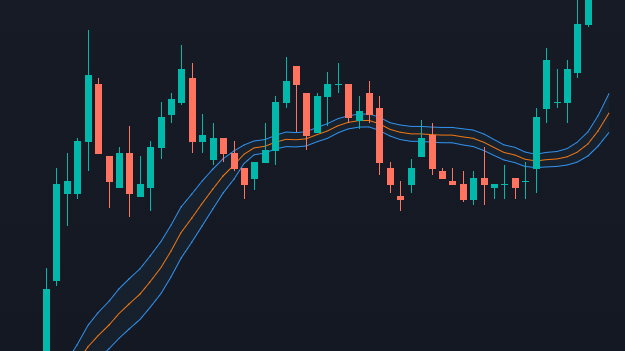
Bollinger bands and moving averages are similar to each other in that they track trends. However, the former has the added function of tracking price volatility. When used together, the Bollinger band can be used as a visual indicator to see if volatility is either contracting or expanding.
It might have not been clear on the weekly chart, but if you check the daily charts, the indicator was able to show that volatility was dying down. A common sign before big moves happen.
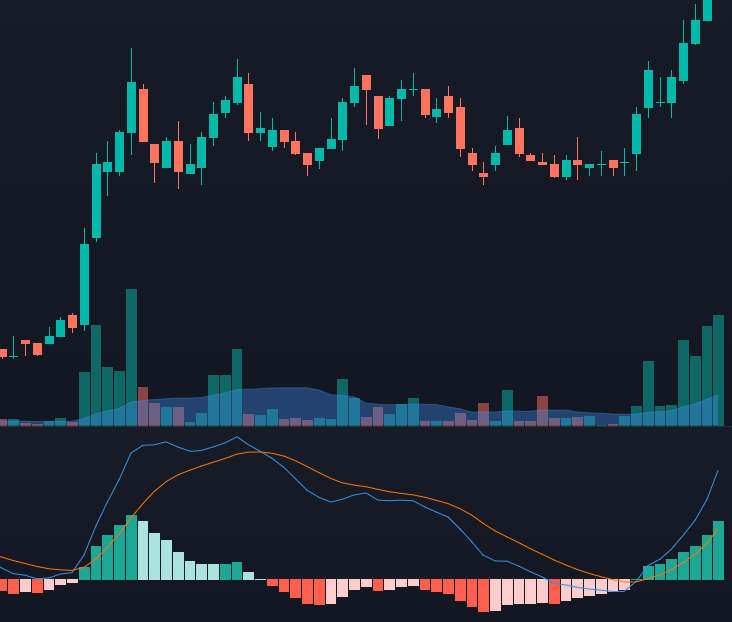
The RSI keeps track of a stock’s underlying strength by taking into account price changes and the speed of the price change. While prices consolidated for a rather long time, momentum wasn’t dying down given that prices firmly held above 3.30. The RSI picked this up and was showing that momentum was still strong, giving constant readings above 60 on the weekly chart.
Lastly, the MACD was also used to tell if the consolidation was nearing its end. Another typical behavior of consolidations is that the MACD tends to slope downwards. Usually, big moves happens when ample time is given for profit takers to get out of the market. The indicator can sometimes be used to keep track of that by checking to see how close it has gotten back to 0.
FUNDAMENTALS OF THE TRADE
Petron Corp. is a company involved in oil refining and marketing, offering customer solutions in the energy sector and related industries. The company’s operations are categorized into various segments, namely Petroleum, Insurance, Leasing, Marketing, and Others.
As the pandemic saw motorists travel less, the company saw some hardships. However, as the economy continues to recover, Petron is poised to bounce back. Revenues have already started to recover strongly, with net income expected to follow suit in the future.
Check this out if you want to learn more about Petron.
WHAT SHOULD BE MY NEXT MOVE
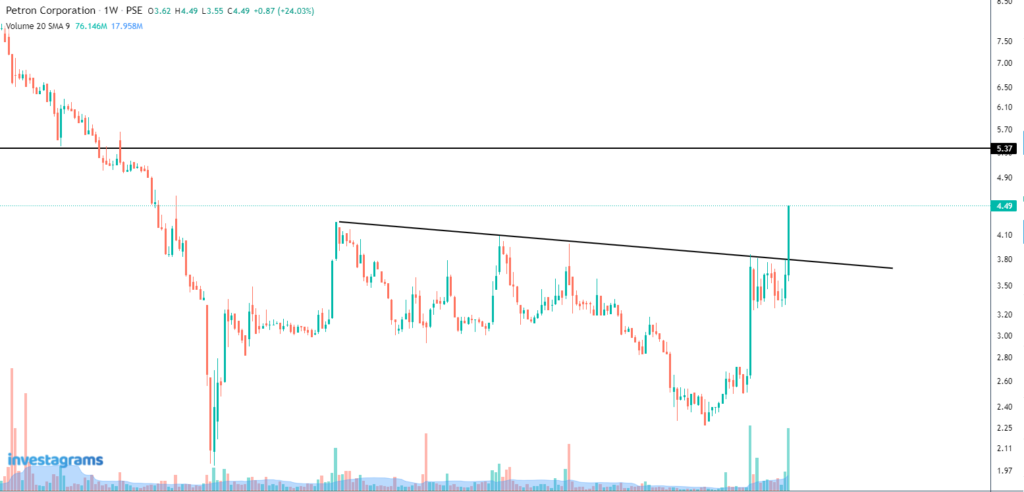
Currently, $PCOR has already rallied well above breakout levels. While there’s still some upside remaining, the risk-reward for traders just looking to get into the stock isn’t great. It would be best to wait for a new consolidation. The best case would be if prices consolidate after testing the 5 peso resistance, since a breakout from there would indicate that prices could head towards a farther target price.
Once again, KUDOS to @jprados for being this week’s featured trader! Enjoy your 14-day InvestaPrime Access and continue to be an inspiration to the trading community.
Easily track your PSE and Crypto portfolio on Investagrams for FREE!
Try it today: https://invs.st/PortfolioDaily