
In a quote by Jaymin Shah, he says “Don’t blindly follow someone, follow the market and try to hear what it is telling you.” To become a successful trader, you should be able to do your research and due diligence. Expand your knowledge by studying the market and learning new strategies. Through this, you will be able to become profitable in the long run.
@candlestocks takes the spotlight for this week’s Investagrams featured trader as he shares his knowledge with us on stocks from the PSEI. Let’s take a look at how @candlestocks uses this to his advantage.
@candlestocks gave his thoughts on $SECB and the potential course it might go after price action reached support levels
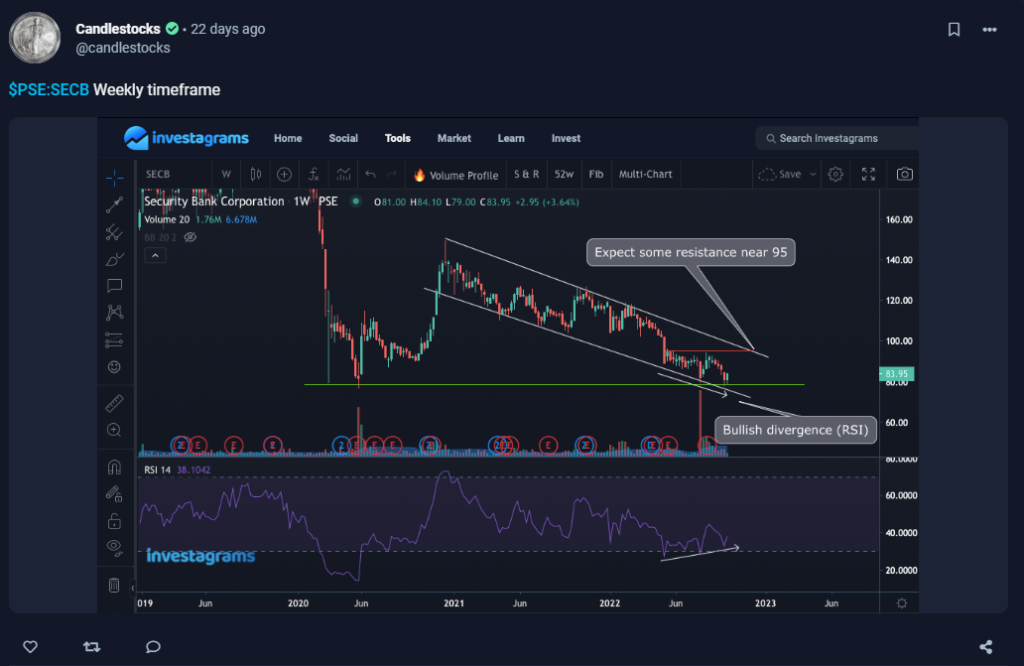
During this specific trading period, @candlestocks has plotted out a simple support and resistance line which will help guide where the price might retest. As shown above, the chart is heading in a bearish direction. We can also see an RSI, a momentum indicator, forming a bullish divergence pattern, which typically means that a stock is gaining momentum. Moreover, it also means that it can be a perfect opportunity to buy. @candlestocks has also informed us to expect resistance around the 95 levels. Typically, you would want to avoid buying around those levels as prices are most likely to drop.
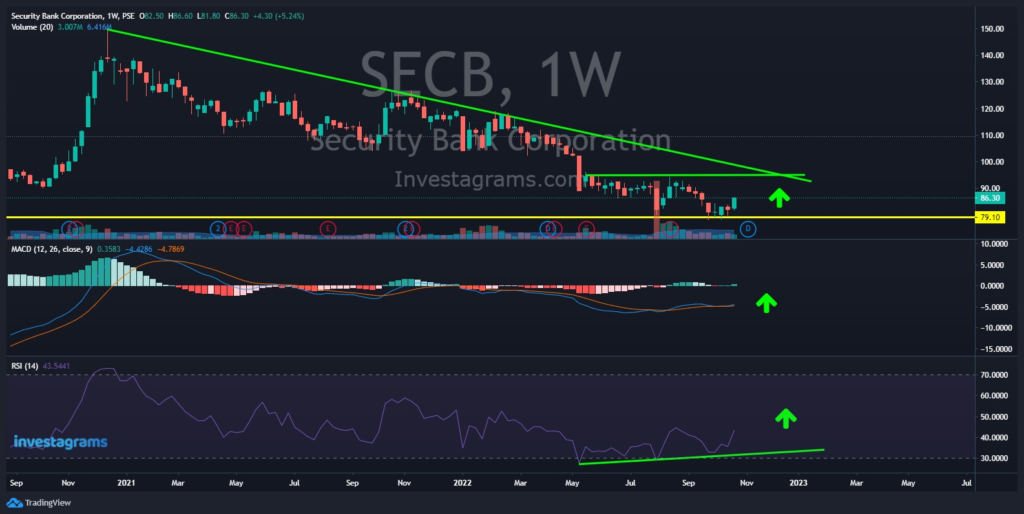
TECHNICALS OF THE TRADE
Technically, $SECB at the time was gaining a downtrend momentum. But despite that, indicators have shown that a price reversal was possible First, we can see that price was at its support levels. As a trader, you would normally want to buy at this level as prices tend to bounce right back up. We can also see that the MACD has slowly shown signs of uptrend reversal. Moreover, as told by @candlestocks, the RSI formed a bullish divergence pattern, meaning that the price was most likely to bounce right back up.
With all the information gathered and collected, @candlestocks was able to successfully make a good trade. He was able to anticipate the support line retesting, allowing him to earn about 9-10% in profits.
FUNDAMENTALS OF THE TRADE
As officially disclosed on the PSE EDGE platform, $SECB has recently announced a declaration of cash dividends. The Amount of Cash Dividends Per Share will amount to Php1.50 per common share. The ex-dividend date is said to be on Nov 7, 2022. The record date will be on Nov 10, 2022. Lastly, the payment date for the cash dividends will be on Nov 24, 2022.
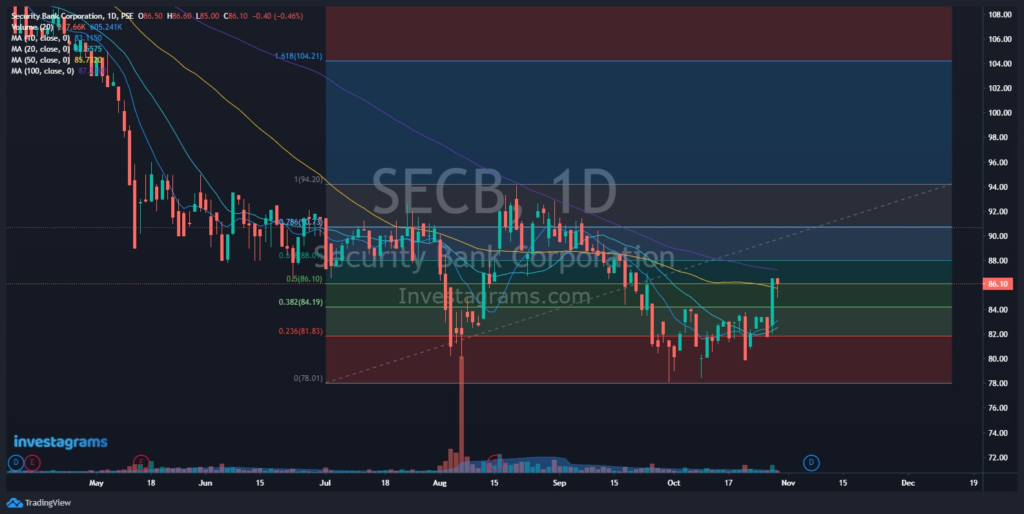
WHAT SHOULD BE MY NEXT MOVE
In the daily timeframe, $SECB seems to have more momentum to push the price even higher. It ended the week with a good close and volume traded. Moreover, it is expected to retest around the MA100 level. Looking at the chart, we can also see that it is right above the Fibonacci resistance of 0.5 (86.10), meaning that price is most likely to bounce right back up. Additionally, the declaration of cash dividends is also a good sign to buy $SECB.
Given this, it is preferable to set aside some cash to buy and hold this stock for the long term and the cash dividends.
Additionally, it would be wise to buy the dips without spending a lot of money considering the status of the market. Always do your research and stay up to date on news that is pertinent to the stock you have selected.
Once again, KUDOS to @candlestocks for being this week’s featured trader! Enjoy your 14-day InvestaPrime Access and continue to be an inspiration to the trading community.