
Have you ever seen a stock gain upwards of 20 percent in one day? If so, you probably ignored it since you may have thought that there is no possible way for the price to go up any further. Or, maybe you rode the hype only to be disappointed by losses after a few days. However, as you check the top gainers three to four days after the first 20% gain, you see the same stock rise up another 10 percent! What causes this phenomenon? And more importantly, how can we capitalize on this market behavior?
The momentary drop of a stock’s price is called a retracement or a pullback. Retracements are caused by traders or investors taking profits from the big move prior to the retracement. This behavior applies to both large trends as well as big moves in the intraday time frame. The momentary drop in stock price gives us traders the chance to enter the stock at support levels at a relatively lower risk. But what happens if the supports are too far away? How can we anticipate the reversal point of the retracement?
The Fibonacci Retracement
The fibonacci retracement tool indicates potential support and resistance levels of a stock. The name comes from the fibonacci sequence also known as the golden ratio. However, in the context of trading, we only need to familiarize ourselves with the tool and not on the sequence itself.
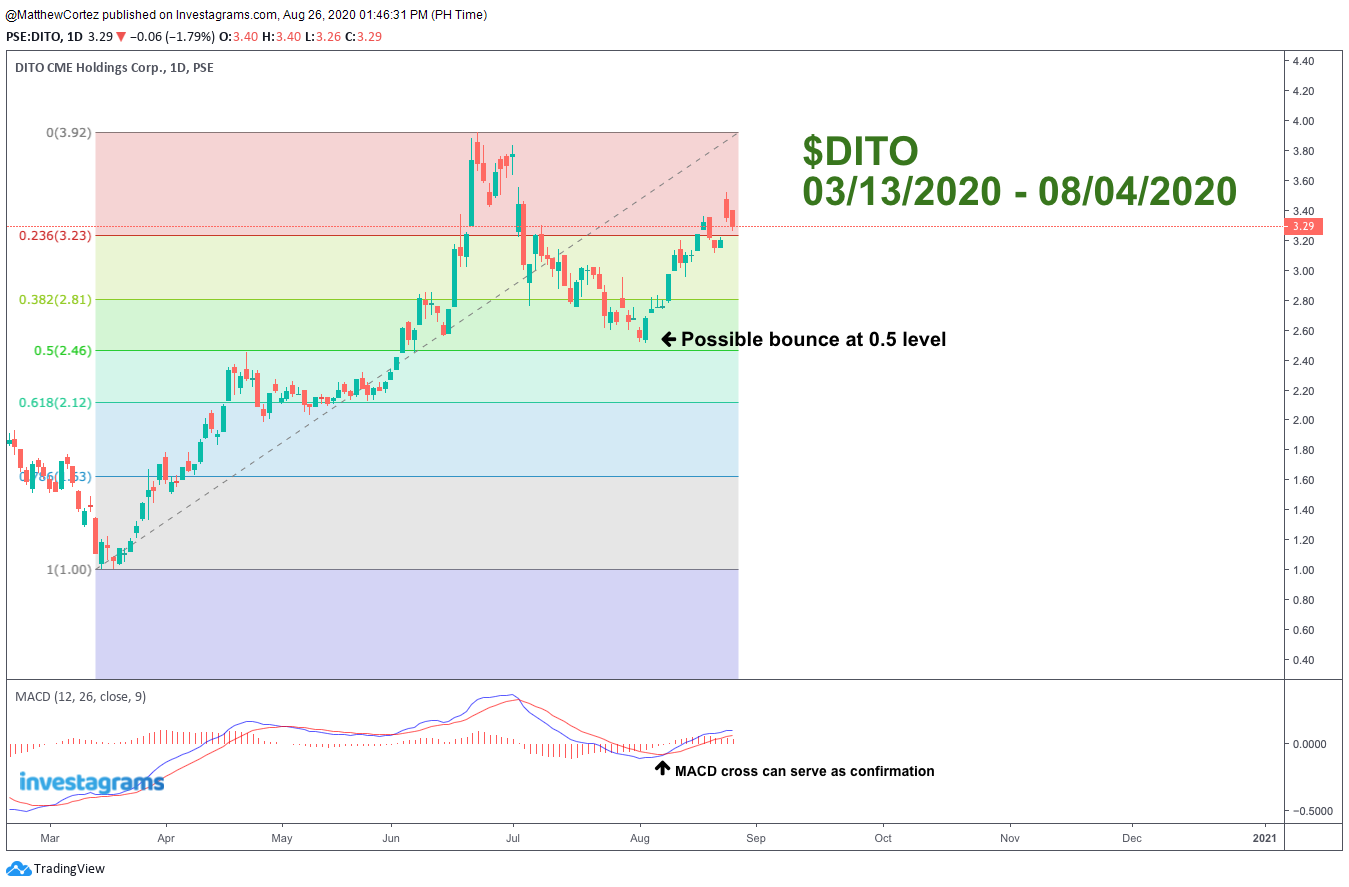
Using the tool is as simple as tracing the bottom of the move all the way to the point before the start of the retracement. After this, fibonacci levels (50%, 23.6%, 38.2%, 61.8%) will appear as colored bars within the range that you traced. Once the levels are visible, you may observe the different levels for confirmations of support. Alternatively, tracing a big downward move from the top to the bottom will show you potential resistance levels. Of course, this tool is best used together with other momentum indicators in order to validate the price reversal. In addition to this, a fibonacci level may show additional strength when it is in line with a significant moving average.
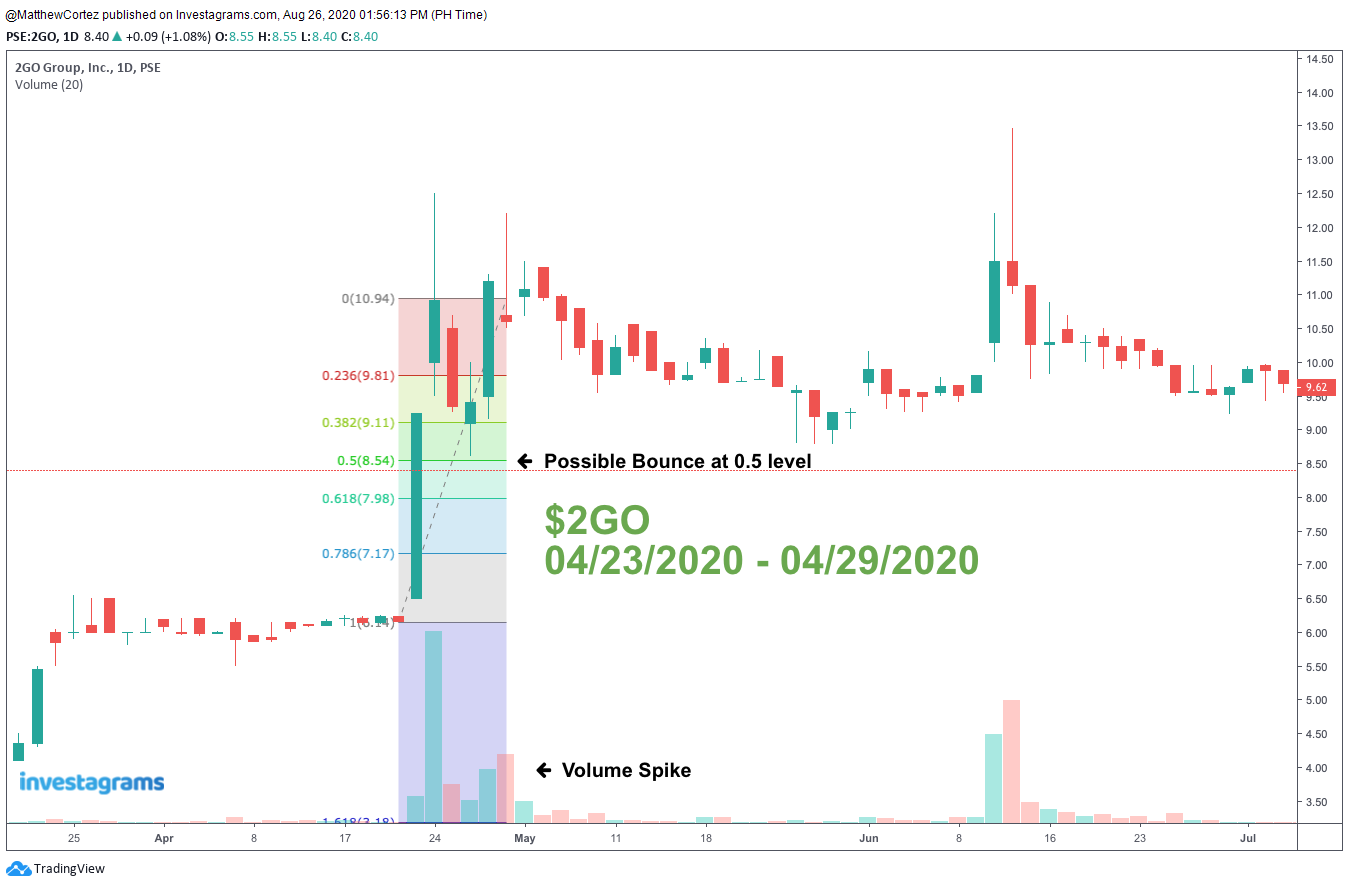
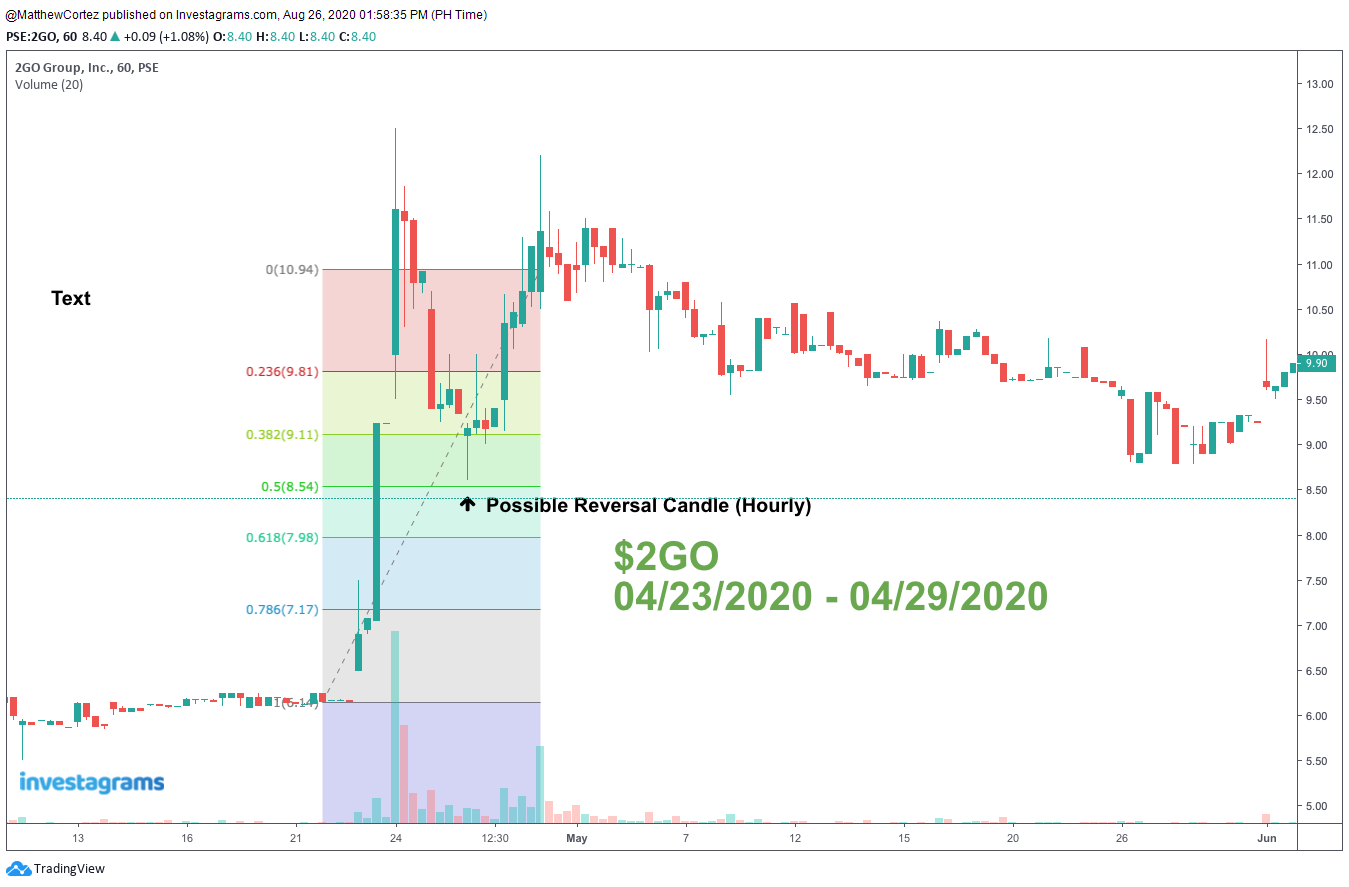
In the context of intraday penny/basura stock plays, it is important to check both the daily and the hourly time frames in order to get the full picture. Typically, it is important to take note of the bodies and wicks of the daily candles to see if they have bounced from a fibonacci support level. On the other hand, looking into the hourly time frame may show you reversal candles that may signal a change in direction.
EXAMPLES
High Volatility Bounce Play [$2GO]
Long Term Retracement [$DITO]
It should be noted that whether or not you include the wicks of candles entirely depends on the behavior of each individual stock. In addition to this, the fibonacci retracement tool is best used with other indicators and will be most effective when in line with areas of high confluences. Regular trading rules (stop loss, position sizing, and take profit levels) still apply. Hopefully, this article has equipped you with the skills and the mindset necessary to catching the bounce rather than chasing the stock. Happy Trading!
It is time to take your trading to the next level.
JOIN THE INVESTACUP 2020 and have the chance to win over PHP 300,000 in prizes!