Investagrams has a full suite of indicators for traders using technical analysis. Among them, the Average Directional Index (ADX) is a commonly used indicator. Trading with a strong trend lowers risk and boosts possible profits. Since the ADX can serve as the best trend indicator in many situations, it can be very useful for traders. Let’s deep dive into the details and use cases.
WHAT IS THE ADX?
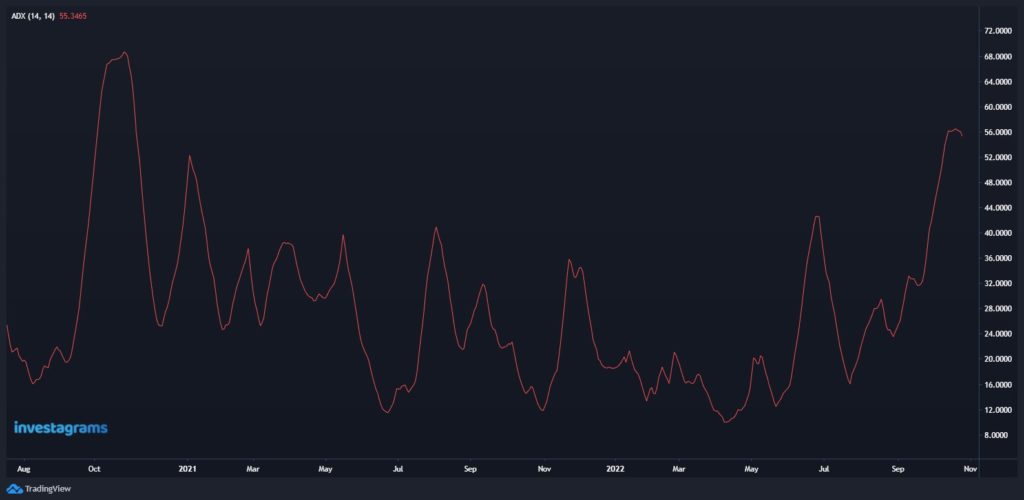
The ADX is an indicator that tries to quantify the strength of a trend. This is done by quantifying how much price ranges are expanding to one side. The indicator turns this into a number that we see on a scale from 0 to 100. It’s important to note that the ADX is non-directional. Meaning, it will only tell you how strong a trend is but won’t tell you in which direction.
READING THE ADX
The ADX can help you distinguish if the trend is fit or not for trend-trading strategies. For example, any reading below 20 would tell you there is no trend. It wouldn’t make sense then to use trend-follow strategies. A reading between 20 – 25 could tell you that there is a budding trend. While any reading 25 and above would indicate the presence of a clear trend. In these situations, you should be looking for continuation chart patterns.
When determining trend strength, the ADX line’s direction is also crucial. A rising ADX would translate to a trend gaining more momentum. Whereas, a falling reading means that the trend is weakening. A common misconception here is that a falling ADX translates to a reversal of the trend. However, in reality, it only really means that prices are pulling back. Hence, the trend losing some momentum. The rule of thumb here is that as long as ADX is above 25, you can still consider the current trend to be strong.
USING THE ADX INDICATOR
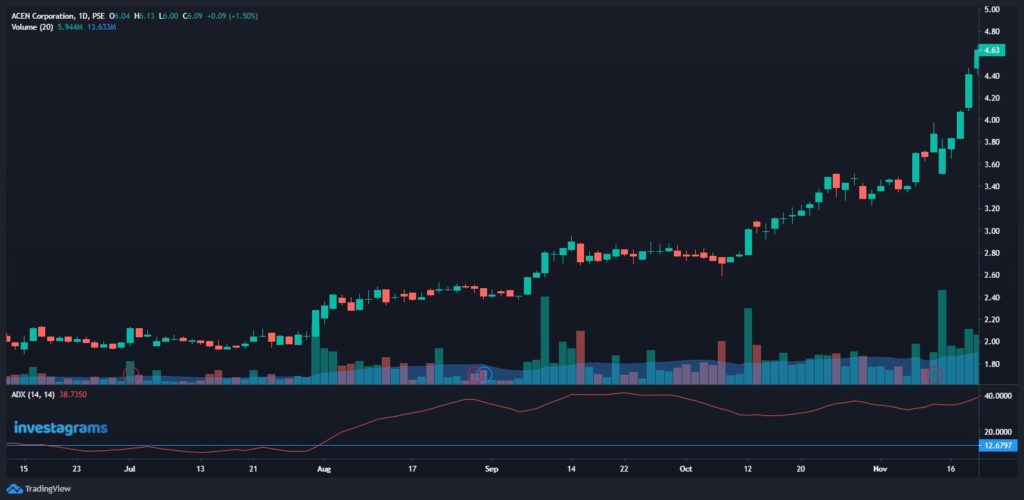
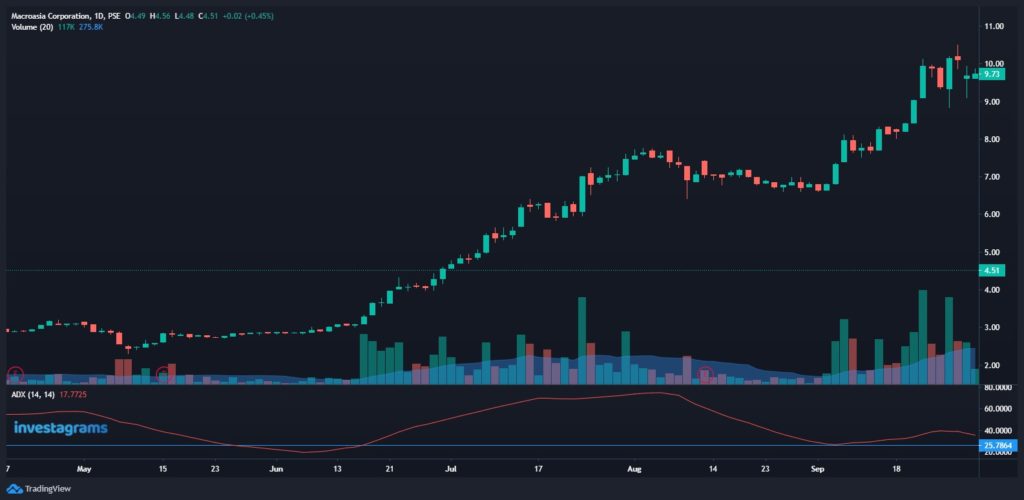
While using the ADX would mostly be for identifying the existence and strength of trends, this can still be a very powerful tool within trading systems. For example, breakouts are easy to identify, but often times these breakouts can fail to advance. However, you can use the ADX to help you find legitimate breakouts. If it gives you the signal that a trend is present, then the probability of a continuation is strong.
Likewise, you can also use the indicator to identify if prices are just ranging. Breakout traders tend to have trouble in ranging environments. Although easy to avoid in theory, in practice ranging environments often cause traders to experience a “death by a thousand cuts.” When the trend has slowed and is entering ranging conditions, the ADX will give a signal. A reading below 20 will clearly indicate that prices are now just ranging. As such, it would be wise to switch to different strategies more suited for range trading.
LAST REMARKS
Generally, the ADX can be treated as a “supporting” indicator. The readings won’t give you buy and sell signals. However, it amplifies the signals you would get from other techniques. A significant advantage for traders is the capacity to find and measure trends. Being able to do so lets you identify which strategies will work best. It will also help you figure out when to be aggressive, and when to stay on the sidelines. Remember, trading is all about risk management and optimizing your risk to reward.
Want to learn more techniques and strategies to help you build a crisis-proof system? Check out the Investa Summit 2022: Opportunities in Crisis! Our world-class and industry-leading speakers will be giving you in-depth experiences and lessons on the bear market we’re facing, and how we can find opportunities moving forward.