The golden cross is a widely known technical analysis pattern. It’s usually used as a signal that bulls are now in control of the long-term trend. The pattern is formed when the 50-day moving average crosses above the 200-day moving average. As the short-term average rises above the long-term average, the signal signifies that demand has come back into the market.
Some use this pattern as a buy signal. Others use it as a confirmation of their overall market bias. This begs the question, how well does the golden cross signal?
WHY IS BACKTESTING IMPORTANT?
Traders often backtest their strategies to evaluate the performance of the signals used. By simulating the strategy on historical data, you can get an idea of how the strategy would have performed. You’ll also find insights into the strategy’s weaknesses as well as its strengths.
Keep in mind that for backtests to provide insightful results, they should be run through different market conditions and should have a substantial amount of trades. It should also be noted that backtests are not indicative of future results. Market dynamics are always changing, which is why there are too many factors to consider to run a perfect backtest, even with the help of automation.
Nonetheless, backtests will still be able to provide insights to help guide your system in the right direction.
GOLDEN CROSS BACKTEST APPROACH
For this backtest, we covered the U.S. and PH stock markets. We chose various liquid stocks at random, with historical data starting from December 1, 2018.
The parameters for each trade are as follows:
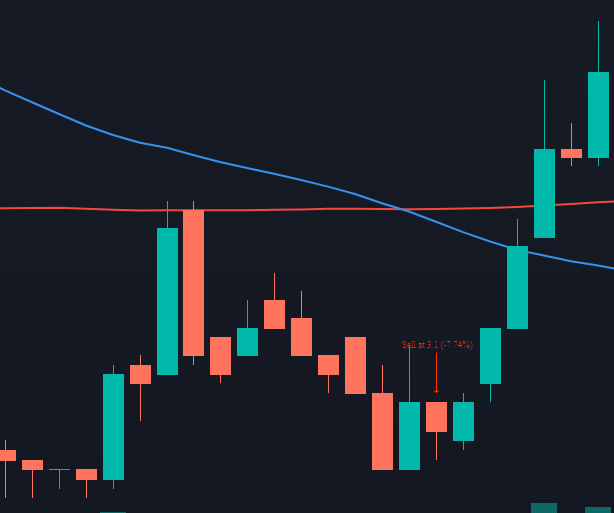
- Buy: At the close when the MA50 crosses above the MA200
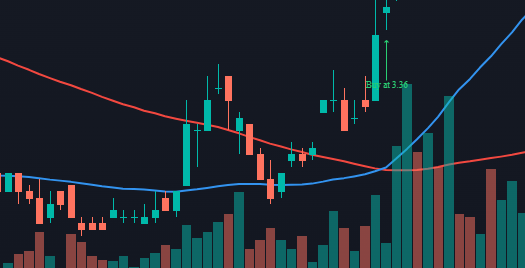
- Sell: At the close when the MA50 crosses below the MA200
For simplicity’s sake, we only recorded the edge and hit ratio.
RESULTS USING THE GOLDEN CROSS SIGNAL
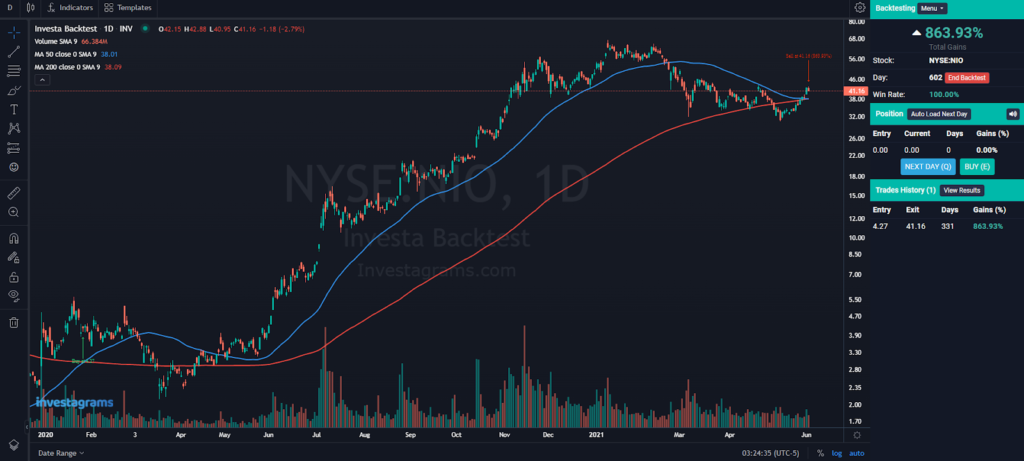
Across roughly 40 trades, the signal achieved a hit rate of 47.22% and an edge ratio of 11.23. It was noticeable that a big factor in the unrealistic performance of the backtest came from just 3 trades. These three came from $TSLA, $AAPL, and $NIO.
When taken out, however, the backtest would’ve still achieved a hit rate of 38.89% and an edge ratio of 3.78 – still very solid numbers.
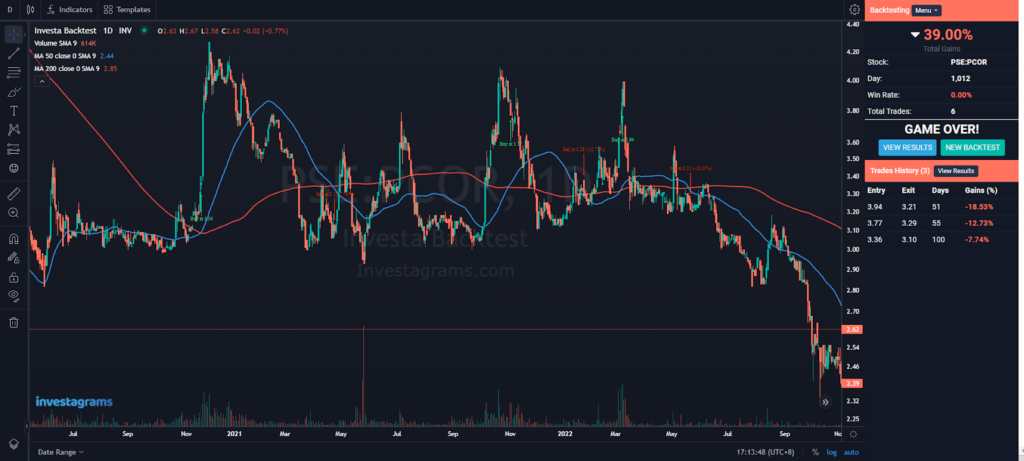
Another finding was that most losses didn’t stem from bear markets and downtrends. The signal usually lost money when stocks were in a sideways trend.
INSIGHTS
Here are some key insights that can be taken from the test done:
- Holding on to strong market leaders can produce astounding results
Most of the best trades in the test conducted came from holding on to leaders in the strongest sectors. These trades usually lasted more than a year.
- A sideways market does more damage compared to a market that trends in whichever direction
Across the different trades conducted, it was noticeable that losses appeared more often in a sideways trend.
- Stock selection is a very important aspect of trading
Being able to distinguish which stocks and sectors are set up for the most success can have a profound impact on a trading system’s performance. While the U.S. stock market as a whole was strong during the testing period, trades in key sectors produced results that greatly outperformed those in other sectors.
LAST THOUGHTS
While the backtest produced stellar results, remember that there are still a lot of factors to take into account. There are still questions to be answered. How should the stock selection criteria be built? Given the volatility to be expected, what should be the ideal position sizing strategy to use? Is it alright for me to have long holding periods?
Forward testing or actual trading performance usually has worse results compared to backtests due to a wide variety of factorsEvenen the backtest conducted leaves a lot to be desired in terms of the number of trades tested and the stock selection criteria used. Certain tweaks could make it more realistic and could provide more insights.
Stay tuned as we’ll aim to provide more valuable content moving forward.
Test the viability of your trading ideas and strategies through historical data to generate results and analyze risk with InvestaBacktest.
Manually practice, master, and backtest your strategy in the local and global markets.