Last January 20 marked the culminating event of Investagrams’ first major competition—the Investagrams Trading Cup 2017—and the turnout was absolutely incredible! Our hearts are truly overflowing and we are sincerely thankful for all the support from newbies, experienced traders, and even masters of the market.
We created the Investagrams Trading Cup to provide a fun avenue where everyone could showcase and improve their trading skills, but the turnout was more than anything we could have imagined. The competition was intense and we were amazed by the caliber of traders that came out on top.
Out of the almost 2000 traders who joined the competition, those who led the pack were truly inspiring and extremely generous in sharing their wisdom and experiences. Here are just 10 lessons out of the hundreds we learned from the Trading Cup 2017’s top 10 players.
#10
@joelduque: Work smarter, not harder.
Joel duque is the living proof that you don’t have to trade actively to earn significant profits. Through proper filtering, he was able to handpick stocks that had great potential and allowed him to bag the top 10 spot.
#9
@tris0314: Always be learning—from others and from yourself.
Tristran Montano shared his most significant trades throughout the competition, and highlighted the importance of learning continuously if you want to achieve success. He learns from various online blogs, websites, and his own history of trades.
#8
@MoneyGrowersPH: It’s never too late.
Despite lagging in the competition early on, he kept his composure and his winning attitude. In the end MoneyGrowersPH was able to rise up and prove that he indeed is one of the top traders.
#7
@Smalltime: There’s always a way to make it work.
Richard Baco is an OFW based in the Middle East. Despite holding down a full-time job, being in a different country, and even being in a different time zone, he still found a way to get the top 7 spot. He even gave a recorded video presentation since he couldn’t fly home for the culminating event.
#6
@Junster: Quality is more important than quantity.
You don’t have to have tons of trades to be profitable. In life and in trading, quality is almost always more important than quantity. When executing your trades, Joseph gave us these words of wisdom: Losing is inevitable. It’s part of the game. Just remember that you can win small, win big, lose small, but never lose big.
#5
@chad3ie: Focus on what’s really important.
Chad is one of the best traders of Citisecurities and a teacher in the Caylum Trading Institute. Aside from sharing some of his best tips, for life and trading, he reminded us of what’s really important—at the end of the day, what (or who) is it that we are trading for?
#4
@Scraffycoco: You can achieve your dreams at any age.
Rafael won 6th place in the Investagrams Stock Market Challenge last 2016 and has always dreamt of sharing his passion with a larger audience. Despite his young age, he proved that age is not a measure of mastery, and that with hard work and passion you can compete even at the highest level.
#3
@zeefreaks: It’s a jungle out there, but you can conquer it.
The mysterious head of the Zeefreaks Tribe and definitely a deserving leader in terms of skills and passion. During the competition, he proved to everyone that he is indeed one of the best traders in the Philippines. He shared his insights on how he studies and understands his prey before striking at the precise moment to capture the most profits.
#1
@bobbyaxelrod: There are always opportunities. You just have to know how to find them.
Edu bagged the most profits in the competition through his skills in finding momentum based trading opportunities. He shared simple but incredibly powerful tips for how he makes the most of the opportunities in the market.
#1
@Taylor: Above everything else, commitment is key.
One of the few masters of Elliot Wave here in the country, Javi used the Elliot Wave together with set-up based trading to consistently find great opportunities in the market. Through years of sharpening his trading style and skills, he was able to become a master trader and the champion of the Investagrams Trading Cup 2017.
These guys presented their strategies and trading tips in our Breaking Highs event last Jan 20, and even those of us who are experienced traders still learned a lot from them.
For those who weren’t able to attend, don’t worry! You can still watch the FULL VIDEO of all presentations and discussions. Click here to get access.
Support and resistance may be one of the most basic concepts in stock trading and technical analysis, but it is also one of the most useful. If you know how to use them well, you can already start building a profitable trading strategy. So here are 3 simple but powerful ways to use support and resistance in making profitable trades.
1. Find the best time to buy or sell your stocks.
This is a very basic use of support and resistance, but it is still one of the most effective.
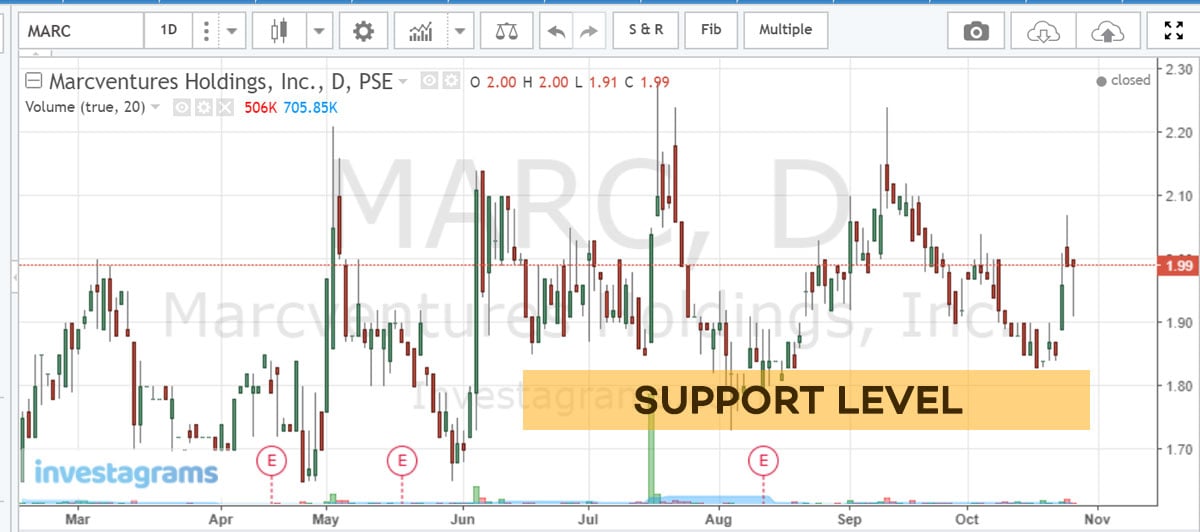
The support and resistance levels often serve as an indicator of a coming shift or reversal of the current price movement. These levels serve as a guide for when we should start buying or selling a certain stock.
We buy stocks as the price nears the support level. Once it reaches the support, demand becomes stronger than supply and more people will want to buy that stock, making the price go up.
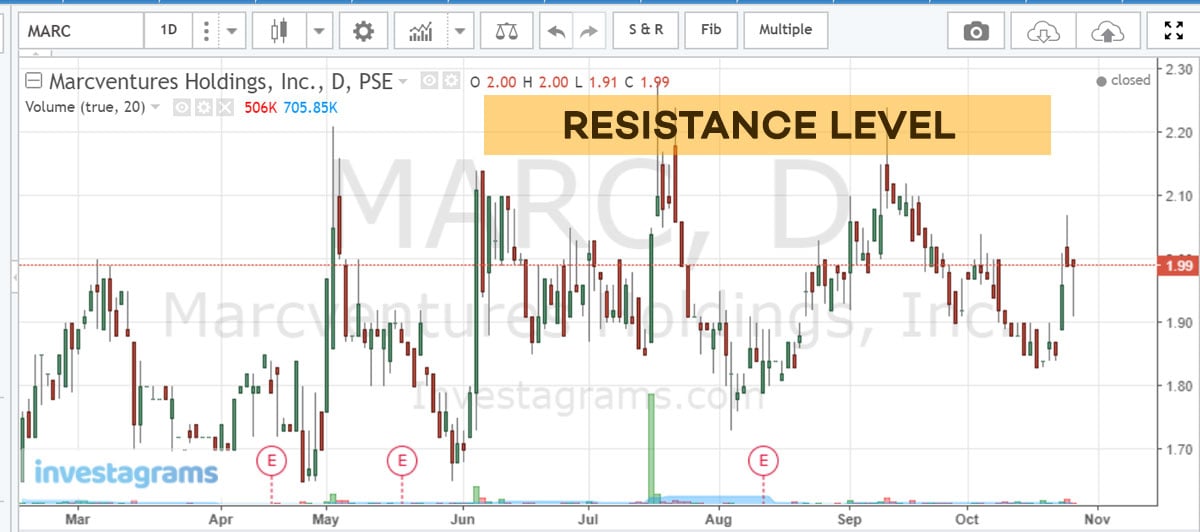
On the other hand, we sell stocks as the price gets closer to the resistance levels because this is when you can sell for the highest price. When the stock reaches the resistance level, more people will want to sell and the stock price will start going down again.
2. Identify stronger support and resistance by the length of time.
There are many support and resistance levels that can be found in a chart based on how long or short the time frame is. The longer the time frame, the stronger the support and resistance and the harder they are to break. In other words, a 10-year support or resistance is much stronger than a 1-month support or resistance.
Although the interpretation of a chart is subjective and different for everyone, seeing the bigger picture gives traders an idea of where the stock can go and how easy or difficult it will be for the stock to get there.
Next time you’re looking at support and resistance, try looking at the support and resistance across different time frames to see what the big picture really looks like.
3. Spot potential breakouts, which can lead to huge profits.
The resistance level, once broken, becomes the new support level. If sustained, it gives traders an idea that there is very strong demand for the stock. Breakouts like this usually signal the start of a major price trend, which can lead to huge profits.
This increased volatility during breakouts attract traders because it can offer great returns with a minimal amount of risk, especially if there is no existing resistance in place (i.e. when a stock breaks out to a new all time high).
Keep an eye out for breakouts and wait to see if they are sustained. If they are, it’s likely that you’ll be able to make a profit off of buying that stock.
Don’t forget, you can also combine these concepts to make your trading decisions.
For example, if you see that a stock has broken above its 10-year resistance, then you know from #2 and #3 above that it has the potential for huge profits and you should definitely consider buying that stock. If you want to buy a stock but it’s near its resistance level, then maybe wait a few days to get a better price.
Simple moves like this, applied consistently and with proper risk management will help you become a more profitable trader.
Do you have other tips and tricks for using support and resistance? Let us know in the comments below!
If you hang out with a lot of traders, then you’ve probably heard about Elliott Waves at least once or twice. And if you’re a beginner in the stock market, then you’ve probably been confused by them at least once or twice too!
In this article, we’ll explain the basics of the Elliott Wave theory, give you a simple overview of how it works, and break down its pros and cons so you can decide if it has a place in your trading strategy.
Background
Price movements in the stock market can seem quite random, especially if you’re a beginner. But a quick intro on technical analysis will show you that the market actually moves in repeating patterns. The Elliott Wave theory is just one method under technical analysis that maps out how these patterns unfold.
Back in the 1930’s, an accountant named Ralph Nelson Elliott noticed that there was a specific pattern of waves that appeared again and again in the stock market. This pattern of waves are what we now call Elliott Waves.
How It Works
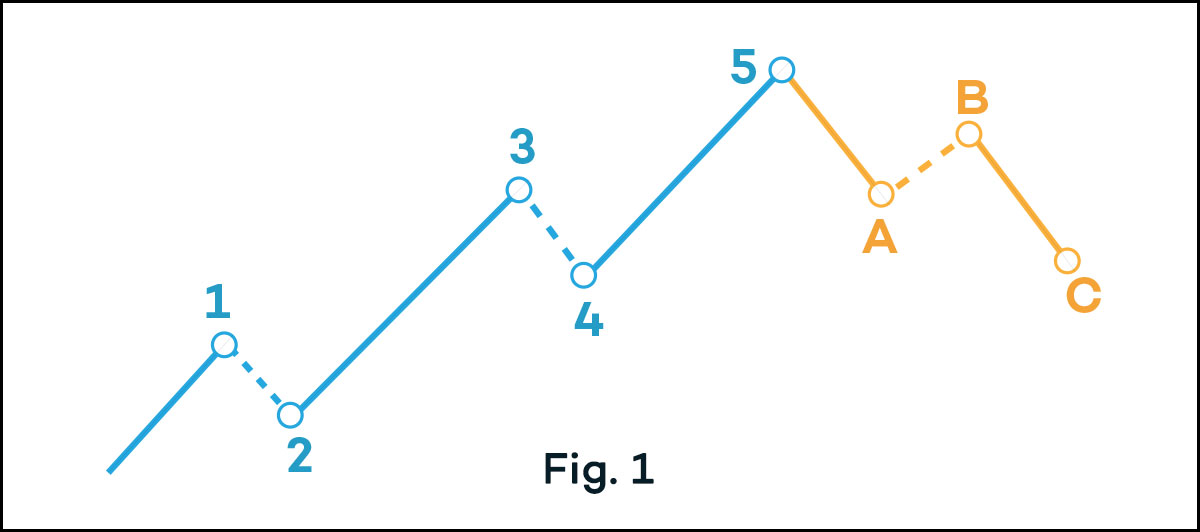
The basic Elliott Wave pattern includes two phases—an impulse phase and a corrective phase. The impulse phase has 5 waves and goes with the dominant trend while the corrective phase has 3 waves and goes against the dominant trend.
Here’s a simple illustration to show you what these waves look like when the overall trend is bullish (Fig. 1) and when the trend is bearish (Fig. 2).
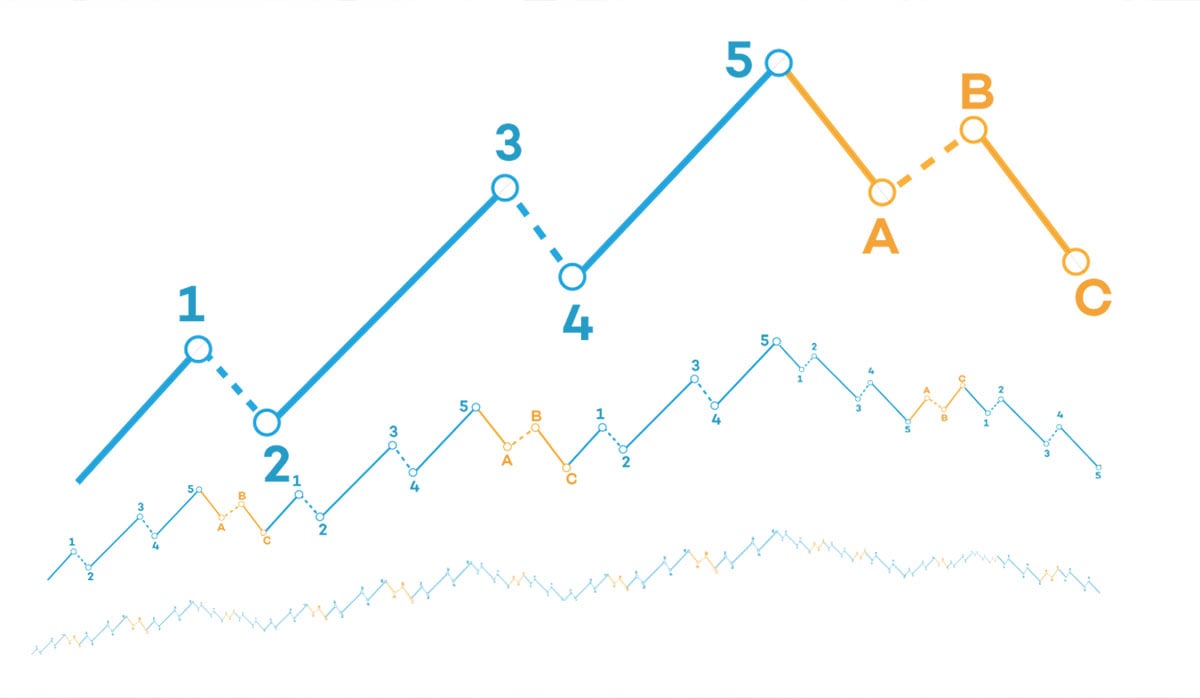
Eventually, the shorter cycles of Elliott Waves can also combine to form bigger Elliott Waves spanning longer periods of time. Every completed cycle, no matter what degree, will still develop the same 5-3 wave pattern.
Elliott Waves can form over many different time frames. A cycle can be completed in just a few minutes or over centuries! Although there’s no exact rule on which degrees correspond to which time frame, there are 9 generally accepted levels and labels:
Grand supercycle: Forms over hundreds of years
Supercycle: Forms over many decades
Cycle: Forms over a few years (minimum of 1 year), but possibly also a decade or two
Primary: Forms over a few months to a couple of years
Intermediate: Forms in a few weeks to a few months
Minor: Forms in a week to a few weeks
Minute: Forms over a few days
Minuette: Forms in a few hours
Subminuette: Forms in just minutes
The Elliott Wave theory can easily become complicated, but at the end of the day it’s just a form of pattern recognition. Knowing the pattern allows you to predict price movements and make better trading decisions.
To use the Elliott Wave, you must first identify two things:
If the dominant trend is bullish or bearish
Which wave you’re currently on
To spot Elliott Waves correctly, make sure to follow the 3 basic and unbreakable rules:
Wave 2 should never go beyond the start of wave 1.
Wave 3 cannot be the shortest among waves 1, 3 and 5.
Wave 4 never overlaps with wave 1.
Conclusion
Recognizing the Elliott Wave pattern can involve a lot of subjectivity, so results will vary from trader to trader. In some ways, you might even say that executing it is more of an art than a science.
We can’t tell you if this method will work for you or not, but what we can say is that there are people who have used it and profited from it.
What about you? Are you going to try the Elliott Wave or is there another method that you swear by? Let us know in the comments below!
Technical analysis is a term that we hear a lot in the stock market. But what does it actually mean and how can it help you with stock trading? Today, we’ll cover the basics and tell you everything you need to know.
What is Technical Analysis?
Technical analysis (TA) is the use of past market data to analyze stocks and make better trading decisions. It’s based on the idea that supply and demand will determine a stock’s price more accurately than the company’s intrinsic or “true” value.
Technical analysts look at the price movement over time, trading volume, and other historical market data. Then, they find trends and patterns which can be used to predict future price movements.
It can seem complicated at first, but many traders actually find it easier than its counterpart, fundamental analysis. It’s less subjective, involves less research, and can be used even if you don’t know a lot about the industry or company.
**To read more about fundamental analysis vs. technical analysis, click here.
The 3 Assumptions of Technical Analysis
Technical analysis is very popular, especially for traders who like short-term investing. But it’s important for you to understand it well before risking your hard-earned money. Before you go all-in, here are the 3 main assumptions in TA that you should know:
1. The market discounts everything.
This is one of the strongest assumptions in TA. Here, we assume that all publicly available information is already “priced-in” or reflected in the stock price.
Our assumption is that when market players get information, they react to it by either buying or selling shares. Because of this, supply and demand will immediately adjust along with the stock’s price.
Any news, disclosures, or announcements won’t matter anymore because the market is always a step ahead. You can never have any “new” information that the market didn’t already account for,
2. Prices move in trends.
Technical analysts believe that price movements are not random. They will always move in some general direction, whether upward, downward, or sideways.
For example, if a certain stock’s price is increasing, then it is more likely that the price will continue to increase. If the price is going down, then it is more likely that the price will continue to go down.
The trend can be short-, medium-, or long-term, but prices always tend to move in one direction and are more likely to continue that trend rather than move randomly.
3. History repeats itself.
People behave in a predictable way. Because of this, similar events and information are usually met with similar reactions. Bad earnings will make people want to sell, expansion plans will make people want to buy, and so on.
This allows us to use past market data and chart patterns to predict future price movements and market behavior.
Basic Concepts in Technical Analysis
Now that you know a bit more about technical analysis and the assumptions behind it, let’s cover some of the basic concepts in TA. Each of these concepts can be a full article on its own, but for now we’ll just run through the most important facts to get you started.
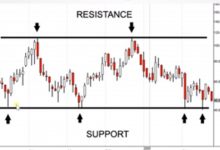
1. Support and Resistance
Support and resistance are two of the most basic concepts in technical analysis. You can already use them to make trading decisions, but they also form the foundation of more complex strategies and trading systems.
Support is the price that, historically, a stock has had difficulty falling below. This is the point where the market considers the price to be “cheap”. Demand becomes so strong that it stops the price from going any lower. In other words, marami nang gustong bumili kaya ‘di na masyado bumababa yung presyo.
Resistance is simply the opposite of support. This is the point where the stock price usually starts going down because there is too much supply and not enough demand. Masyadong marami nang gusto magbenta kaya bumababa yung presyo.
Support and resistance levels are not always precise and they can be broken, but it’s a simple and proven concept that many find useful. The basic rule when trading using support and resistance is to buy on support and sell on resistance.
2. Trend Analysis
There are always going to be ups and downs in the stock market and in every stock, but these ups and downs will eventually form a trend that moves in some general direction—this is actually one of the key assumptions of TA that we discussed above.
There are 3 basic types of trends:
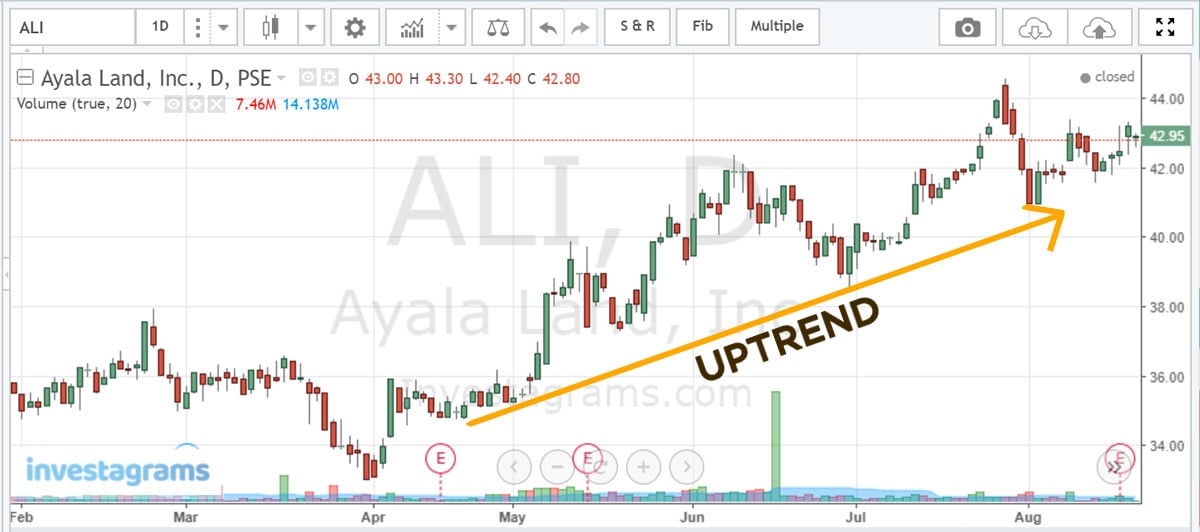
Uptrend
Identified by a series of higher highs and higher lows. The general movement over time is going upward.
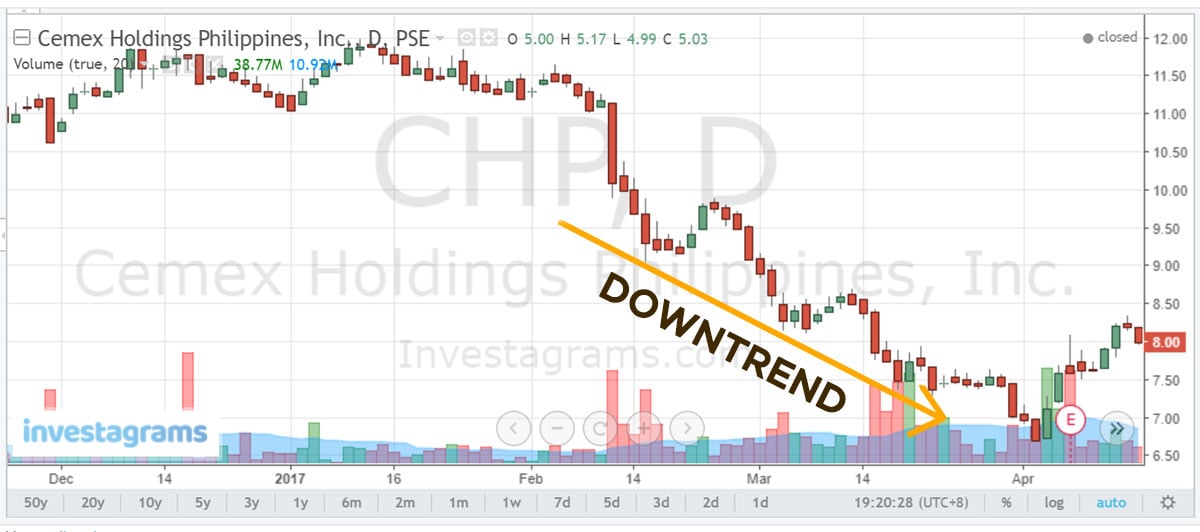
Downtrend
Identified by a series of lower highs and lower lows. The general movement over time is going downward.
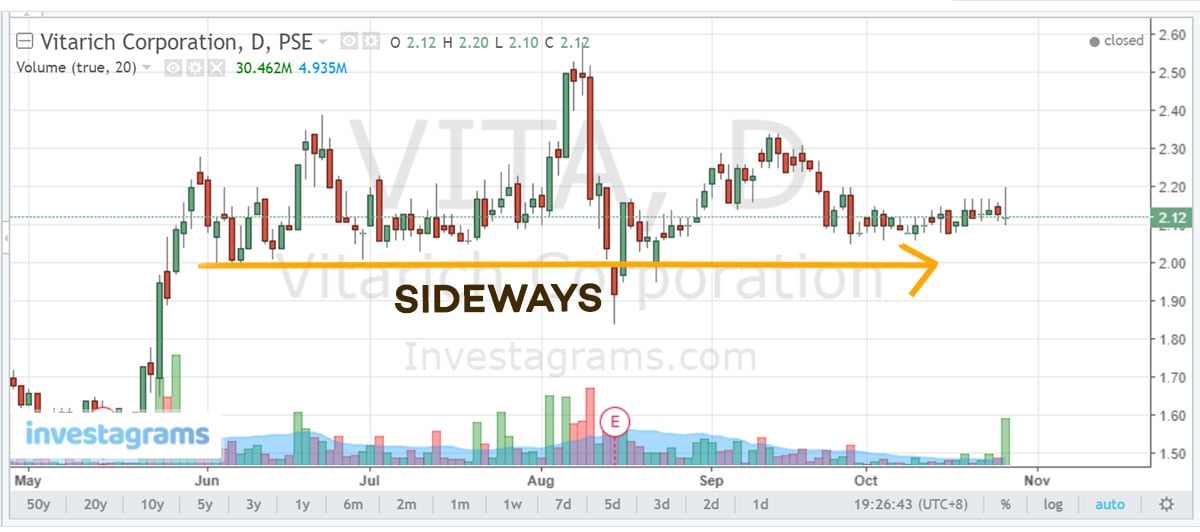
Sideways
There is no clear pattern going upward or downward. The general movement over time is horizontal or flat.
Similar to support and resistance, trends are not guaranteed to continue to hold. That’s why they can be further classified into short-, medium-, and long-term trends. Trends can and do change. But unless something happens to change the market behavior, then the trend is likely to continue.
The general rule of thumb? Buy stocks on an uptrend. Avoid stocks on a downtrend.
3. Volume
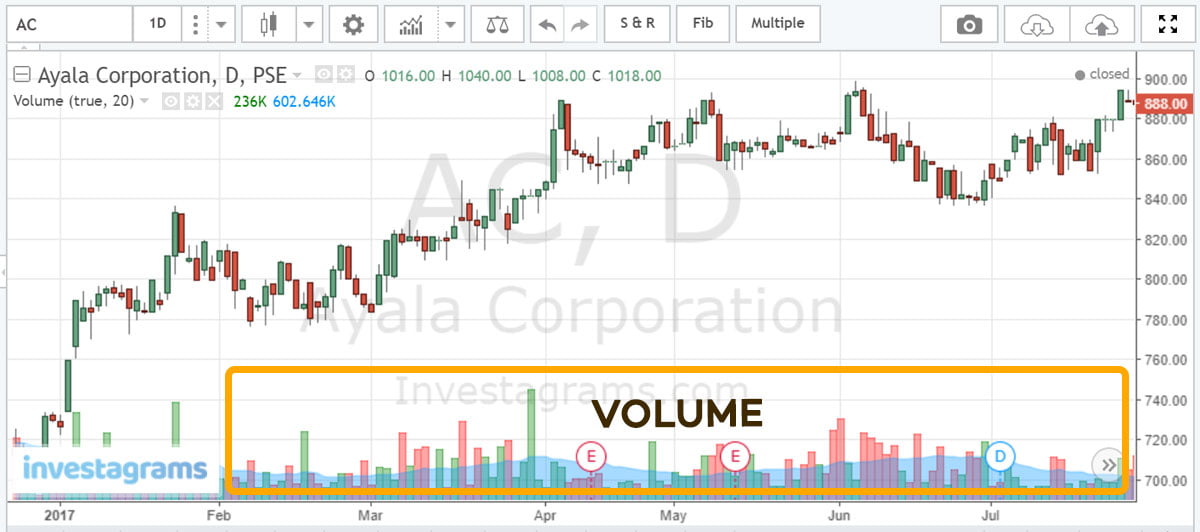
A lot of technical analysis involves looking at the stock price, but that’s not the only important statistic in TA. Another equally important, if not more important, number to look at is the trading volume.
The trading volume tells you the number of shares that were bought and sold in a particular time frame (usually a day). You can see the volume shown as a bar graph at the bottom of the stock chart.
Volume is important because it gives context to price movements. It tells you how strong or weak a trend or chart pattern is.
For example: If the price of a downtrending stock starts going up, does it mean the trend changed to an uptrend? Take a look at the volume and you’ll find out. If the volume is low, then the trend will probably continue going down. If the trading volume is high, it means that there is a strong demand for the stock and the trend will likely change to an uptrend.
The rule of thumb? Kung high volume, push mo na. Kung low volume, ingat muna.
4. CHART PATTERNS
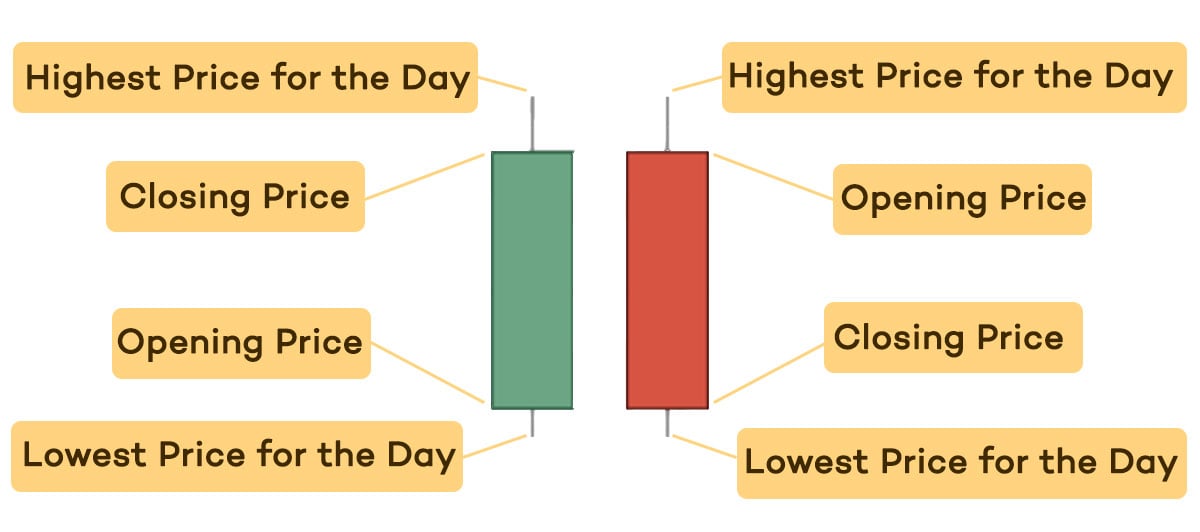
There are many kinds of charts that traders can use to monitor the stock market, but the most popular is probably the candlestick chart.
A candlestick chart shows four key prices for the day—the opening price, closing price, highest price, and lowest price. These are based on that day’s completed transactions.
If the candle is green, it means that the closing price was higher than the opening price. If it is red, it means the opening price was higher than the closing price.
The colors might change depending on the chart you’re using, but one color will always show an increase in price over the day and another color will show a decrease in price.
Once you understand how to read charts, then you can also start seeing patterns forming. Because TA assumes that history repeats itself, we can use past patterns to predict future movements in the market.
Here are some basic chart patterns:
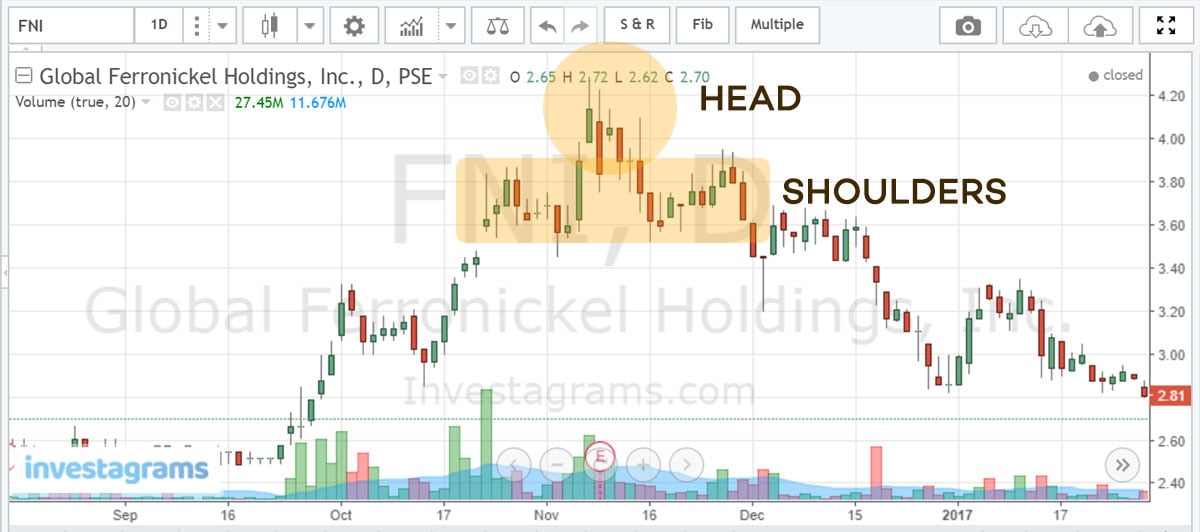
Head and Shoulders A “head and shoulders” means that there are 3 peaks in your chart pattern—the middle peak is the highest (head) with two relatively equal lower peaks beside it (shoulders). This pattern signals a trend reversal, with the line connecting the two “shoulders” as the key support level to watch. If you see the price break below that level, expect a trend reversal or breakdown of the stock. An inverse head and shoulders may also signal that a downtrending stock is about to change to an uptrend.
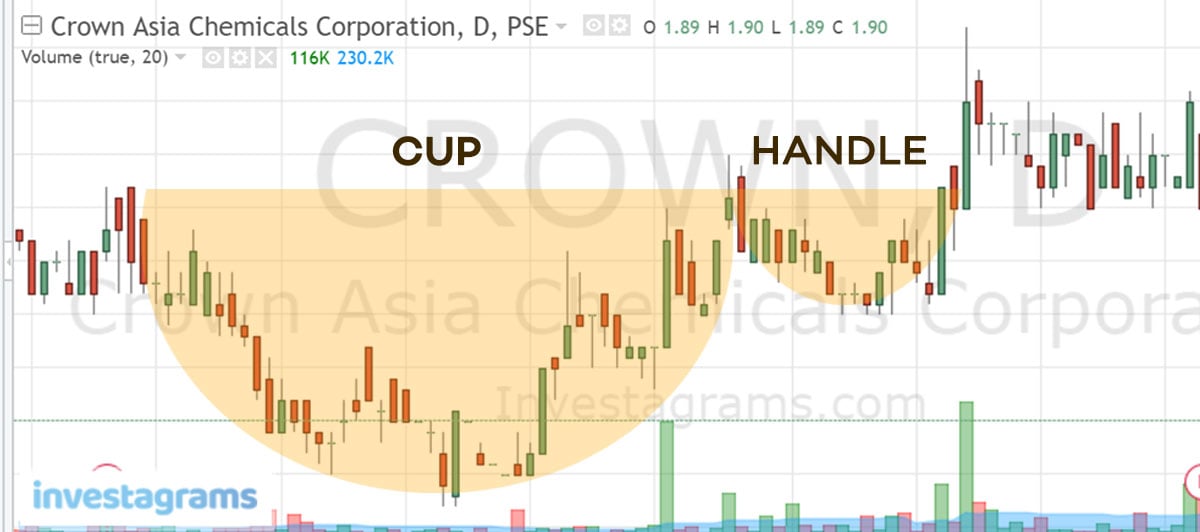
Cup and Handle A “cup and handle” forms when, after an uptrend, the chart forms a large U-shaped curve (the “cup”) followed by a smaller dip before continuing upward (the “handle”). This pattern signals that the the stock is bullish. If the pattern is completed, the price will likely resume its previous upward trend. If the right side of the handle breaks above the peak formed between the cup and the handle, it confirms that the pattern is complete and that the uptrend will resume.
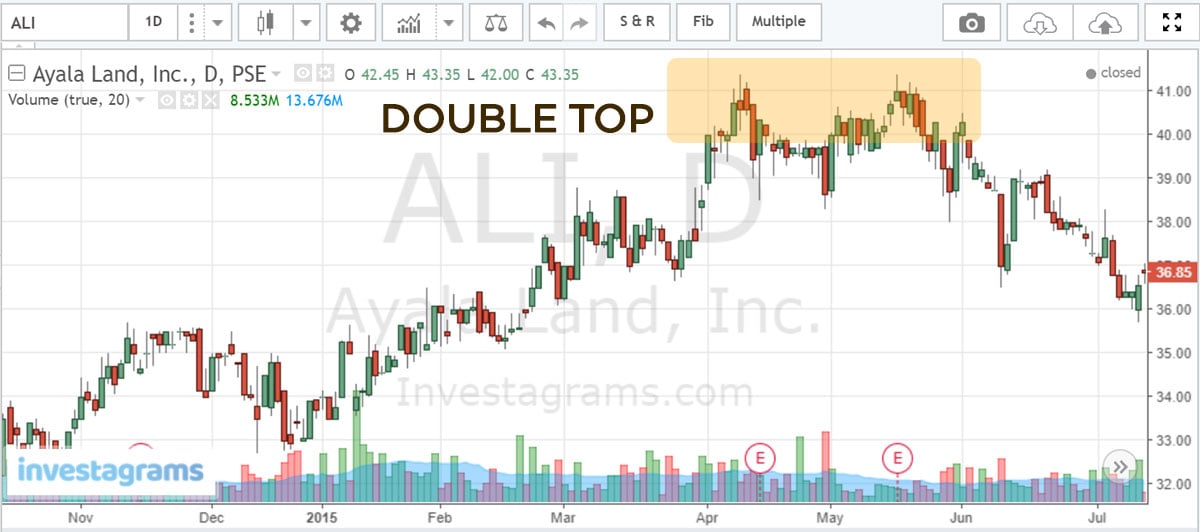
Double Top or Double Bottom A “double top” or “double bottom” forms when a stock hits its existing support or resistance level two times without breaking through. After the second peak or valley, watch out to see if the chart breaks the key support or resistance level. If it does, you will likely see it continue all the way up or down, forming a trend reversal.
5. Moving Averages
There are many types of moving averages used in technical analysis, but they all have one intention—to remove day-to-day price fluctuations and make chart analysis easier. Moving averages allow us to plot smoother lines that show trends and patterns more clearly.
One of the most popular types of moving averages is the simple moving average (SMA). We’ll focus on this for now.
To find the simple moving average, just get the sum of all the prices in a certain period and divide it by the number of prices you added up. The most common periods used in TA are the last 20, 50, 100, or 200 trading days but you can really use any period you want.
You can use these moving averages to determine support and resistance levels and to identify trend reversals.
A long-term moving average, like the 200-day moving average, is often used as a basis for the stock’s support or resistance. It shows the general trend that the stock has been moving in.
A short-term moving average, like the 20-day moving average, shows how the stock is performing now . When compared to the long-term moving average, it shows to how the stock is performing compared to its past performance.
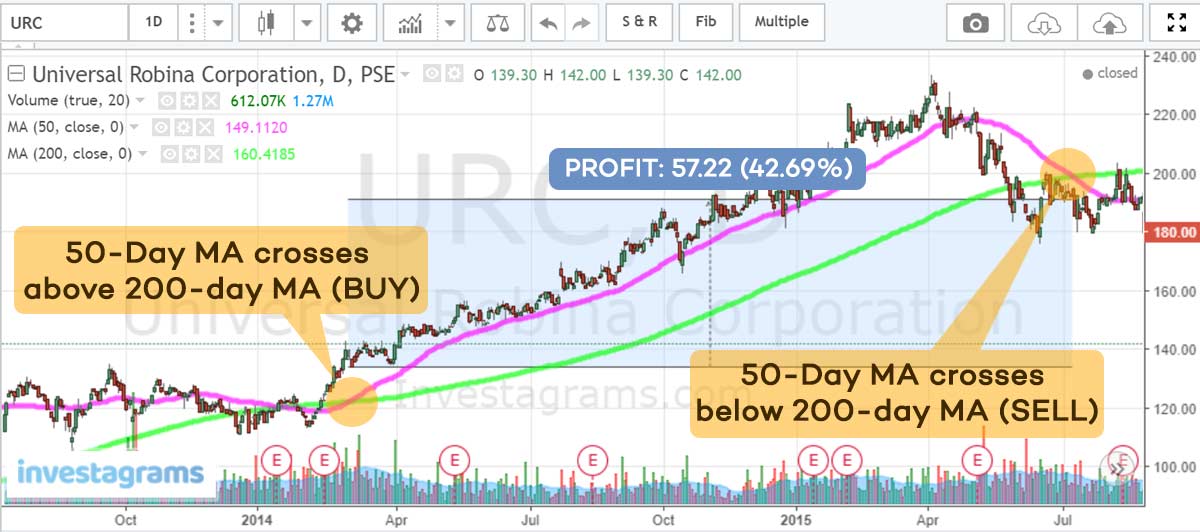
If the short-term SMA line rises above the long-term SMA line, you should buy stocks because it means the trend is going upward.
If the short-term SMA line falls below the long-term SMA line, you should sell your stocks because it means the trend is going downward.
Conclusion
We talked about a lot in this article, but we barely scratched the surface of technical analysis! As you practice trading, you will learn how to combine these concepts and turn them into practical and useful trading strategies.
Stay tuned as we dive deeper into each of the concepts in our next articles and subscribe to InvestaDaily for more investing tips and stock market advice!
In the meantime, try applying the concepts above in your trading! Leave your comments below and update us on how you’re doing. 🙂
There has been news going around lately that the Philippine Stock Exchange (PSE) might finally allow short selling in 2018, resurrecting a plan that has been in the works since 2009. Whether or not the plan will push through is another story, but if it does, you need to be ready.
In this article, we’ll explain the basics of short selling, our advice, and how you can prepare yourself for the shake-up that might be coming in a few months.
What is Short Selling?
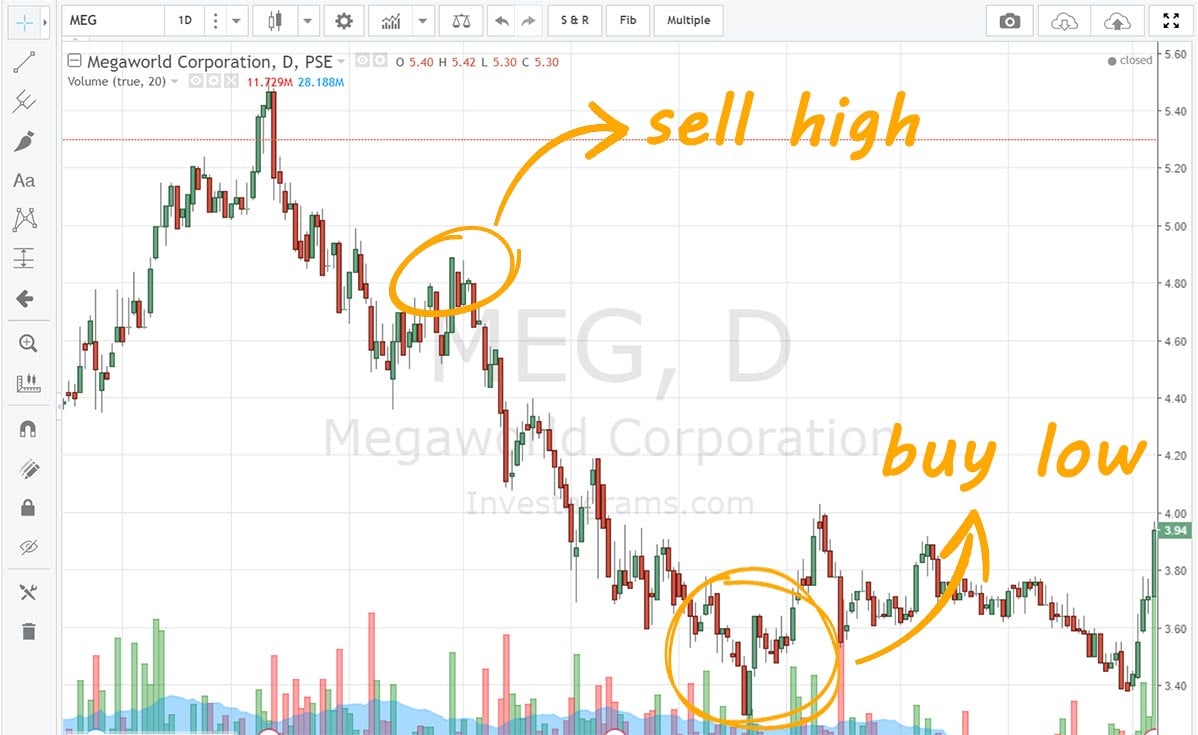
Short selling, also known as taking a short position, is when a trader sells a stock at a higher price before buying it at lower price—sell high, buy low. It’s just the opposite of taking a long position, where you buy low and then sell high.
Now, we know what you’re thinking. How the heck can you sell a stock before buying it??
The answer to your question is simple: you borrow shares. In other words, umutang ka muna. Sell those borrowed shares first. After that, you just have to buy shares to replace the ones you borrowed.
What Short Selling Means for PSE Traders
Most traders in the PSE always take the long position simply because it’s the only option available. For years, we’ve meticulously researched and developed systems to find and profit from stocks that are expected to increase in price.
We’re used to ignoring stocks with prices that are about to go down. After all, you can’t make money with those, right? Well with short selling, you can!
If you know how to use both the long and short positions, you can make money from stocks that are going up and from stocks that are going down!You will essentially double your opportunities in the stock market. Of course there are also risks involved, but if you keep learning and stay disciplined then there’s no reason why you can’t succeed.
Our Advice
In the stock market, those that keep learning, trying new things, and improving themselves are the ones who succeed. None of us know for sure if short selling will really be allowed in 2018. But no matter what happens, you should still read about it and prepare yourself if you haven’t already.
Besides, you’re already doing the work anyway. The same research will tell you if a stock’s price will go up or down. Why not give yourself the opportunity to earn from both scenarios instead of ignoring half the opportunities?
We’re not saying you have to put 50% of your portfolio in the short position—not at all! After learning about short selling, you might even decide that it’s just not for you and that would be fine. But either way, you need to understand it first. Even if you don’t end up using it, you need to know what it is and how it affects other traders and the markets.
Try Before You Buy!
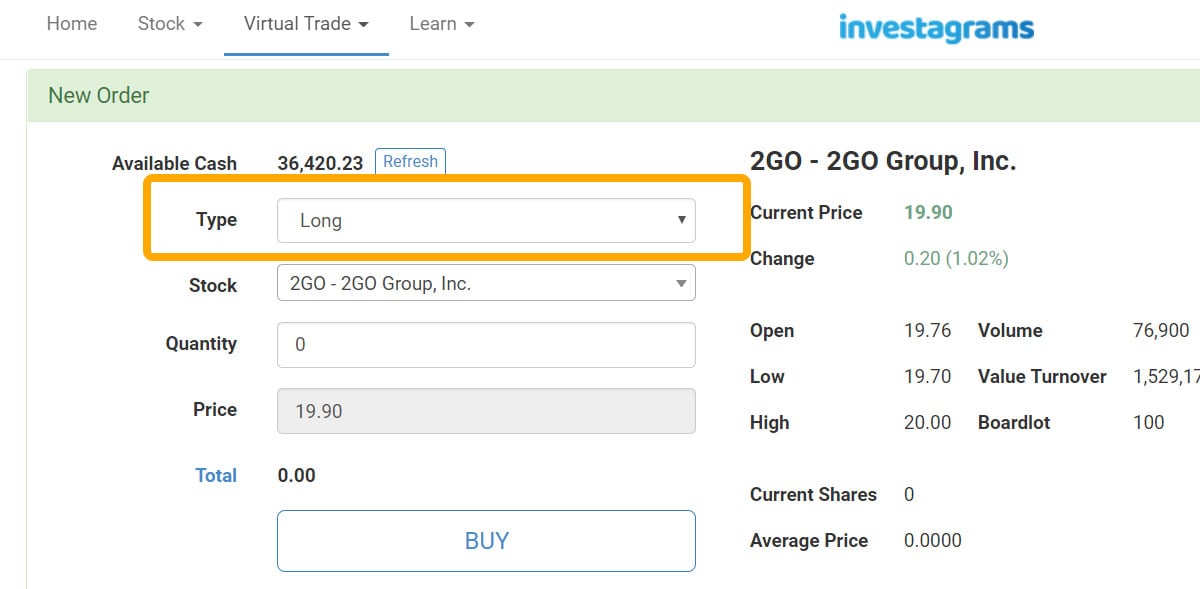
They say experience is the best teacher. So even before short selling is allowed in the PSE, you can already start practicing! See and feel what it’s like to trade from the short position using the Investagrams virtual trading platform. Just follow the 3 simple steps below to activate the feature:
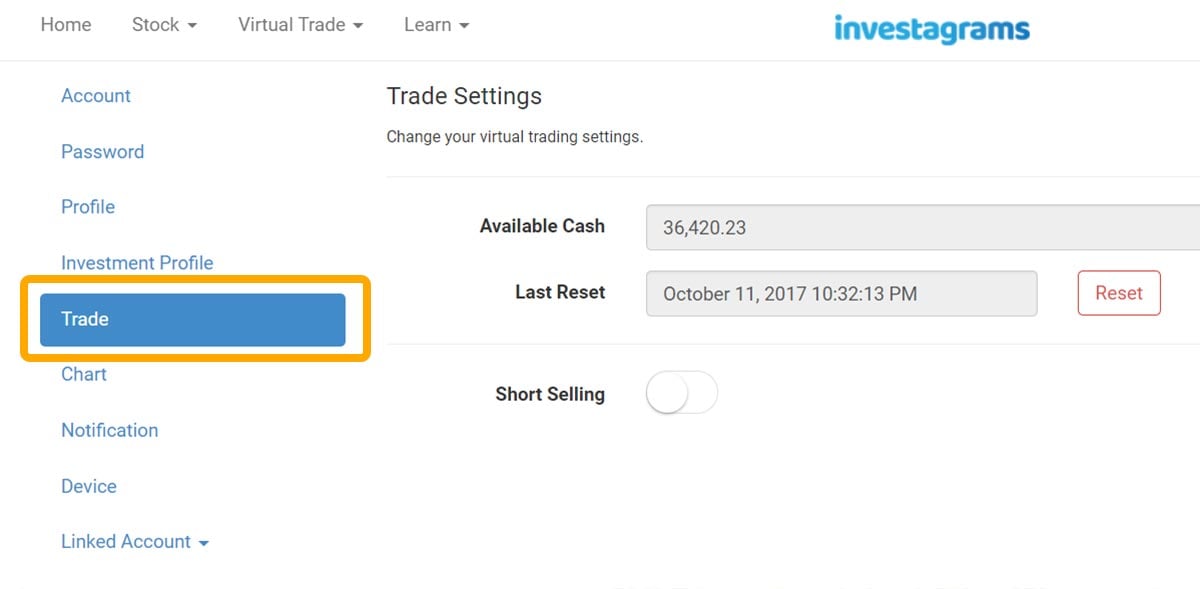
Step 1: Go to your trade settings.
Click on your profile icon on the upper right of the homepage and select “Settings” from the drop down menu. When you’re on the Settings page, click “Trade” on the left navigation.
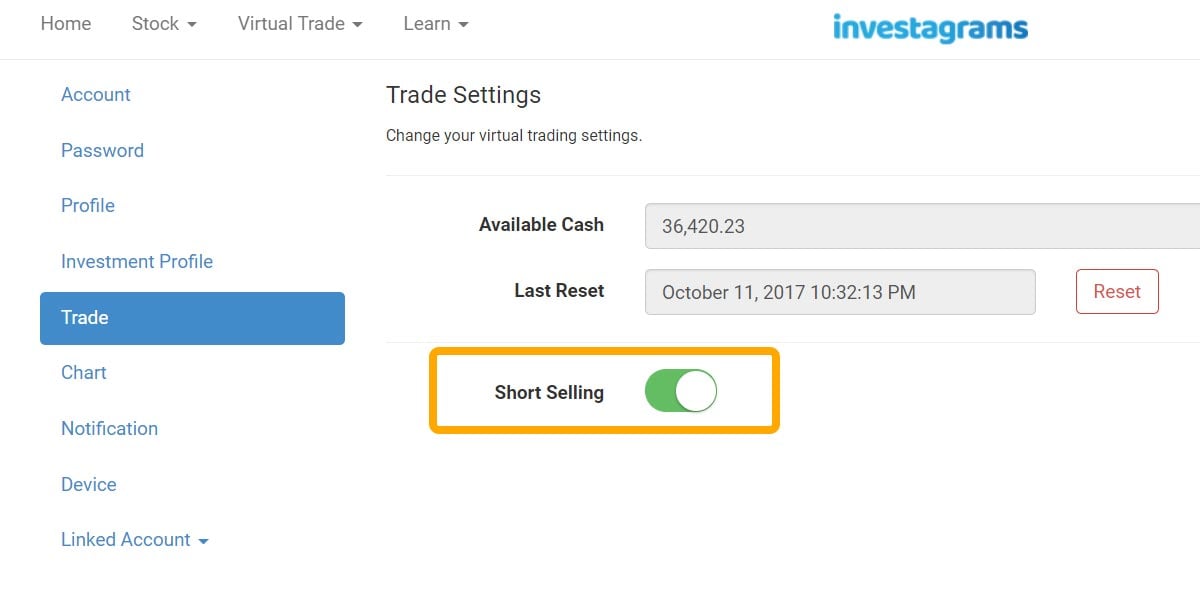
Step 2: Turn on the short selling feature.
Simply click on the toggle button to turn on the short selling feature. Your new settings will be saved automaticallly.
Step 3: Start trading!
When you go to your virtual trading account, you will now be able to choose if you want to trade from the long position or the short position.
Simple, right?
We hope this helped you understand what short selling is and how you can be prepared if the PSE allows it in 2018. If you have more questions, just leave them below!
For more investing tips and stock market advice, subscribe to InvestaDaily. You can also sign up for Investagrams to access free features to help you on your stock market journey.
At one point or another, we’ve all wondered “What is the minimum investment needed in the stock market?” or “How much should I save before investing in stocks?”
Ever since online stock brokers became popular, it seems like the minimum required investment keeps getting lower and lower. That’s good, right? Well, not always.
If you’ve tried stock trading or know someone who has, then you also know that it’s hard to make money in stocks.
There are over 200 listed stocks in the PSE, and literally thousands of factors that could affect their prices. It’s hard enough just keeping track of everything, let alone understanding each stock well enough to make money!
We don’t need to make life harder for ourselves—but that’s exactly what happens when you invest less than 8,000 pesos in the stock market.
A TYPICAL SCENARIO
Nowadays, some brokers won’t require a minimum investment. Others have been also lowering the minimum amount required so that more people can start investing.
While it’s great that this lets more Filipinos invest in the stock market, there’s a scenario that often gets first-time investors off guard.
The typical scenario goes like this:
Person A is interested in investing in the stock market. He finds out that the minimum investment is only 5,000 pesos. “Sulit na! Kikita naman ako dito,” he thinks to himself.
Person A invests the minimum amount and picks two stocks “para mas mababa ‘yung risk.” That’s around 2,500 pesos in each stock.
After successfully buying the stocks, Person A checks his portfolio and “HUH?? Bakit loss na kaagad? Di pa gumagalaw ang presyo ah!”
That’s what happens when people don’t realize that there are fees every time you buy or sell a stock.
BEWARE OF FEES
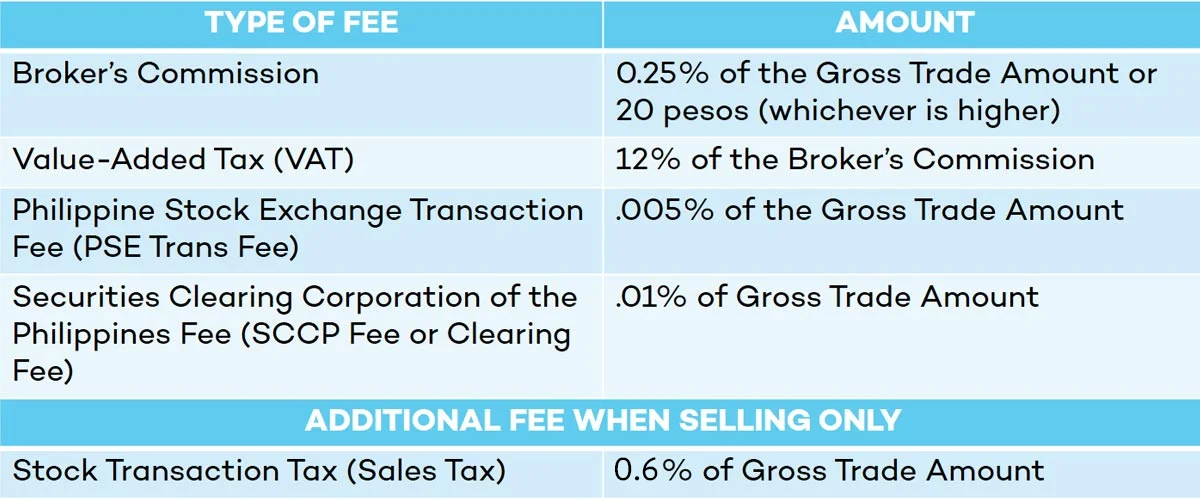
Below is a breakdown of all the fees and charges included in every transaction:
Most of the fees are based on the Gross Trade Amount (number of shares x price), so the cost is always proportionate to your investment. For example, the PSE Trans Fee will always be .005% and the SCCP Fee will always be .01%. However, notice that the broker’s commissionis 0.25% or 20 pesos—whichever is higher.
NUMBERS DON’T LIE
So what does this mean for retail traders? It means you need to avoid buying or selling anything with a Gross Trade Amount less than 8,000 pesos. Otherwise, you will be wasting money on higher commission fees and incurring unnecessary losses.
In the example earlier, Person A bought two stocks, each with a Gross Trade Amount of only 2,500 pesos. This means that Person A’s total commission fees would have been 20 pesos for each transaction, or 40 pesos total. That’s an automatic 0.8% loss on commission fees alone!
But what if Person A invested 8,000 pesos in just one stock? His total commission fee would only be 20 pesos (or 0.25% of 8,000). That means he was able to cut the commission fee in half and invest 3,000 pesos more!
CONCLUSION
We know that saving money can be very hard—especially if you have a family to support. 8,000 pesos is a lot of money after all!
But remember that investing less than 8,000 pesos, means you are losing more money even before there’s any price movement. You can definitely still make a profit, but it’s like stepping on the gas and break pedals at the same time. It will be harder to break even or make a profit.
Weigh the risks carefully before making your decision, and ask yourself: How confident am I that the (potential) profits will offset my (definite) losses?
Subscribe to InvestaDaily for more investing tips and stock market advice, or sign up for Investagrams to access special features to help you reach your first million.
In our first video, we taught you the basics of how to read stock charts. We explained candlesticks, trend lines, and support and resistance.
Now, we’ll dive deeper into support and resistance—the backbone of all price structure analysis methods in technical analysis.
Watch the video above to learn how mastering support and resistance can make you a more profitable trader. We’ll also teach you about breakouts, breakdowns, and role reversals—when resistance becomes support or support becomes resistance. This will help you predict the best time to buy and sell.
This video is in a mixture of Filipino and English.
Subscribe to InvestaDaily for more investing tips and stock market advice, or sign up for Investagrams to access special features to help you reach your first million.