
If you hang out with a lot of traders, then you’ve probably heard about Elliott Waves at least once or twice. And if you’re a beginner in the stock market, then you’ve probably been confused by them at least once or twice too!
In this article, we’ll explain the basics of the Elliott Wave theory, give you a simple overview of how it works, and break down its pros and cons so you can decide if it has a place in your trading strategy.
Background
Price movements in the stock market can seem quite random, especially if you’re a beginner. But a quick intro on technical analysis will show you that the market actually moves in repeating patterns. The Elliott Wave theory is just one method under technical analysis that maps out how these patterns unfold.
Back in the 1930’s, an accountant named Ralph Nelson Elliott noticed that there was a specific pattern of waves that appeared again and again in the stock market. This pattern of waves are what we now call Elliott Waves.
How It Works
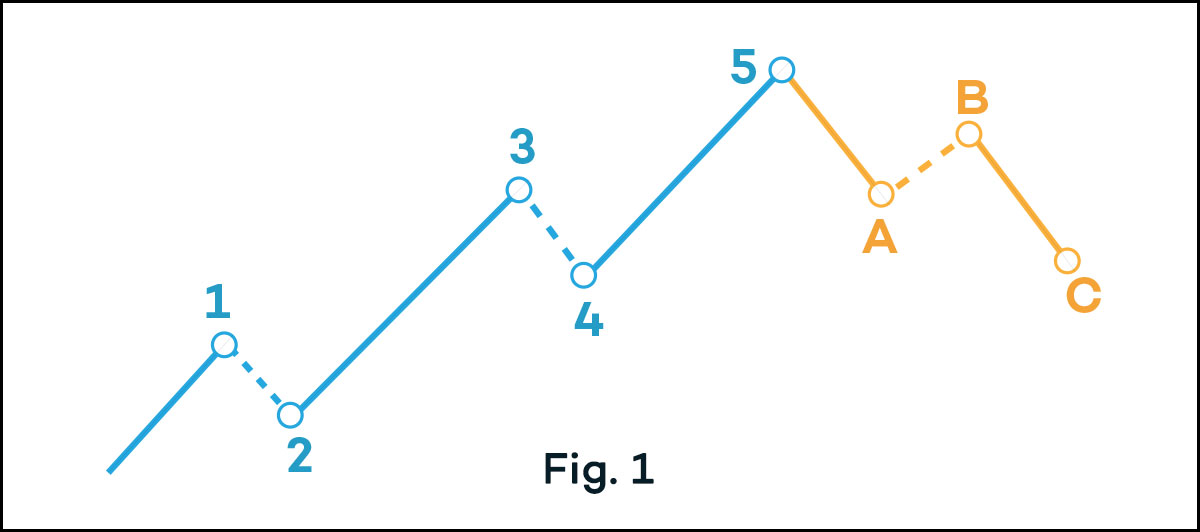
The basic Elliott Wave pattern includes two phases—an impulse phase and a corrective phase. The impulse phase has 5 waves and goes with the dominant trend while the corrective phase has 3 waves and goes against the dominant trend.
Here’s a simple illustration to show you what these waves look like when the overall trend is bullish (Fig. 1) and when the trend is bearish (Fig. 2).

Eventually, the shorter cycles of Elliott Waves can also combine to form bigger Elliott Waves spanning longer periods of time. Every completed cycle, no matter what degree, will still develop the same 5-3 wave pattern.
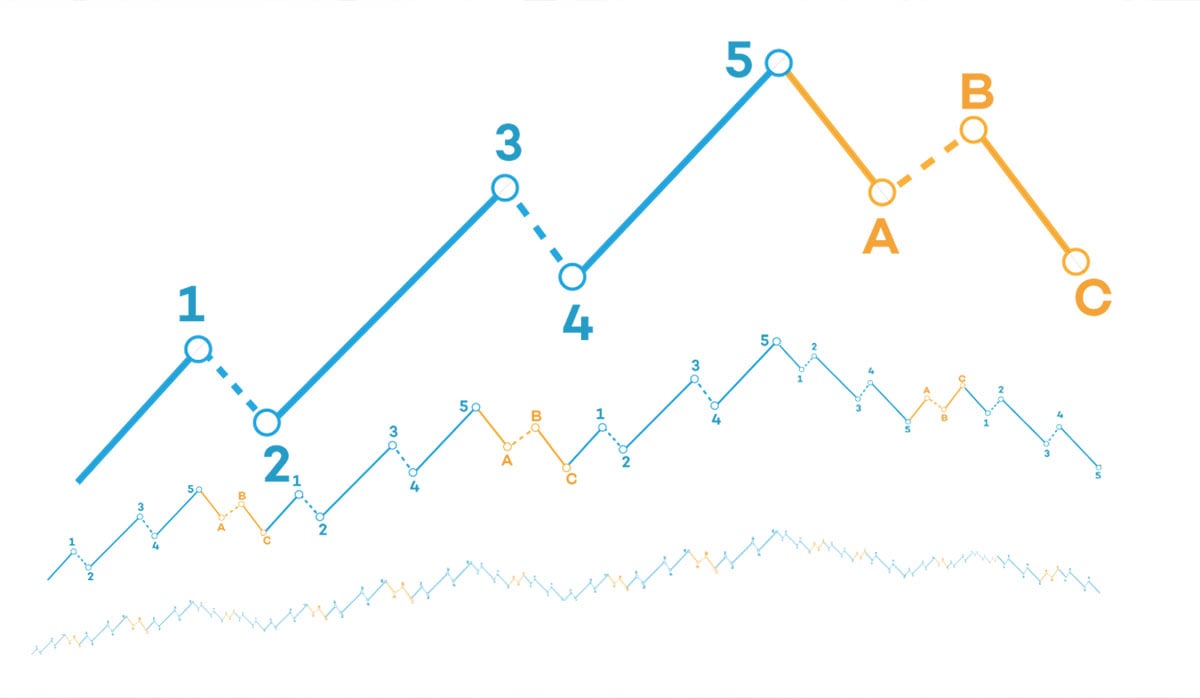
Elliott Waves can form over many different time frames. A cycle can be completed in just a few minutes or over centuries! Although there’s no exact rule on which degrees correspond to which time frame, there are 9 generally accepted levels and labels:
- Grand supercycle: Forms over hundreds of years
- Supercycle: Forms over many decades
- Cycle: Forms over a few years (minimum of 1 year), but possibly also a decade or two
- Primary: Forms over a few months to a couple of years
- Intermediate: Forms in a few weeks to a few months
- Minor: Forms in a week to a few weeks
- Minute: Forms over a few days
- Minuette: Forms in a few hours
- Subminuette: Forms in just minutes
The Elliott Wave theory can easily become complicated, but at the end of the day it’s just a form of pattern recognition. Knowing the pattern allows you to predict price movements and make better trading decisions.
To use the Elliott Wave, you must first identify two things:
- If the dominant trend is bullish or bearish
- Which wave you’re currently on
To spot Elliott Waves correctly, make sure to follow the 3 basic and unbreakable rules:
- Wave 2 should never go beyond the start of wave 1.
- Wave 3 cannot be the shortest among waves 1, 3 and 5.
- Wave 4 never overlaps with wave 1.
Conclusion
Recognizing the Elliott Wave pattern can involve a lot of subjectivity, so results will vary from trader to trader. In some ways, you might even say that executing it is more of an art than a science.
We can’t tell you if this method will work for you or not, but what we can say is that there are people who have used it and profited from it.
What about you? Are you going to try the Elliott Wave or is there another method that you swear by? Let us know in the comments below!