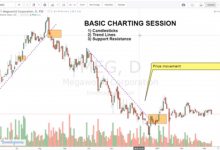
In our first video, we taught you the basics of how to read stock charts. We explained candlesticks, trend lines, and support and resistance.
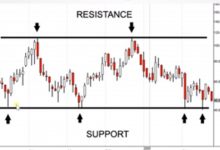
Now, we’ll dive deeper into support and resistance—the backbone of all price structure analysis methods in technical analysis.
Watch the video above to learn how mastering support and resistance can make you a more profitable trader. We’ll also teach you about breakouts, breakdowns, and role reversals—when resistance becomes support or support becomes resistance. This will help you predict the best time to buy and sell.
This video is in a mixture of Filipino and English.
Subscribe to InvestaDaily for more investing tips and stock market advice, or sign up for Investagrams to access special features to help you reach your first million.
Whatever your investing style, knowing how to read stock charts is a skill that is sure to help you succeed in the stock market.
Watch this short tutorial video to learn the basic ways to read a stock chart—including how to read candlesticks, identifying trend lines, finding the support and resistance, and spotting breakouts or breakdowns. All of these will help you understand charts better and make more informed trades.
This video discusses technical analysis concepts in a mixture of Filipino and English.
Subscribe to InvestaDaily for more investing tips and stock market advice, or sign up for Investagrams to access special features to help you reach your first million.
We all know that there is money to be made in the stock market. Big corporations and retail traders make millions from the market every day! But how do they do it? And how can a regular Filipino do the same? Where do we even start?
The stock market can seem very complex, and sometimes it is! But don’t let that intimidate you. Just like with any other skill, you have to start with the basics first. Walk before you try to run. Keep making improvements, no matter how small, and you’ll reach your goals before you know it!
There are literally thousands of trading strategies being used around the world, but you don’t have to (and you shouldn’t) be using them all. Start with one simple strategy before trying more advanced tactics. Learn what works for you and what doesn’t, and slowly but surely you’ll see results.
In this article, we’ll help you take that first step by explaining some basic principles along with two simple strategies that you can use to start trading in the stock market. Ready? Let’s get started!
BUYING LOW AND SELLING HIGH: WHAT IT MEANS AND HOW IT’S DONE
When asked, “How can I make money in the stock market?” a lot of people say that “It’s simple. Just buy low and sell high.” Well, of course! No one is going to make money by buying high and selling low. That’s just common sense. But how can we buy low and sell high? There is no crystal ball to tell us what the future holds or how the market will move, so how will are we supposed to know whether the current price is low or high?
Well, the good news is that you don’t need a crystal ball or a time machine to see into the future—you just need to understand the concepts that trigger movements in the market. The better you understand the forces that shape the market, the more often your predictions will be right.
THE BASICS: SUPPLY AND DEMAND
In one way or another, everything that happens in the stock market is a result of supply and demand reacting to one another. There are a limited number of stocks, so if a stock is in demand and more people want to buy it compared to those who want to sell, then the price goes up. The opposite happens when more people want to sell and fewer people want to buy.
Think of it this way: A 1-pc Chickenjoy costs P89 right now. But what if that 1-pc Chickenjoy was the last one on earth and everyone wanted to eat it? How much would people be willing to pay for that? On the other hand, if there were mountains of Chickenjoy everywhere you look, would you still pay P89 for it? Probably not. It sounds funny, but the entire stock market functions on basically the same principle.
People want to buy and sell stocks for many reasons. Whatever those reasons are, they will cause either a stronger demand or supply. This will be reflected as an increase or decrease in price. So how does this help you see into the future? Simple. You just need to be able to identify the signals and triggers that indicate when a rise in supply or demand will come. All stock trading strategies, from the most simple to the most complex, are based on this idea.
BASIC STOCK TRADING STRATEGIES FOR BEGINNERS
Disclaimer: Before you read about the two basic strategies below, you should first understand the two schools of thought behind these strategies: Fundamental Analysis and Technical Analysis. You might want to first read about some basic stock trading terms here.
STRATEGY 1: VALUE INVESTING
Commonly described as “buying a business,” this strategy relies heavily on fundamental analysis. In this strategy, we assume that the market price will eventually become equal to the intrinsic value of the company. The basic principle here is to identify stocks whose market value is less than its intrinsic value. When you buy an undervalued stock and the market price corrects itself, that is where you make your profit.
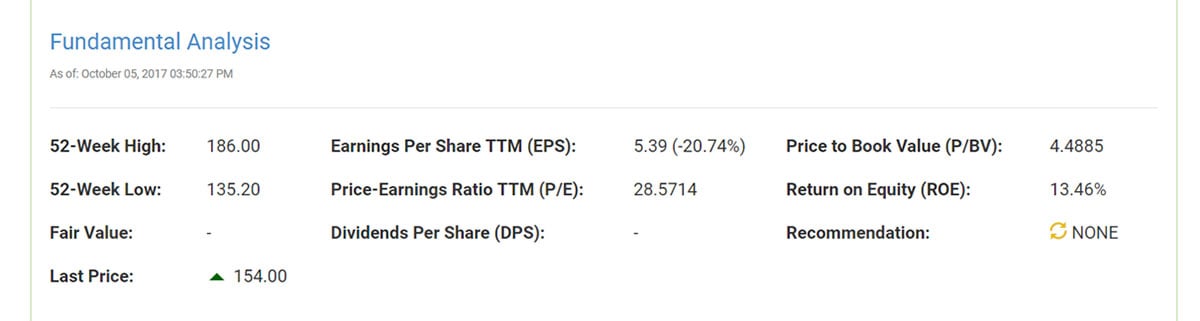
There are many indicators and formulas people use to identify the intrinsic value of a company, but one of the simplest and most popular indicators is looking at the price-to-earnings or P/E ratio. To get the P/E ratio, just divide the price of the share by the earnings per share. Value investors will compare the P/E ratios of companies within or across industries to identify undervalued stocks. For example, if you see that the average P/E ratio for a company in the logistics business is 10 but one company has a P/E ratio of 5, then you may want to invest in that company.
There are many other indicators that you could use, but this is one of the most basic. Keep in mind however that a low P/E ratio is not always a good thing. Low prices could also mean there’s trouble inside the company, and that the value will continue to go down. That is why it is important to do thorough research after identifying potentially undervalued companies. As the name suggests, traders that use this strategy have to look for a good business with real value. Act as if you are becoming part-owner of that business, because that’s essentially what you are doing!
Other similar strategies that also use fundamental analysis are Growth Investing, Income Investing, CANSLIM, and more.
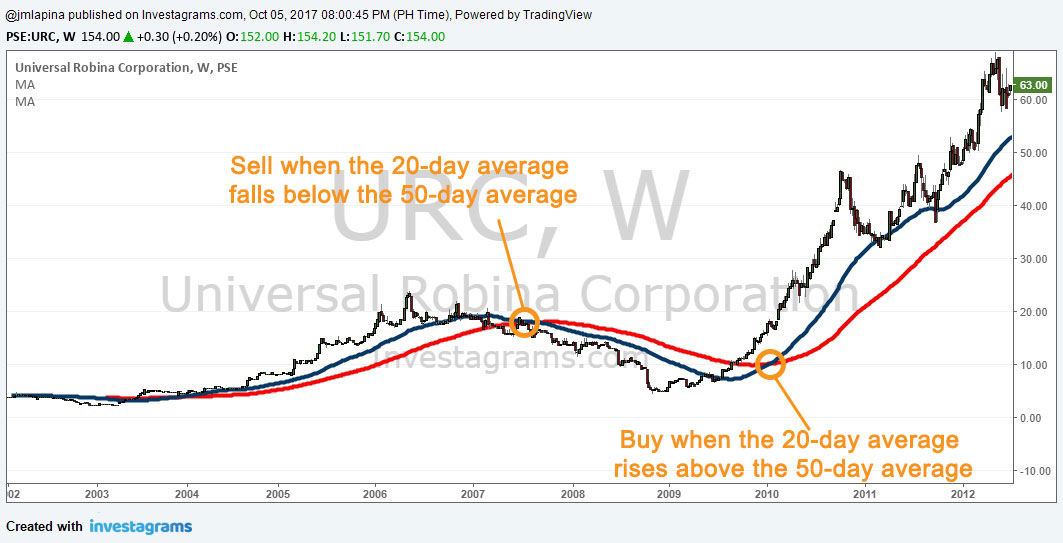
STRATEGY 2: MOVING AVERAGE CROSSOVER
On the other side of the spectrum, we have the Moving Average Crossover Strategy which an approach based on the principles of technical analysis. Here, we rely on patterns and data available in the market to predict future movements and make trading decisions. Your aim is still to buy low and sell high, but you are using different indicators and signals to do it.
To implement the Moving Average Crossover strategy, you simply have to monitor two moving averages: the 20-day moving average and the 50-day moving average of a particular stock’s price. If the 20-day average becomes higher than the 50-day average, it means that the price is going up and you should buy shares. If the 20-day average falls below the 50-day average, you should sell because it means the price is going down. Sounds simple, right?
Many find this type of strategy easier to implement because it is very objective and there is very little chance of becoming emotional. It also requires relatively less research compared to Value Investing, so it’s less intimidating for a beginner. However, you should remember that at the end of the day it is always good to understand the logic behind the numbers. The “rules” in any trading strategy are never fool-proof. There are times when they will be wrong, and understanding the sentiment behind the market’s behavior can only help you make smarter trading decisions.
If you want to learn more about technical trading, you can also review some basic concepts such as Support and Resistance, Candlestick Charts, and Trends.
Every trader is unique and must refine his or her strategy over time. Some traders have very complex strategies, while others prefer to keep it simple. As you execute your trades and test more strategies for yourself, you will find a unique style that suits you. These are some basic ones to help you get started, but remember that the most important thing is for you to simply START. You can read all the articles you want, but unless you try it yourself, nothing will happen.
Good luck on your trades and remember, we’re always here to help!
What are the best stock trading tips you’ve received? Share them in the comments below and let’s move forward together!
Subscribe to InvestaDaily for more articles like these, or sign up for Investagrams to access special features to help you reach your first million.
Many people think that the stock market is complex and that trading is hard. Maybe that was true before, but nowadays there are many ways to make stock trading easy and hassle-free. One way is to use the tools, services, and information here on Investagrams!
Here’s how we can help you on your stock market journey:
Learn using our free videos and articles
If you’re a beginner in the stock market, or even if you have no idea about how stocks work, we have learning modules that can help you.
If you’re starting from nothing, you can read the Investagrams guide on How to Start Investing in the Stock Market first. For concepts that are more advanced, like how to read charts and understanding moving averages, you can follow Investa Daily—your trusted source for investing tips and stock market advice.
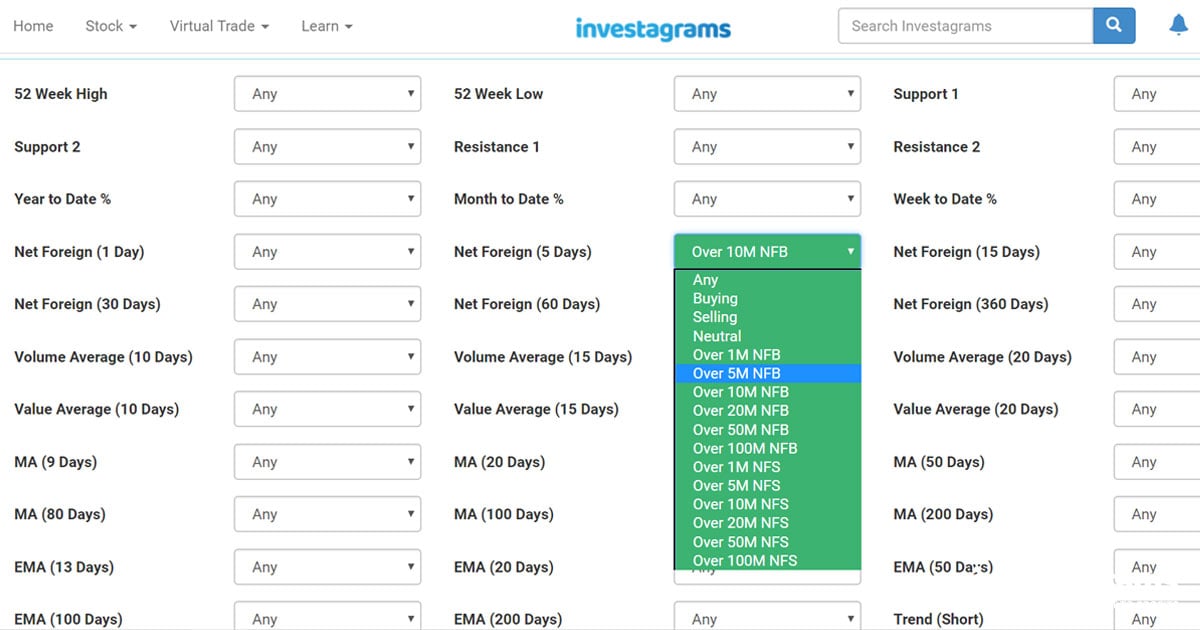
Find your ideal stocks using our automated stock screener
Once you’ve learned the basics of stock analysis, you can start to develop your own strategies and trading system. Use InvestaScreener to quickly and easily find stocks that match your criteria. Filter stocks based on the 52 week high, support, resistance, and much more.
InvestaScreener is a powerful and flexible tool that will help you save tons of time and effort when analyzing stocks. With this powerful stock screener, you can do what would normally take hours in just a few clicks.
Practice using our virtual trading platform
If you’re excited to trade but afraid to risk money, don’t worry! You can practice with the Investagrams virtual trading platform. It shows real companies and actual price movements in the Philippine stock market. Why is that important? Because you get to practice under real market conditions, and you’re prepared to jump straight into trading with real money any time!
Buy, sell, and manage your portfolio just like the real thing to test your strategies before putting real money on the line.
Monitor stocks and charts in real-time
Use Investagrams to get complete and up-to-date information on any stock listed in the Philippine Stock Exchange. Easily access all the numbers you need to make smarter decisions and better trades.
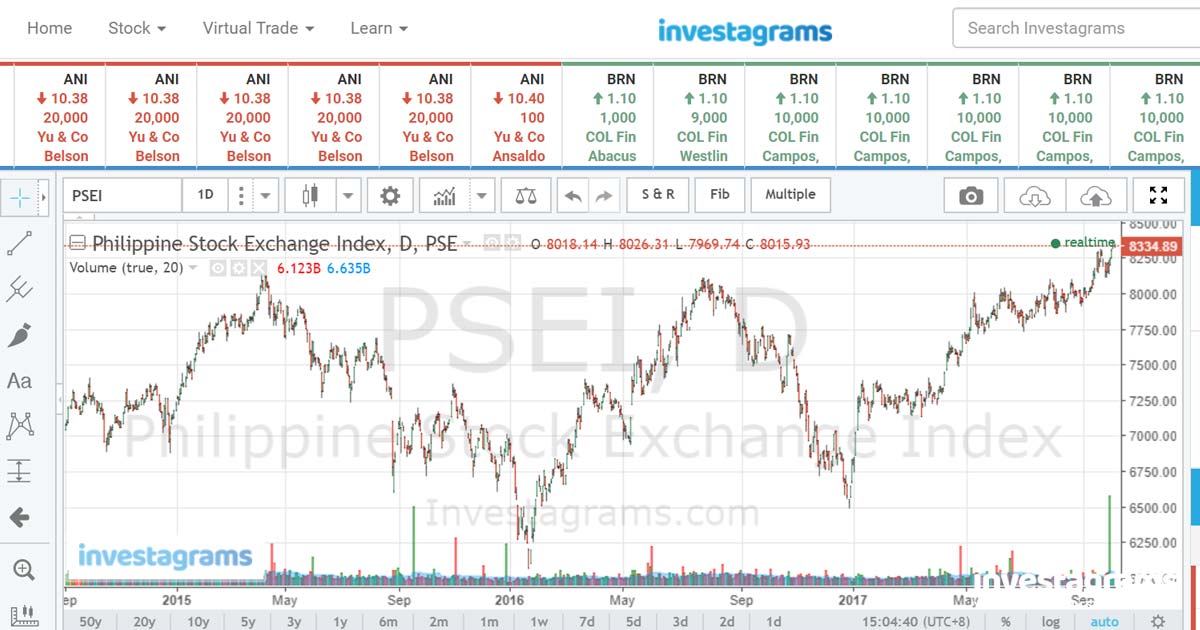
You can also study the price movements of your stocks using our real-time charting tool. Here you will easily be able to monitor the historical movement of price and volume, understand the context of supply and demand, and identify patterns that are forming in the market.
Stay up-to-date on the latest stock-specific news
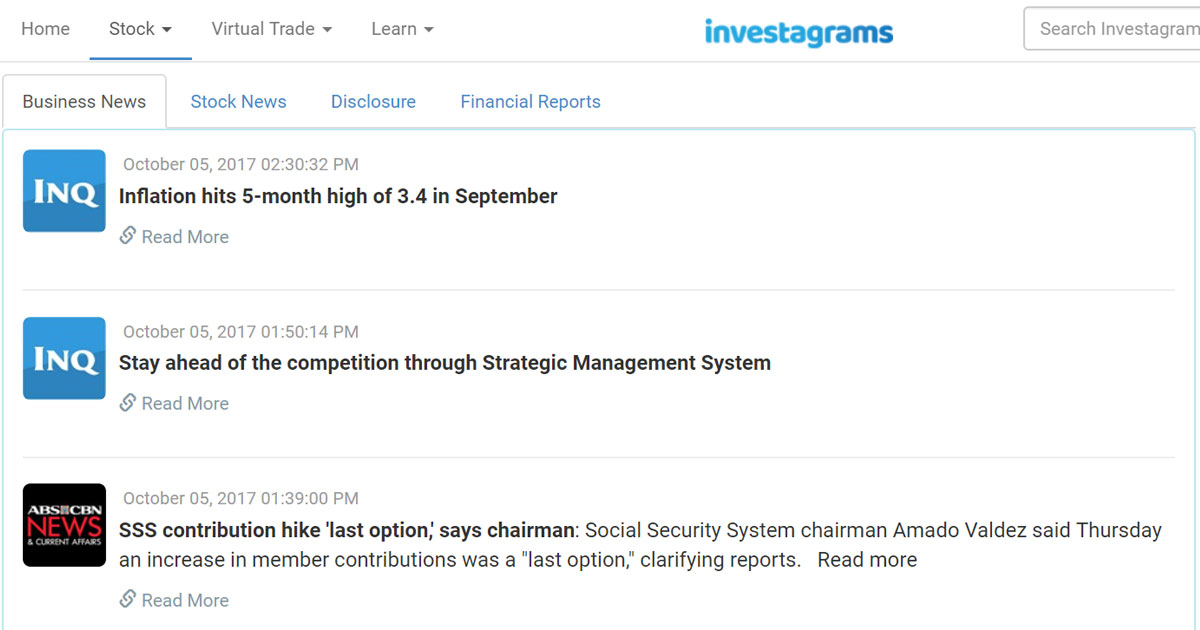
Instead of spending hours gathering information from tons of different sources, now you can just look atthe Investagrams News Feed. See all the business, economic, and stock-specific news organized in just one page. Not only will you save time, but you’ll also find it easier to monitor important news that could affect your stock picks.
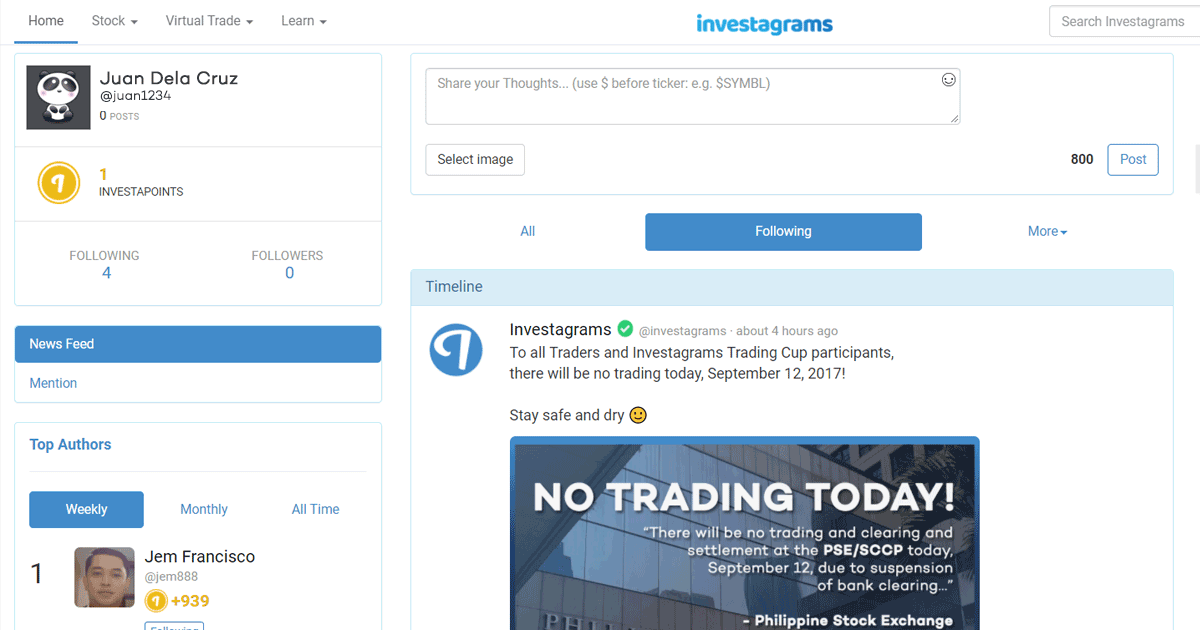
You can even follow and interact with other traders on Investagrams’ social platform to see what people think and how the news may affect the stock market.
Save time with our price and disclosure alerts
We’re all busy with our lives, whether it’s because of work, school, or our families — we all know how important our time is. But becoming financially free is important too, right?
With InvestaWatcher,you can receive instantalerts whenever your stocks hit your buy point, target price, and cut loss level. You will instantly get notified when your stocks have disclosures such as the earnings report, company buy backs, acquisitions,and other important announcements.
The best part? You can receive the alerts everywhere — SMS, e-mail, in-app notifications, and even Facebook Messenger! Forget about spending hours monitoring the stock market and let us do the work for you.
Get help on-the-go with the Investagrams Facebook chatbot
Investagrams is fully integrated with the Facebook Messenger through the InvestaChatbot.
Just chat the Investagrams FB page to get instant information on the current stock price, news, financial reports, and more!
Improve your skills by joining events and competitions
Investagrams holds many competitions and on-ground stock trading seminars throughout the year. Follow our Facebook page for announcements, and join us to take your trading to the next level. Plus, we’d love to meet you!
Our mission is to make your stock market journey easier and, of course, more profitable. We’re always developing new features and services to serve you better, so keep checking back to see if we’ve added anything new! If you have a question or a request, just let us know in the comments below!
We’ve all heard the saying, “Practice makes perfect,” but practicing in the stock market can get very expensive very quickly! Don’t worry though, because we’ve got good news for you—now you can practice trading stocks without risking any money!
With our virtual trading platform, you can buy stocks, test strategies, and manage a portfolio under real market conditions. Learn about actual companies listed in the Philippine Stock Exchange, and jump straight into real trading whenever you’re ready.
Already have an account on Investagrams? Just follow these simple steps to get started with your virtual trading account:
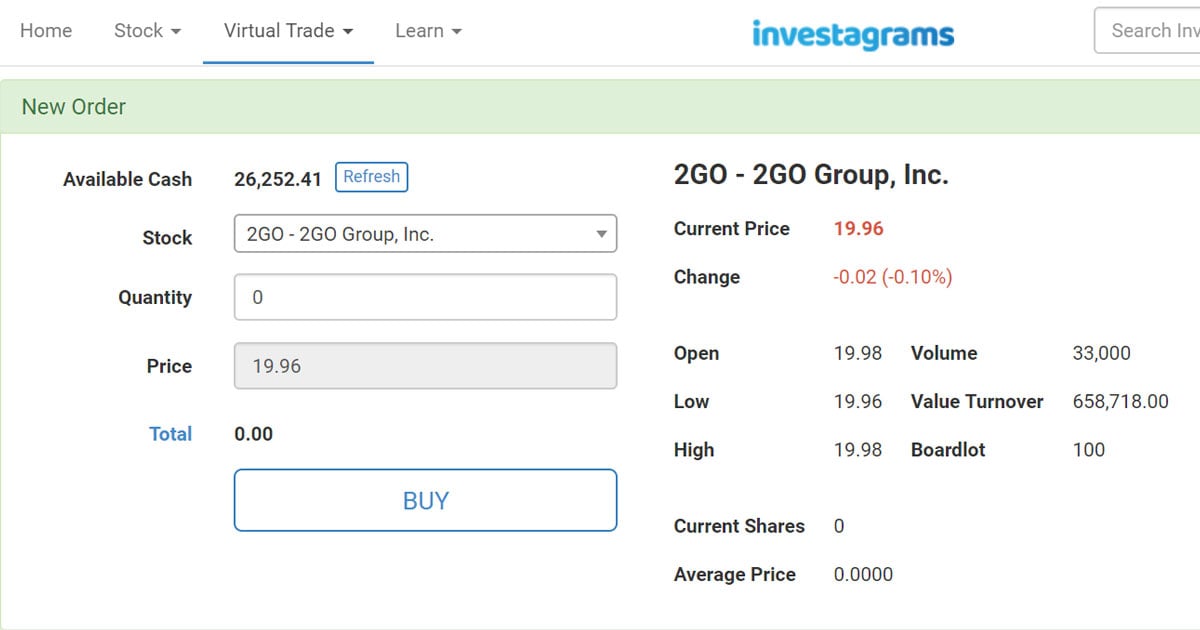
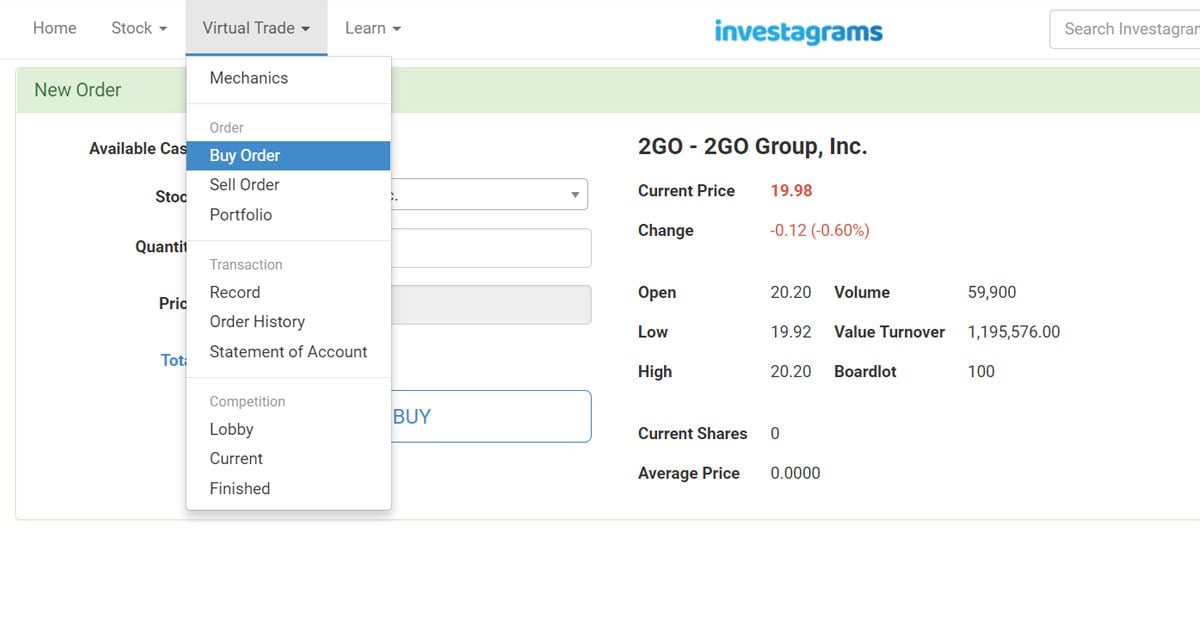
STEP 1: How to use the virtual trading platform (vTrade)
Once you are logged in to Investagrams, simply click ‘Virtual Trade‘ on the top left navigation bar. You will see a dropdown menu that corresponds to ‘Virtual Trade’ menu option. Click ‘My Portfolio‘ to go to your virtual trading page. You will see the overview of your Portfolio, Records, Order History (left side) and the Buy and Sell box on the right for you to start trading. Choose your preferred Stock and enter the number of quantity that you want to trade in. Click ‘Buy’ if you want to buy stocks or Sell Order’ if you want to sell stocks.
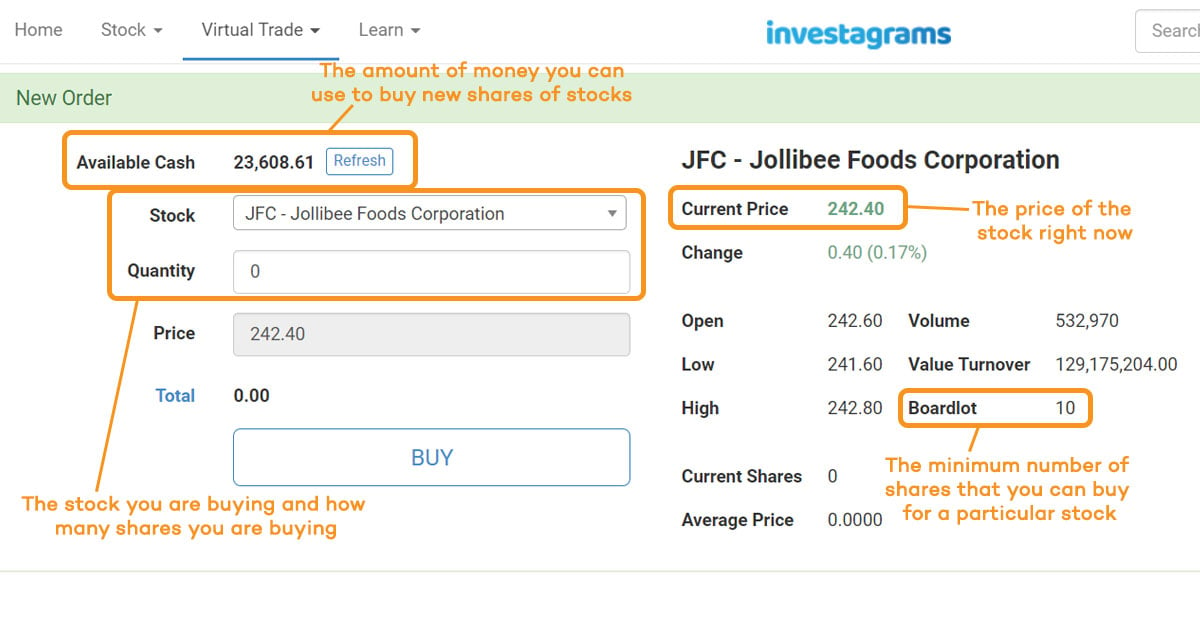
STEP 2: How to buy a stock
On the Buy Order page, use the drop down menu to find the stock you want. You can also type the stock name or stock code to find your stock faster. Enter the quantity or number of shares you want to buy, and simply click the “BUY” button at the bottom of the page.
Other important information you will see on the page include: your available cash, the current price of the stock, the boardlot or minimum number of shares you can buy, and more.
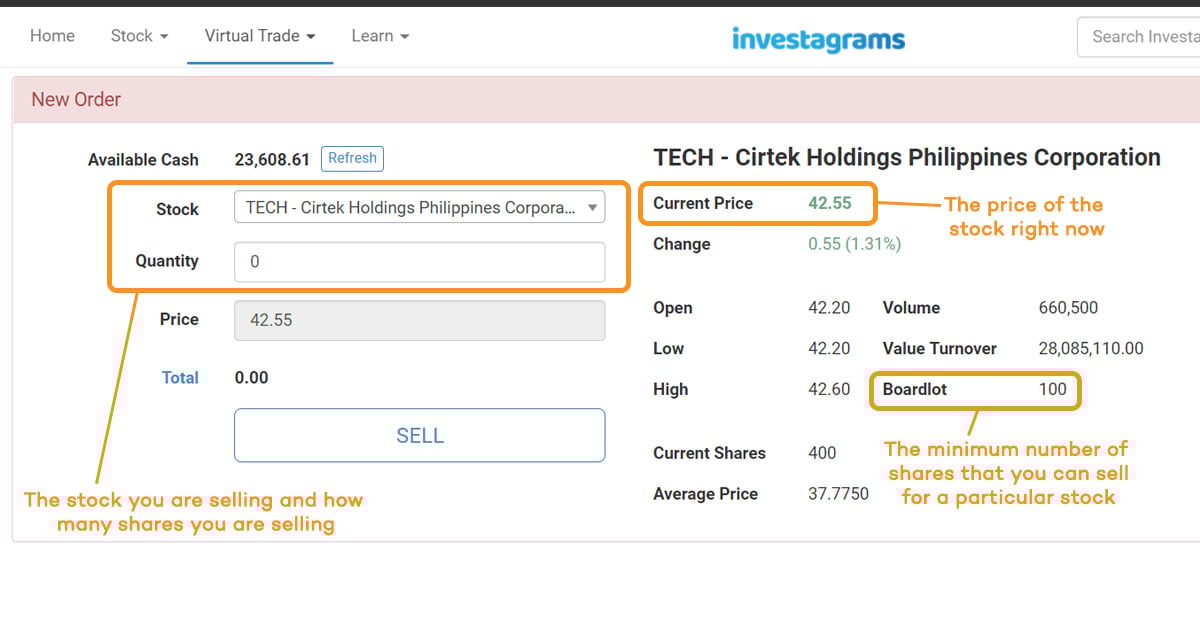
STEP 3: How to sell a stock
To sell shares of a stock you own, simply follow the same steps on the Sell Order page—use the drop down menu or simply type in the stock name to find the stock you want to sell. Then, enter the number of shares you want to sell and click the “SELL” button below.
Important information such as the current price, boardlot, and more can also be seen here.
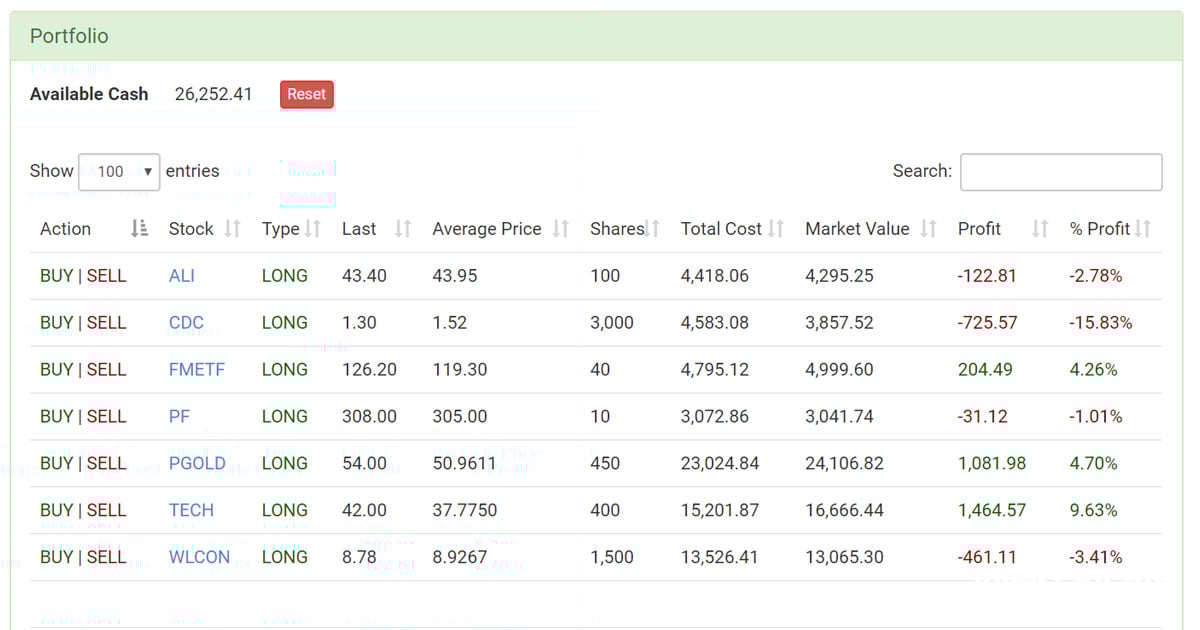
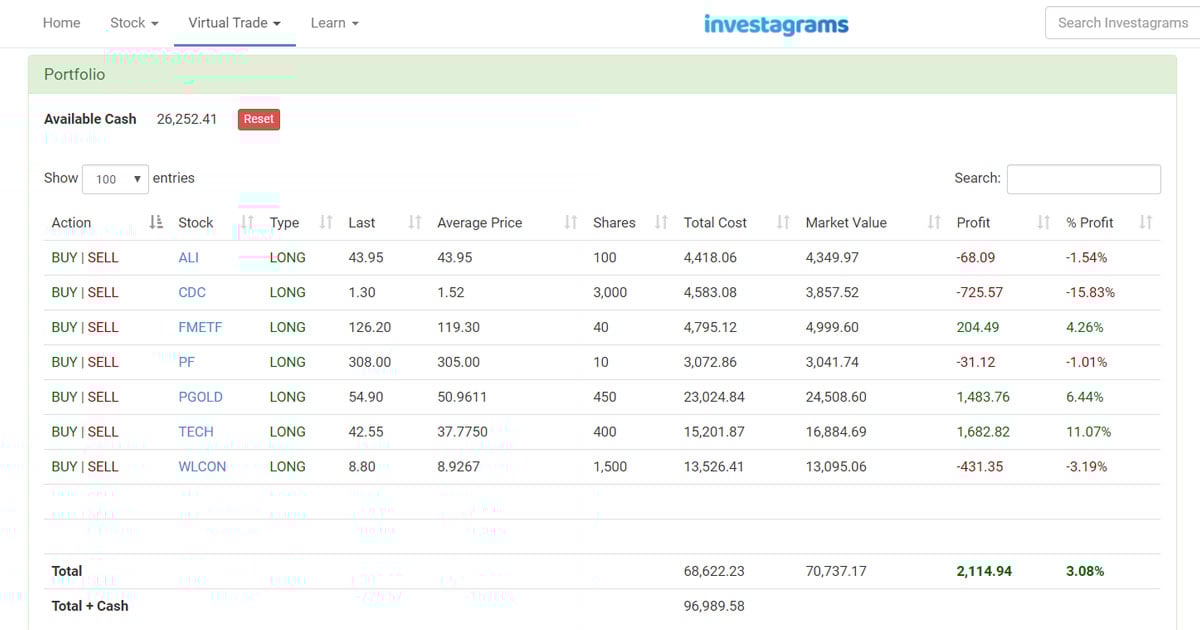
STEP 4: How to manage your virtual portfolio
To view your portfolio, simply go to the Portfolio page. Here you will see a summary of the stocks you currently have—the number of shares for each stock, the total cost, current market value, profit or loss so far, and more. You can also see the amount of cash you have available (at the top left corner) and the total value of your assets (stocks + cash).
Easy, right?
Don’t wait another second and start practicing today! You have nothing to lose!
Have you tried the virtual trading platform? Tell us about your experience in the comments below!
Being profitable in the stock market is not easy as it requires not only your belief, patience, and discipline, but also a great deal of your time to research and adequate understanding of the market, among many others.
Here’s a list of common stock market terminologies that you will inevitably come across in your investing journey. We’ve also added the gist of their definitions to get you ahead as learning these jargons (for newbies) is of extreme importance especially when you are starting out.
The goal here is not to memorize every terminology but use it as a guide to understand each vocabulary so you may take value from it:
GENERAL INVESTING TERMS
Invest – putting your money where it can grow
Stock – a share in the company
Dividends – the amount of money paid by the company to its shareholders
Common Stock – the type of stock that is least prioritized when declaring dividends and mostly profits through price appreciation
Preferred Stock – the type of stock that is first prioritized when declaring dividends
Risk – the potential of either gaining profits or losing your capital
Returns or Rewards – profits earned by investors
Short Term – less than six weeks (may vary)
Medium Term – six weeks to nine months (may vary)
Long Term – more than nine months (may vary)
Investors – people who invest their money with the expectation of gaining returns over a longer timeframe
Traders – people who buy and sell stocks to earn from price growth over a shorter timeframe
Blue-Chip Stocks – stocks of the biggest companies in the country
Growth Stocks – stocks which have high growth potential
Value Stocks – stocks which have low price-to-earnings or P/E ratio
Speculative Stocks – stocks which carry high risk compared to similar stocks
Defensive Stocks – stocks which do not decrease in price immediately, even when the market is down
Penny Stocks – stocks which trade at a very low price
Stock Market – where investors or traders buy and sell company stocks
Stock Market Index – a measurement of the value of the entire stock market or a particular industry in the market
PSEi (aka PSE Composite Index) – the stock market index of Philippine Stock Exchange which consists of top 30 listed companies based on market capitalization
Industry Index – the index of a group of companies which are classified based on their business activities (i.e. Financial, Holdings, Industries, Mining & Oil, Properties, Services)
Bullish – used to describe a particular stock market or stock when its value is going up
Bearish – used to describe a particular stock market or stock when its value is going down
Initial Public Offering (IPO) – when firms are selling their company shares for the first time in the public to raise capital
Market Value – the value at which a stock can be sold in the market at a specific point in time
Unrealized P/L – profits or losses which have not yet been converted to cash because the investor has not sold the stock
Buying Power – the available money an investor has in his account for buying stocks
Buy Order – a request made by an investor when he or she wants to buy stocks
Sell Order – a request made by an investor when he or she wants to sell stocks
Volume – number of shares bought and sold in a particular day
Bid – the prices at which the buyers want to buy a particular stock
Ask – the prices at which the sellers want to sell a particular stock
Bid-Ask Spread – the price difference between the bid and the ask
Trade – made when the bid and ask price have matched
Brokers – firms or individuals who are licensed to execute the buy and sell orders in exchange for a commission fee
Portfolio – a group of financial assets such as stocks held by the investor
Average Cost/Price – the total price at which you bought a group of shares plus the commission fees, divided by the total number of shares
Shares – units of capitalization that represent part-ownership of a company (i.e. buying 1 share means you contributed capital to the company and therefore own an equivalent portion of it)
Board Lot – the standardized minimum and multiple number of shares to be traded for a particular stock, depends per price range
Cash Dividends – dividends given in the form of cash
Stock Dividends – dividends given in the form of additional shares
Profits/Gains – the amount that an investor earns when he sells stocks at a price higher than his average costs
Losses – the amount that an investor loses in his capital when he sells stocks at price lower than his average costs
Stock Split – when a company divides its shares according to a particular ratio, increasing the number of shares and lowering the price of each share (i.e. 1 share becomes 2 shares)
Reverse Stock Split – the opposite of stock split, when a company decides to combine its shares in a particular ratio to decrease number of shares and increase price (i.e. 2 shares become 1 share)
Most Active – most active stocks in a particular day in terms of volume traded
Top Gainers – list of stocks which had the largest increase in price in a particular day
Worst Losers – list of stocks which had the largest decrease in price in a particular day
Year to Date (YTD) – the period from the beginning of the year (January 1) to present
Investment Strategy – set of rules and behaviors an investor practices towards his investment portfolio
Peso Cost Averaging – an investment strategy where you put the same amount of money into a particular stock in a regular schedule to get a lower average cost
Value Investing – an investment strategy where investors look for undervalued stocks
Growth Investing – an investment strategy where investors look for companies which have a high growth potential
Margin – the equity value an investor has in his account/portfolio
Average Down – buying additional shares of a stock for a price that is lower than your current average cost
Long Position – A “long” or “long position” is the buying of a security such as a stock, commodity or currency with the expectation that the asset will rise in value.
Short Position – A “short”, “short position”, or “short selling” is a trading strategy where the investor sells shares of borrowed stock in the open market. The expectation of the investor is that the price of the stock will decrease over time, at which point the he will purchase the shares to replace those that he initially borrowed.
MARKET STATUSES
Pre-Open Period – trading participants can modify and cancel existing orders or enter new orders
Pre-Open No-Cancel Period – trading participants may enter new orders but may not modify or cancel open orders
Opening Period – opening prices are calculated during this period
Continuous Trading – the period where trading participants’ orders are matched and may enter, cancel, and edit orders
Market Recess – the period where trading-related activities are halted
Pre-Close Period – indicates the last two minutes to open new orders but can’t cancel or modify orders
Run-off Period – trading participants can still enter limit and market orders but matching for both is executed at the closing price of the stock
ORDER TERMS
Stock Order – a request to either buy or sell a stock
Normal Orders – orders which follow the normal board lot
Oddlot Orders – orders which are less than the minimum board lot
Good to Day (GTD) – an option in ordering where your order will expire at the end of trading day when not fulfilled
Good to Week (GTW) – an option in ordering where your order will last for a week
Good to Month (GTM) – an option in ordering where your order will last for a month
Good to Cancel (GTC) – an option in ordering where your order will last until you cancel
ORDER TYPES
Market Order – these are buy and sell orders that transacts the current bid and ask prices
Limit Order – this type of order allows you to set the price you’re willing to buy or sell a stock far from the current prices
Iceberg Orders– allows you to hide a portion of the volume of your order
FUNDAMENTAL ANALYSIS
Fundamental Analysis – a method of stock market analysis that evaluates the economic and financial factors affecting the intrinsic value of a company
Intrinsic Value – the actual and true value of the company based on all aspects of its businesses
Overvalued – when the current price or market value of the stock is higher than its intrinsic value or the average industry price-to-earnings ratio
Undervalued – when the current price or market value of the stock is below its intrinsic value or the average industry price-to-earnings ratio
Income Statement – provides an overview of revenues, expenses and net income
Balance Sheet – provides an overview of assets, liabilities and equity
Statement of Cash Flows – traces the company’s cash movement from operating, investing and financial activities
Financial Ratios – ratios derived from the financial statements of the companies which are used for evaluating the overall condition of its company performance
Price-to-Earnings Ratio (P/E Ratio) – measures the current price of a stock over its company earnings per share, the lower the better
Earnings per Share (EPS) – company earnings for the year divided by the number of shares
Leverage – borrowed capital or loans used to fund company activities
Debt Ratio – the total debt of the company divided by its total assets, the lower the better
Debt-to-Equity Ratio or Leverage Ratio – a company’s debts divided by the value of its equity (based on preferred and common stocks)
Dividend Payout Ratio – the dividends paid divided by the company’s net income
Dividend Yield – the percentage of dividends declared in relation to the stock’s current price
Par Value per Share – the price of the stock during its Initial Public Offering (IPO)
Book Value per Share – the value of the stock in the company’s books (total equity divided by number of shares)
Price to Book Value Ratio – the ratio used to compare company’s current price or market value to its book value, the lower the better
Sector – a subsection in the exchange of companies that share similar characteristics in operation
Sub-sector – a subset of a sector of a group of stocks that have the most similarities in terms of operation
TECHNICAL ANALYSIS
Technical Analysis – a method of stock market analysis that uses past data and statistics to predict future movements in the market
Trend – the general direction of a market, a stock, or the price of an asset based on a chart of its historical value
Uptrend – when price movements consistently reach higher highs and higher lows
Downtrend – when price movements consistently reach lower highs and lower lows
Sideways – when the price of a stock moves in a generally flat manner
Chart – a visual summary of a stock’s prices within a certain period
Open – the first price at which a stock is sold for a particular day
High – the highest price at which a stock is sold for a particular day
Low – the lowest price at which a stock is sold for a particular day
Close – the last price at which a stock is sold for a particular day
Volume – the number of shares that are bought and sold on a particular day
Value Traded – volume multiplied by the price that investors have paid for a stock
Indicators/Oscillators – measurements that investors use to anticipate price movements, momentum, and other behaviors of a particular stock or market
Support – a price level at which, historically, a stock has had difficulty falling below
Resistance – a price level which historically, a stock has had difficulty breaking above
Breakdown – a situation where the price falls below the support level
Breakout – a situation where the price rises above the resistance level
Reversal – the change of a price level from resistance/support to support/resistance after a breakout/breakdown
Cut Loss/Stop Loss – realizing or actualizing your loss by selling the stock to save you from a bigger loss
Bottom-Picking– the act of buying a stock with the anticipation that it has bottomed out from its downtrend
Divergence – this happens when a technical indicator and price action are headed into opposite directions
Bullish Divergence – a signal that indicates an impending upward move
Bullish Signal – signal that is given by a technical indicator that indicates a possible bullish move
Bearish Divergence – a signal that indicates an impending downward move
Bearish Signal – a signal that is given by a technical indicator that indicates a possible bearish move
Volatility– the proportion or rate wherein the price of a stock is increasing or decreasing
Confluence – this occurs when multiple indicators or strategies share the same sentiment/bias
Insider Trading – this is done by someone who has non-disclosed, nonpublic information about a company and trades its shares based on it
Rally – a period of continuous surges, whether downward or upward, in price
Parabolic Move – an upward movement in price where it moves in the manner of a parabola
Oversold – a reading made by a technical indicator that indicates that it’s below its period’s “true” value
Overbought – a reading made by a technical indicator that indicates that it’s above its period’s “true” value
Momentum – the rate of the acceleration of a stock’s price
Momentum Trading – the method of buying a stock while there’s buying pressure from other investors or traders
Range Trading – a strategy where a trader buys at support and sells at resistance during a sideways movement
Target Price (TP) – the price point where you plan to sell a position
Time Stop – a way to sell a stock when it isn’t moving within your bias in a specified time
Trail Stop – an amount below the current trading price of a stock that you plan to sell it for a profit
Tranche Buying – the action of buying a stock in portions
Tranche Selling – the action of selling a stock in portions
Subscribe to InvestaDaily for more investing tips and stock market advice, or sign up for Investagrams to access special features to help you reach your first million.
In my opinion, he is someone who can confidently grow his investment portfolio through realistic means and without much stress. This confidence enables him to do what really matters to him as money is not the main objective of what he does. A happy and effective investor epitomizes “true financial freedom” because he knows that he can rely on the returns of his investment portfolio when he retires.
Contrary to popular belief, a happy and effective investor does not need to have a degree in finance or be an analyst (like me) or a stock broker. He just needs to have certain habits that are easy to adopt.
In this article, I’ll be sharing what I believe are some of the essential habits of happy and effective investors.
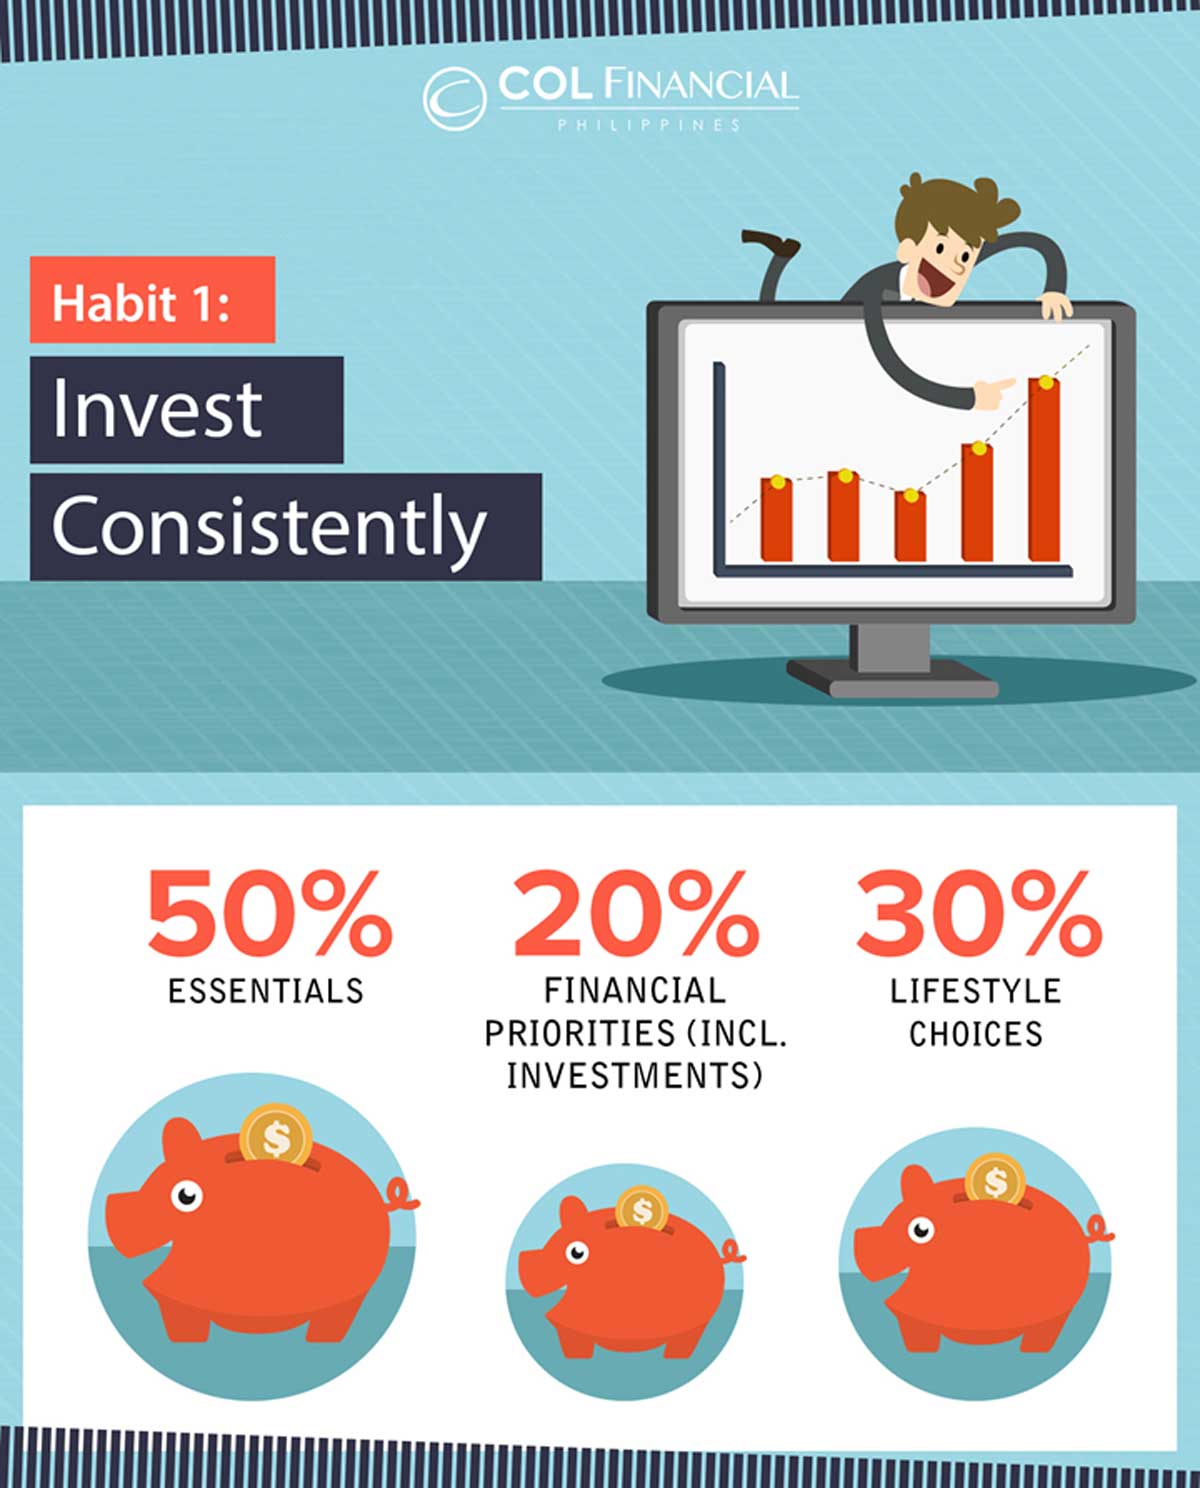
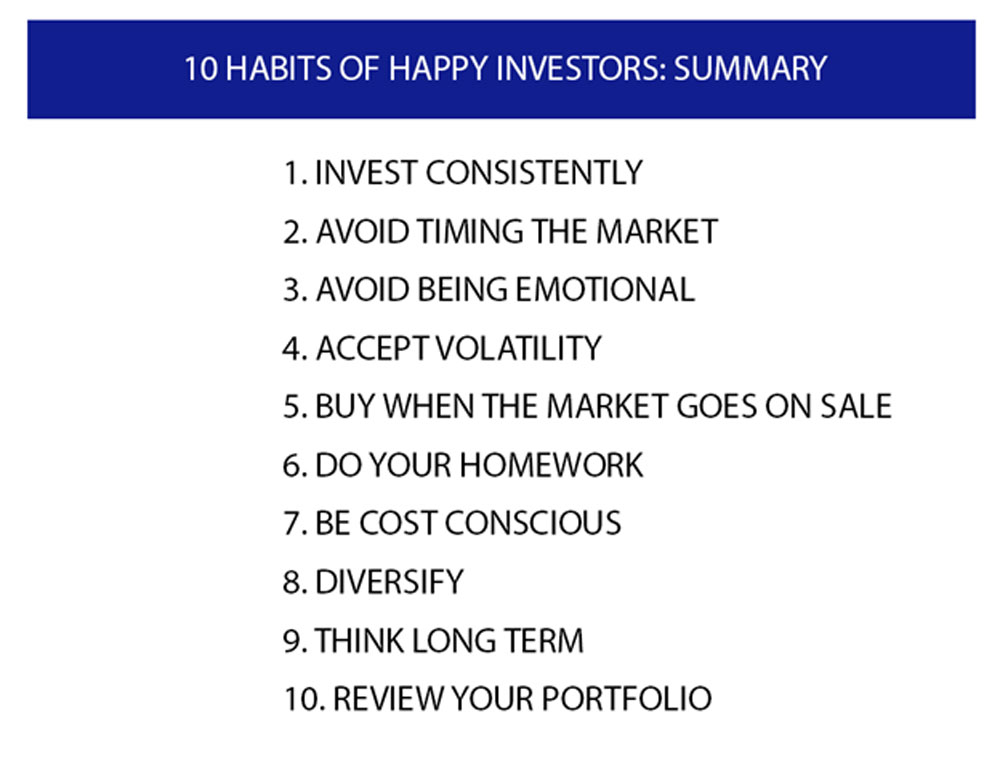
HABIT 1: INVEST CONSISTENTLY
A lot of people don’t invest because they think that getting a high paying job is enough to guarantee financial freedom. Ironically though, having a high paying job is not enough to guarantee financial freedom. If it were so, why are numerous highly paid celebrities and athletes bankrupt a few years after retirement? Moreover, according to a study by LIMRA on “when 25 year olds today reach 60”, a vast majority will be broke (63%), while 5% will still need to work. Only 1% will be wealthy and 4% will be financially independent.
Although getting a job that pays well is important, it is also equally important to invest consistently to become a happy and effective investor.
How much should you set aside? The 50-20-30 rule stipulates that you should consistently set aside 20% of what you earn on financial priorities which include investments. When you get a bonus, strive to set aside 50%for investments.
Resist the temptation to buy things that you want but don’t really need. Just remember that when you choose investments over your wants, your investments will eventually allow you to buy what you want. Every year, my husband and I set aside a certain amount for my children’s investment accounts because we believe giving gifts that keep on giving.
While investing consistently can be difficult like sticking to a diet or an exercise plan, you can do something to help you stay the course. For example, you can schedule an automatic fund transfer out of your payroll account equivalent to 20% of your salary every payday that will go towards the purchase of mutual funds or UITFs. COL Financial already has a function that allows automatic monthly investing of stocks and mutual funds.
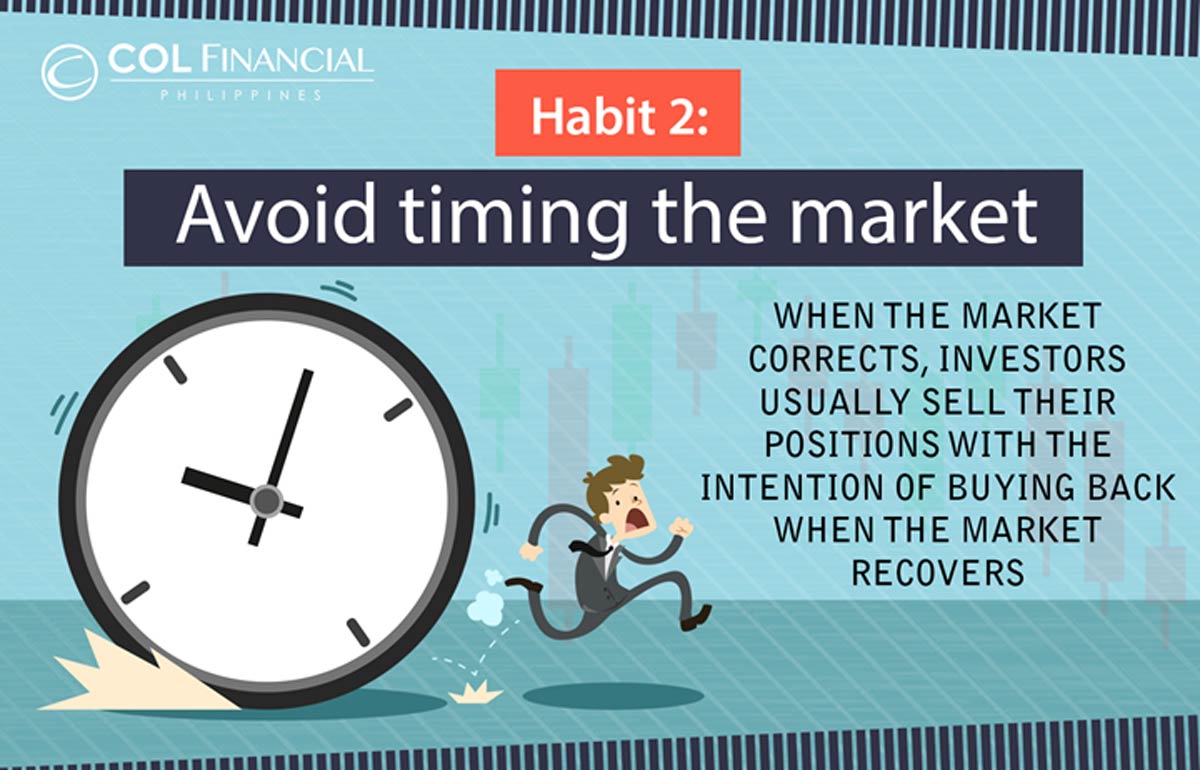
HABIT 2: AVOID TIMING THE MARKET
When the market corrects,investors usually sell their positions with the intention of buying back when the market recovers. Intuitively, this should be a more profitable strategy as investors avoid big draw downs in the value of their portfolios.
However, studies show that timing the market is a very dangerous habit. According to a study conducted by Davis Advisors (using Bloomberg data), investors who just stayed invested in the S&P 500 from 1994 to 2013 would have generated an annual return of 9.5%. On the other hand, investors who had missed the 10 best days of the market during the same period would have seen their returns diminish to only 5.5% annually,while those who had missed the best 60 days would have generated a loss.
The same holds true for the Philippine stock market. In fact, market timers are hurt even more significantly given the greater volatility of local stocks. While investors who just stayed invested in the PSEi from 1996 to 2016 would have generated an annual return of 9.4%, those who had only missed the 10 best days would have already generated a loss of 0.4%!
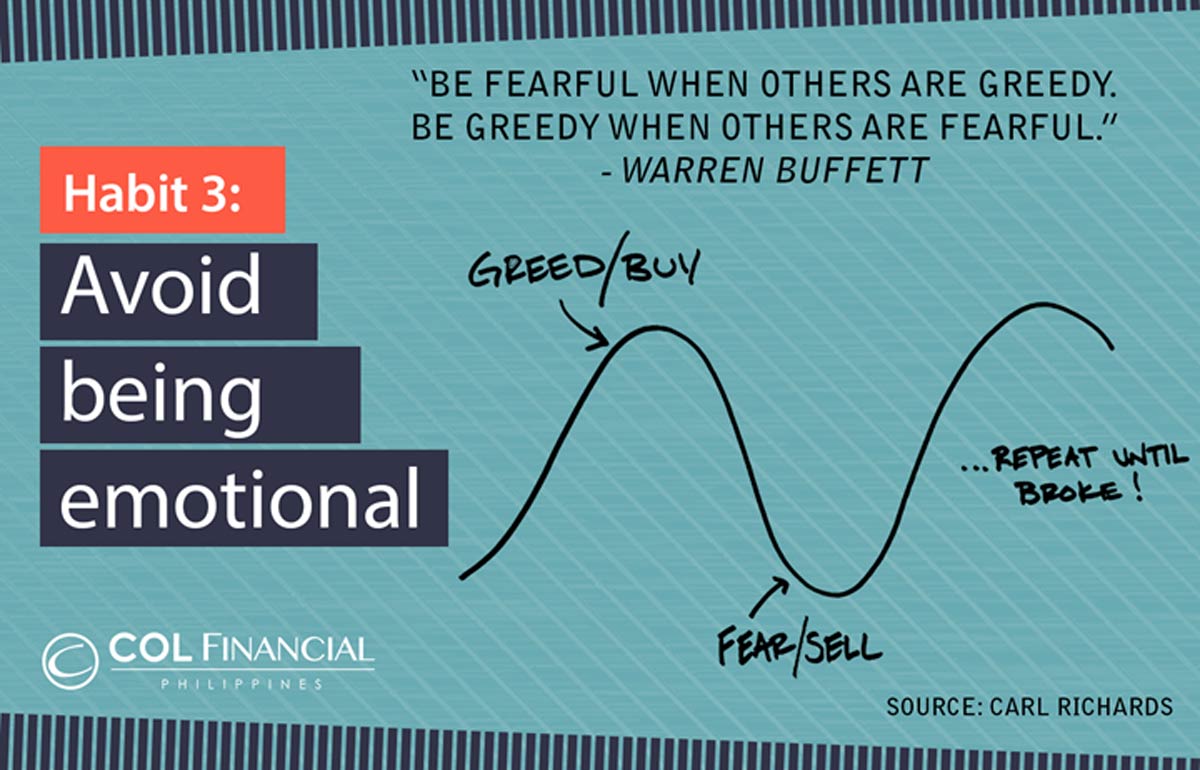
HABIT 3: AVOID BEING EMOTIONAL
Investing in the stock market can be a very exhilarating exercise which is why many investors choose to trade actively instead of sticking to an investment plan that simply involves buying funds and some individual stocks on a regular basis. After all, a lucky investor who makes the right bet could more than double his money in a short span of time. For example, earlier this year, MAC was trading at less than Php3.00/share. Now it’s worth almost three times more at Php8.50/share! Assuming that you were the lucky investor who bought MAC earlier this year, you would be much richer today! People might also say that you are a genius for spotting MAC at such a good price making you feel proud of your achievement.
Most of the time though, investors are unlucky. According to a study by Dalbar and Lipper, the average stock fund investor returns from 1994 to 2013 is only 5.0%, trailing behind the average stock fund return of 8.4%. This is because investors typically buy at the top and sell at the low as they are overcome by greed and fear. This is why Warren Buffett said to “Be fearful when others are greedy and greedy when others are fearful.”
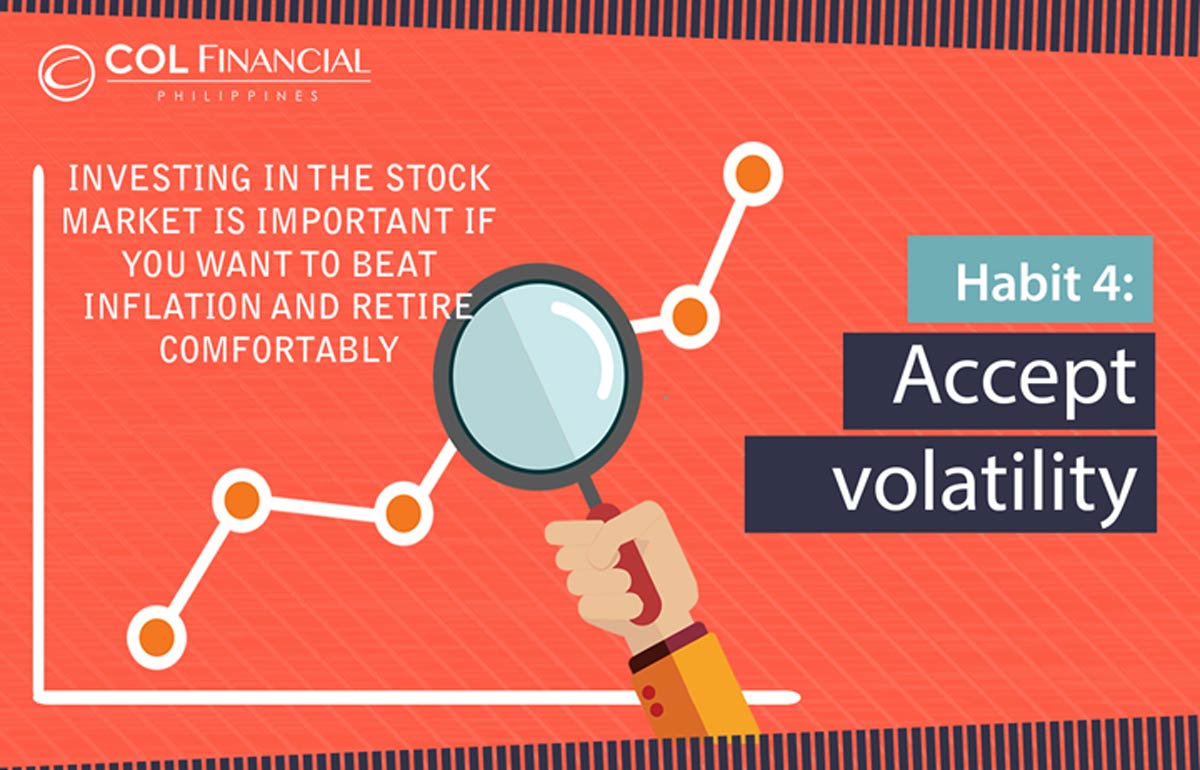
HABIT 4: ACCEPT VOLATILITY
Investing a certain portion of your portfolio in the stock market is important if you want to beat inflation and retire comfortably. However, a lot of people avoid investing in the stock market because of volatility. Unlike bank deposits, returns of stocks are very volatile. Even worse, they can go down in value and there are always many reasons why the market can go down in value (Examples: election of Trump as U.S. president, the declaration of martial law in Mindanao, Fed rate hike).
Although stocks are volatile, they also generate significantly higher returns compared to bank deposits. Moreover, the market goes up more frequently than down. For example, during the last 29 years, the market was up 20 years while it was down only 9 years. Total return during the said period was also substantial at 795%, significantly beating returns of bank deposits!
HABIT 5: BUY WHEN THE MARKET GOES ON SALE
January and July are my favorite times to go shopping since shops have their semi-annual sales. Like me, most people get excited to go shopping when stores go on sale.
However, the opposite is true when the stock market goes on sale. Instead of buying stocks, typical investors avoid the stock market, worrying that there must be something wrong.
In contrast, the happy and effective investor gets excited when the market goes on sale. He understands that buying when the market goes on sale allows him to generate even higher returns as history has shown that markets eventually recover after falling substantially in reaction to negative developments such as the Asian Financial Crisis and the Global Financial Crisis.
HABIT 6: DO YOUR HOMEWORK
People normally rely on tips when choosing which stocks to buy.
However, a happy and effective investor understands that to pick the right stock, he needs to do his homework. He knows that for share prices to remain in an uptrend, profits also have to be rising. This is based on the logic that profitable businesses are worth more. After all, who would want to buy a business that is losing money? He tries to understand what drives companies’ earnings, and determines whether these drivers are currently favorable for the company.
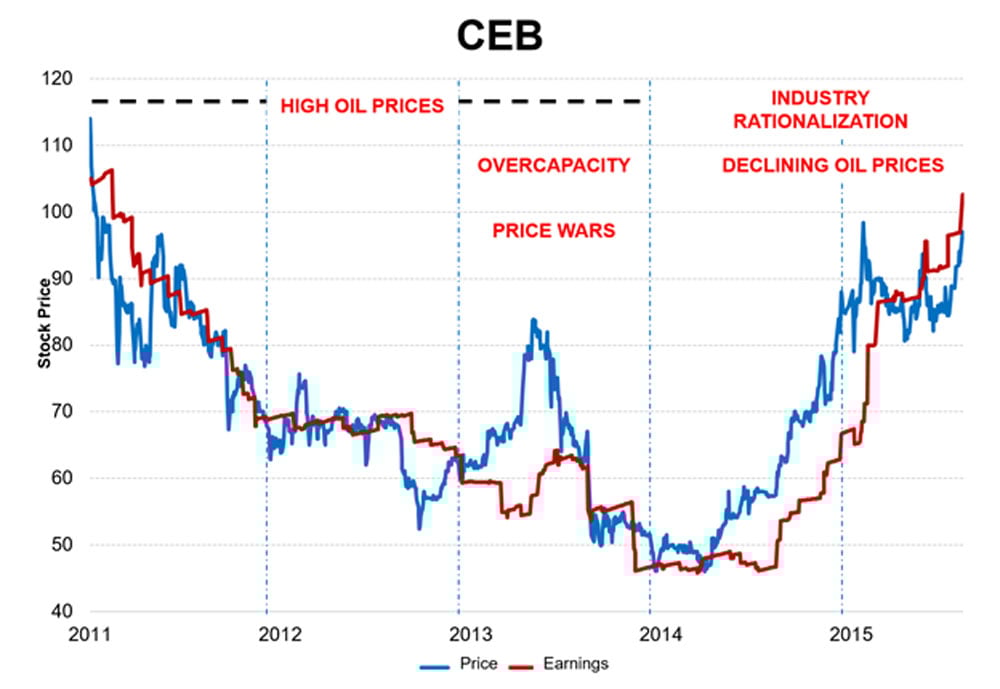
For example, from 2011 to 2013, CEB’s share price was on a downtrend because the price of oil was rising and oil is one of CEB’s major costs. At the same time, the airline industry was suffering from overcapacity as the growing popularity of low cost carriers encouraged new players to come in. This led to price wars that negatively affected CEB’s profitability.
However, towards the second half of 2014, oil prices started to fall. The industry also consolidated as airlines that were losing money either closed shop or were bought out by the bigger players. The said factors led to the rebound of CEB’s profitability and its share price.
Aside from knowing where profits are headed, the happy and effective investor makes sure that he is paying a reasonable price for the stock he is buying. This is measured by the price relative to the amount of earnings that the company is expected to generate or the P/E ratio. The lower the P/E ratio, the better, as this would improve a stock’s return potential.
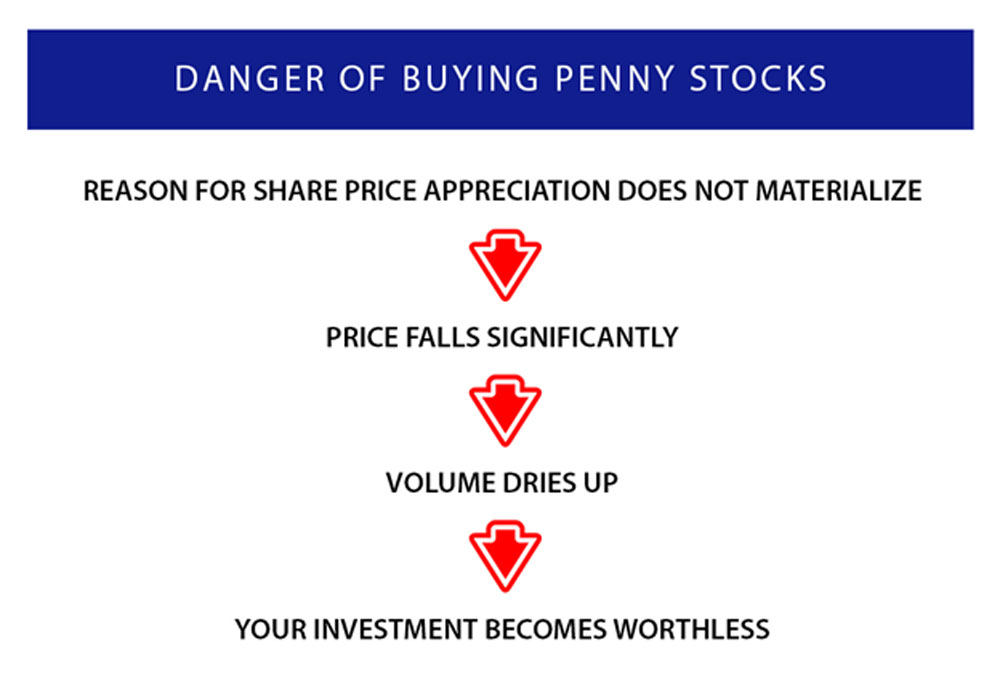
A happy and effective investor avoids buying penny stocks based on tips. He understands the dangers of buying penny stocks, which could lead to his investment becoming worthless.
For example, in 2012, CAL was one of the most popular IPOs as its share price rallied by 219% in 9 days! However, at the peak, CAL was trading at 73.7X P/E which was very expensive considering that the PSEi was trading well below the said level. Moreover, instead of going up, CAL’s profits went down. As a result, share prices fell significantly.
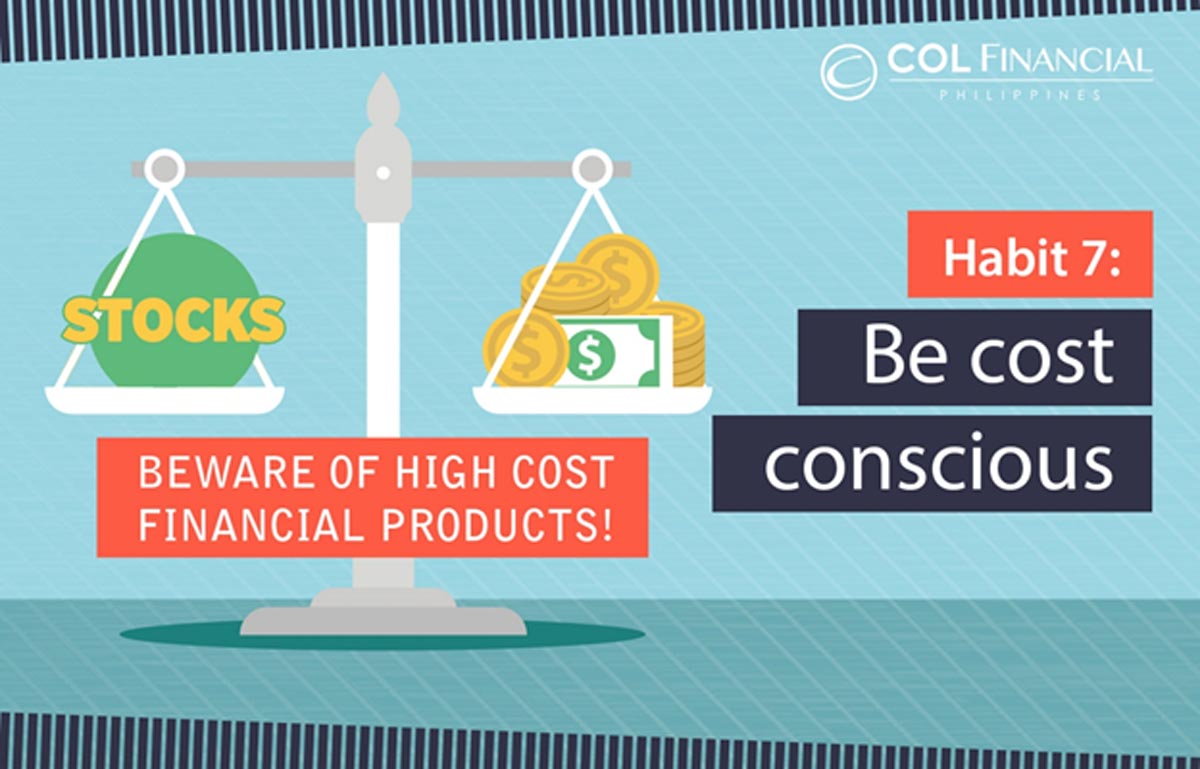
HABIT 7: BE COST CONSCIOUS
The happy and effective investor understands that active trading, while exciting, is very costly. Did you know that the cost of buying and selling a stock (including taxes and commissions) is around 1.1%?
When buying funds, the happy and effective investor also studies fees that are charged by asset management companies. These include front load and back load fees, penalties for early redemption, management fees (0.25% to 2.15%) and other costs (up to 2.25%). Unfortunately, higher fees do not necessarily translate to better performance.
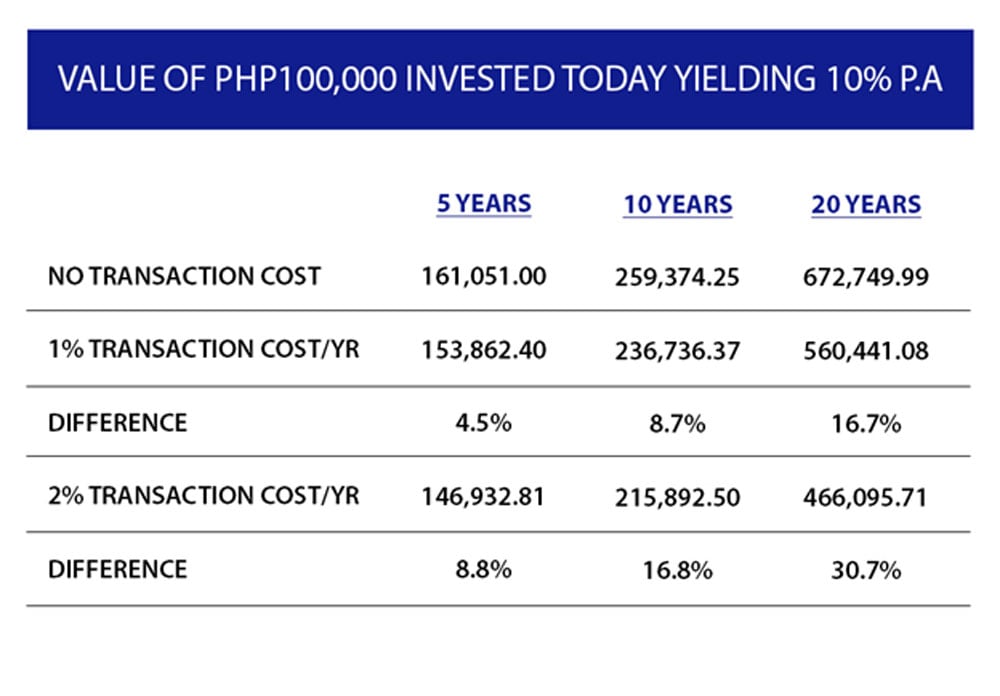
While costs of 1% to 2% may seem small, the slight reduction in portfolio returns spells a big difference when compounded annually over a long period of time. For example, a Php100,000 portfolio that generates a compounded annual return of 10% would be worth Php259,000 in 10 years. This is 8.7% more than a portfolio that generates a compounded annual return of 9.0% (because of a 1% cost annually) and 16.8% more than a portfolio that generates a compounded annual return of 8.0% (because of a 2% cost annually)! The difference increases even more over time as can be observed in the table below.
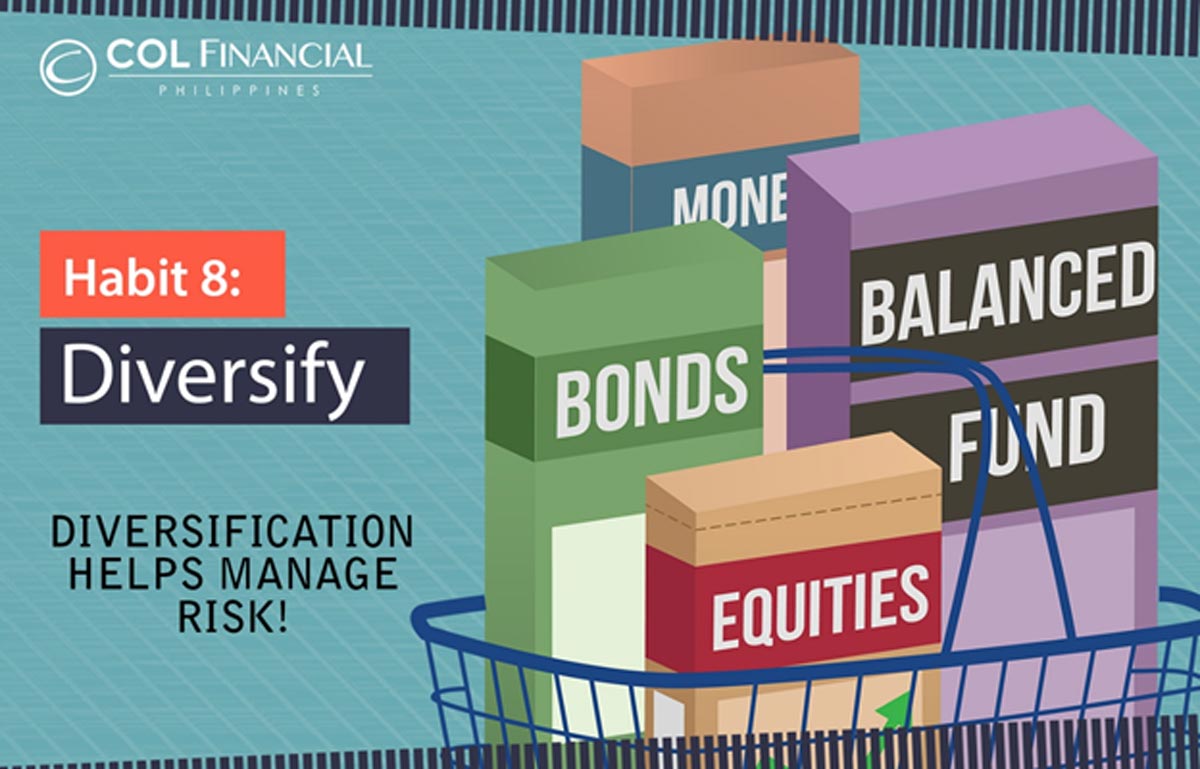
HABIT 8: DIVERSIFY
When I was a teenager, I remember envying classmates who had Sony Walkman. During my teenage years, having a Sony Walkman meant that you were “cool”.
When I had my first baby, I wanted to make sure that all the pictures I took of my baby were perfect. This was why I always bought Kodak film since I didn’t want to leave anything to chance.
However, cassette tapes and film cameras are now obsolete. And if you had only bought shares of Sony and Kodak because of the popularity of the Walkman and film cameras twenty years ago, the performance of your portfolio would be very disappointing.
The happy and effective investor understands that diversification is important to manage risks. Aside from protecting his portfolio from significant volatility resulting from unforeseen incidents (such as obsolescence of products), diversification also helps him manage the cash flow of his investments, so that he will not be forced to sell investments at a bad time.
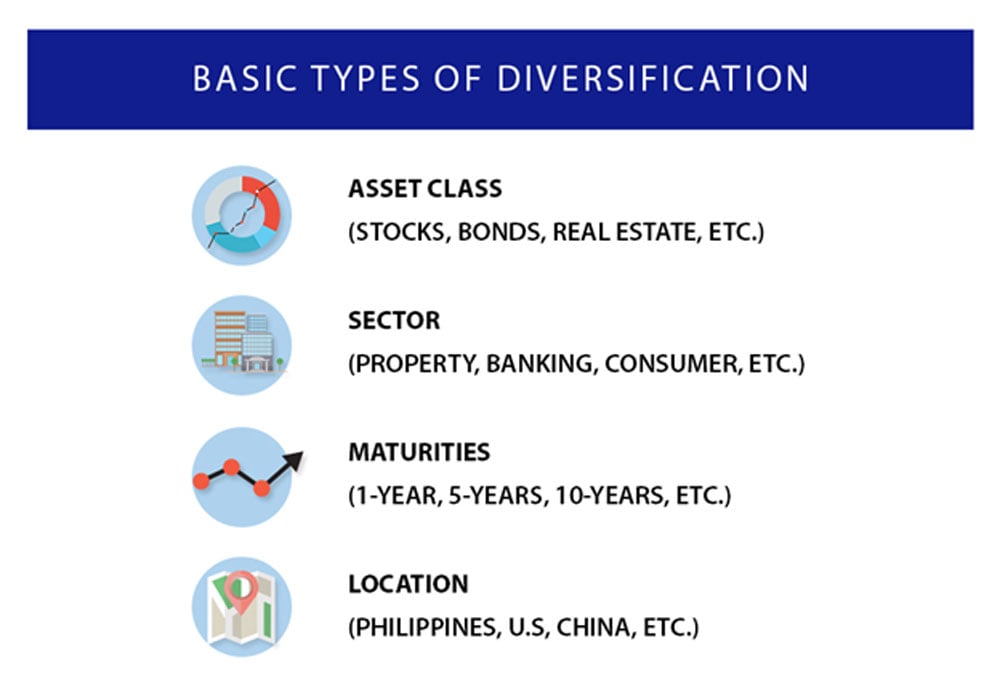
Below are some basic types of diversification.
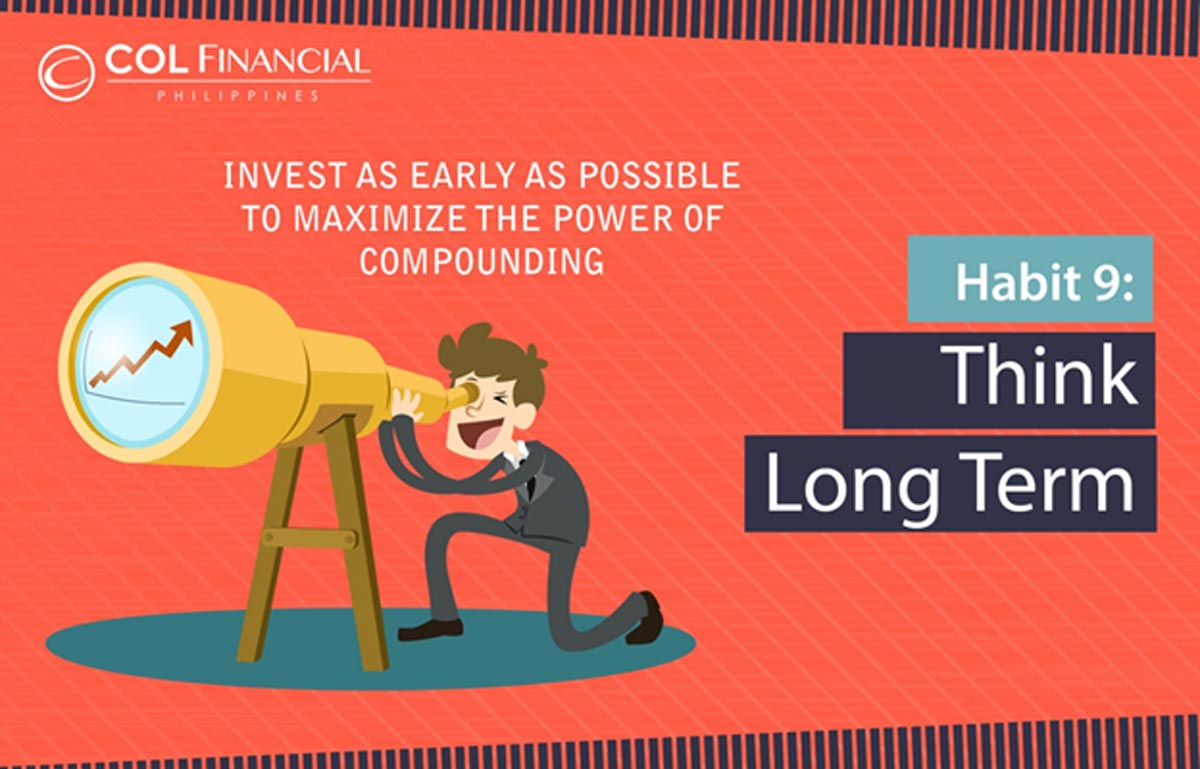
HABIT 9: THINK LONG TERM
The happy and effective investor is a long-term investor. He understands that by investing long term, he is maximizing the power of compounding to grow the value of his portfolio.
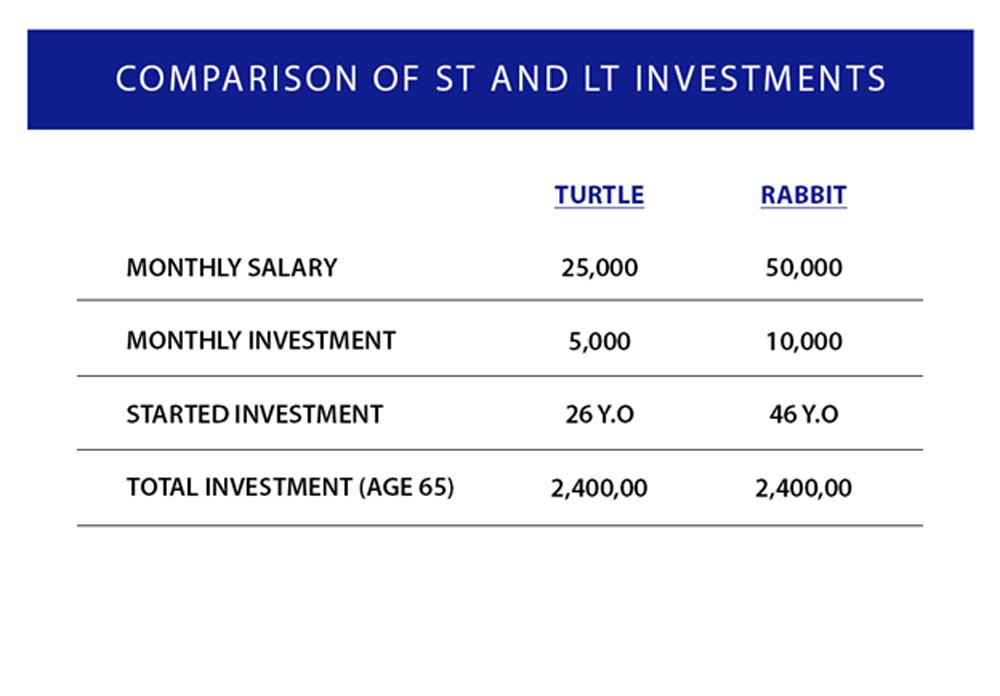
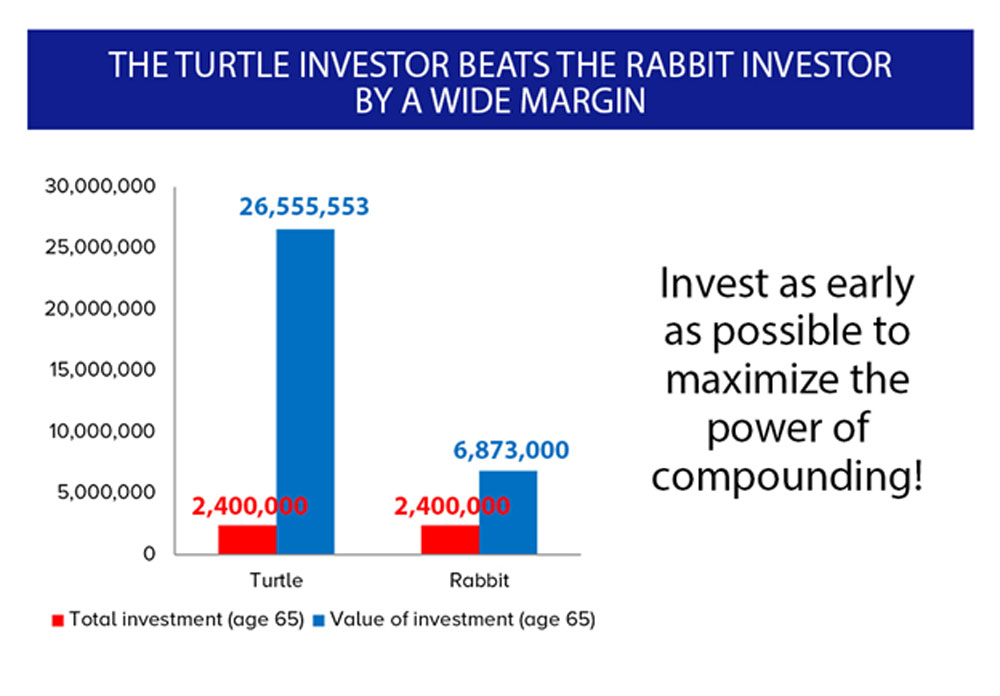
Did you know that by age 65, someone who invested Php5,000 a month starting at the age of 26 will have significantly more than someone who invested Php10,000 a month starting at the age of 46? This is despite the fact that both have set aside the same amount of Php2.4 Mil as investments.
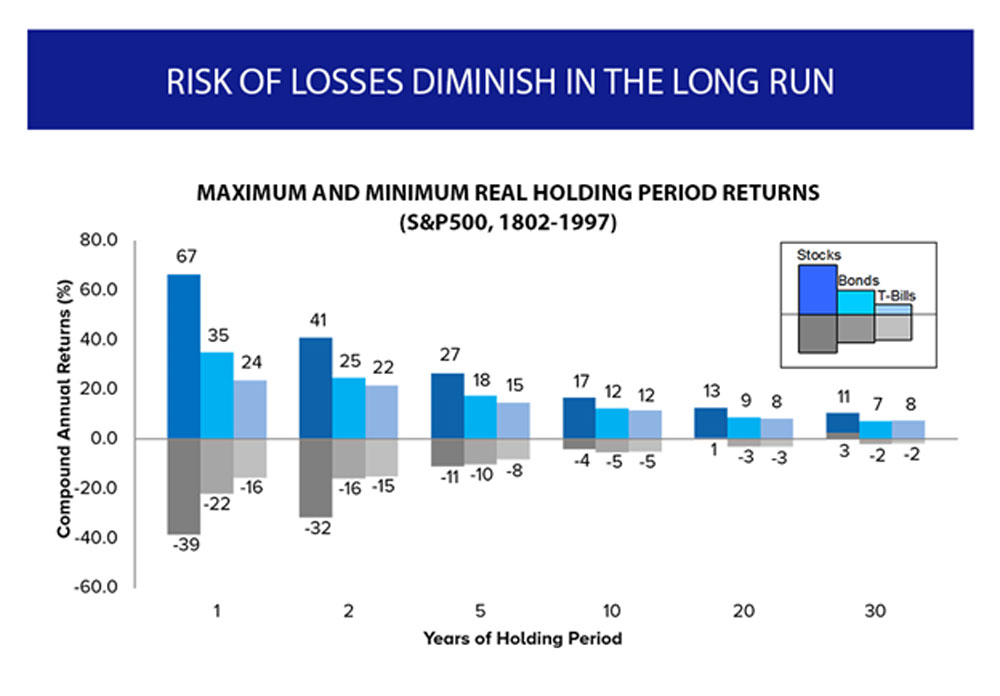
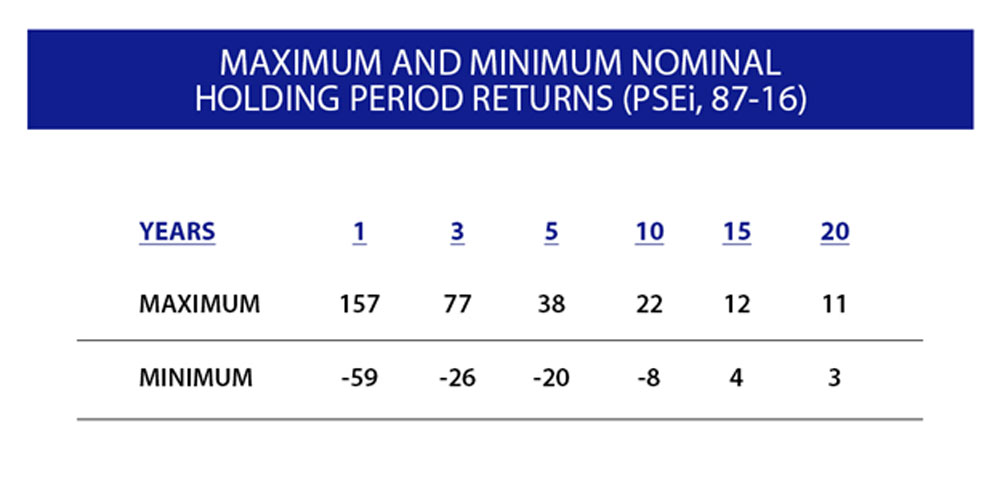
The happy and effective investor also knows that when investing in the stock market, the risk of losses diminishes in the long run. Based on the study of the S&P 500’s performance from 1802-1997, it was impossible for an investor to register a loss assuming that he had a investment time horizon of at least 20 years. The same holds true for the Philippine stock market based on the study of the PSEi’s performance from 1987-2016.
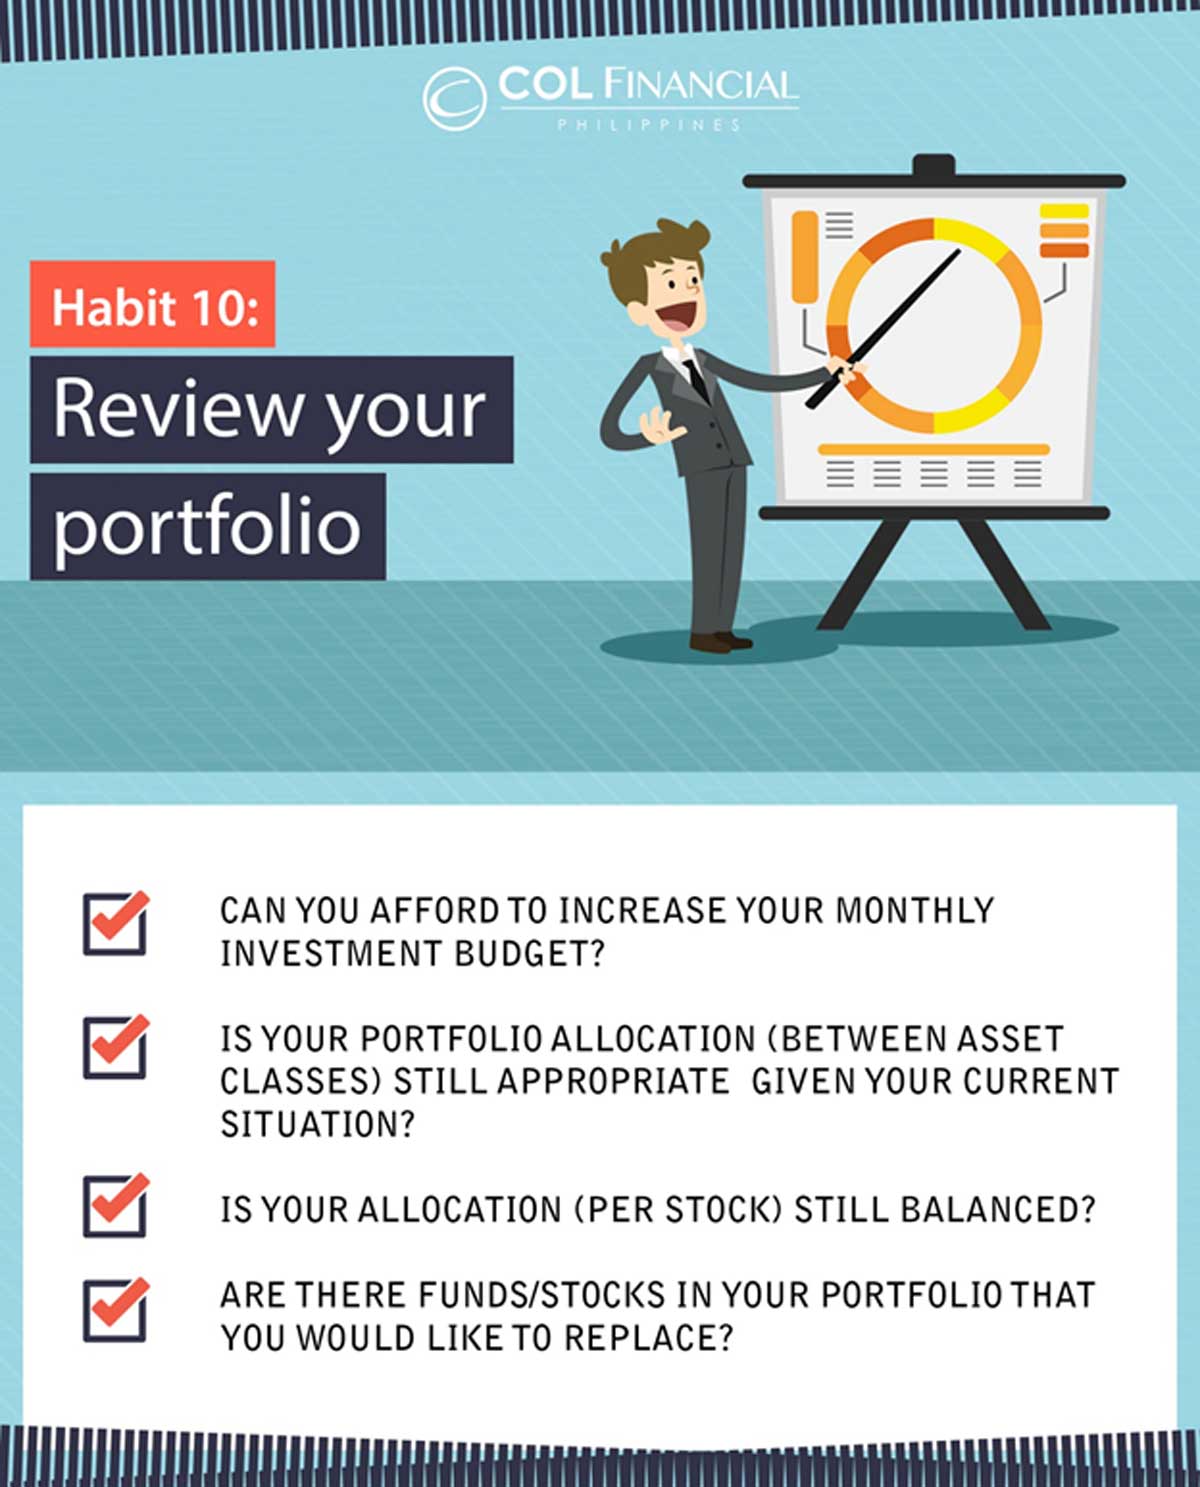
HABIT 10: REVIEW YOUR PORTFOLIO
A happy and effective investor diligently reviews his portfolio on an annual basis. He determines whether he can increase the amount of money that he sets aside as investments. For example, did he get a pay increase or a big bonus that will allow him to invest more?
He also checks whether his portfolio allocation between different asset classes (such as stocks or bonds) is still appropriate given his current situation. For example, will he have a major expenditure soon that will require him to reduce his equity exposure?
He also tries to see whether he still likes to keep the individual stocks in his portfolio and whether his allocation to the different issues is still balanced or acceptable. Have fundamentals changed? Or is the stock now too expensive, making it a good time to lock in gains?
In summary, here are the 10 habits of happy and effective investors. I hope that you can adopt these habits so that you can become a happy and effective investor.
Subscribe to InvestaDaily for more articles like these, or sign up for Investagrams to access special features to help you reach your first million!