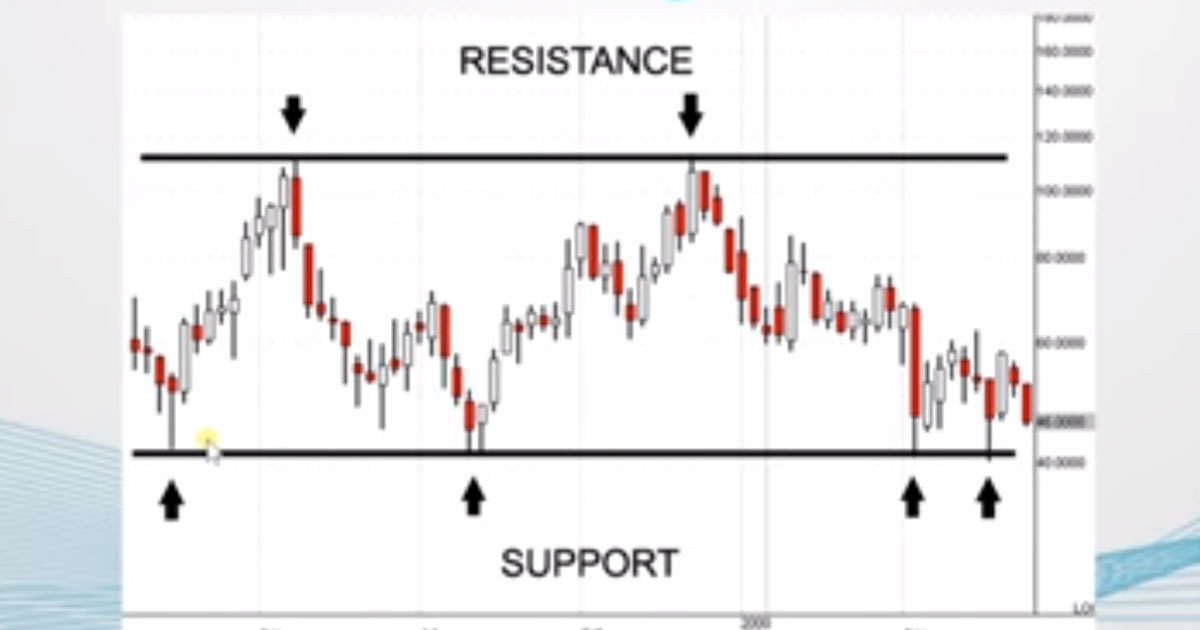
In our first video, we taught you the basics of how to read stock charts. We explained candlesticks, trend lines, and support and resistance.
Now, we’ll dive deeper into support and resistance—the backbone of all price structure analysis methods in technical analysis.
Watch the video above to learn how mastering support and resistance can make you a more profitable trader. We’ll also teach you about breakouts, breakdowns, and role reversals—when resistance becomes support or support becomes resistance. This will help you predict the best time to buy and sell.
This video is in a mixture of Filipino and English.
Subscribe to InvestaDaily for more investing tips and stock market advice, or sign up for Investagrams to access special features to help you reach your first million.
