Amidst the Stock Market crash across the globe last March of 2020, novice traders have turned a blind eye in the markets since then. It somehow makes sense. The pandemic has caused tremendous financial damage across the world.
Although, the financial markets, especially the US stock market, started to rise a few days after the market crash of 2020. In the context of measuring the March low and the September high, the $NDX rose 84%, the SPX rose 63.5%, and the DJI rose 61%. Within six months, the stock market presented loads of opportunity to those traders who used the Bottom-up Approach to navigate the markets.
As introduced by Mark Minervini in his book “Trade Like a Stock Market Wizard: How to Achieve Super Performance in Stocks in Any Market, ” the Bottom-up approach is a type of method in selecting a stock. It is where a market participant shifts their focus on individual stocks first, then its respective industry group or sector, then its separate market index.
Through this approach, the index and any adverse event do not discourage the market participant from trading. If you have applied this method during the April recovery, then the said trader would have maximized the US market’s up move.
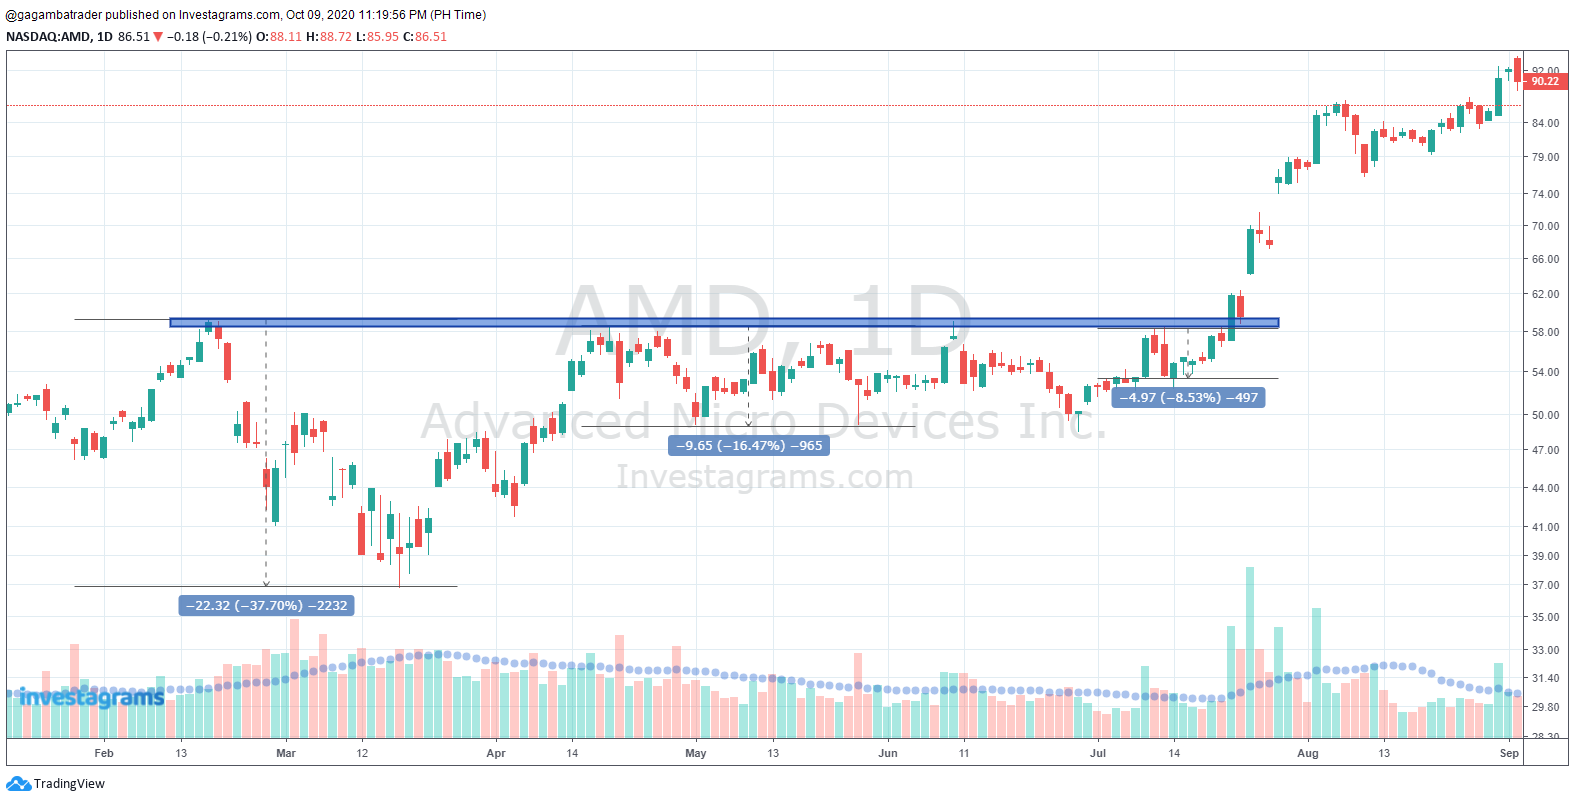

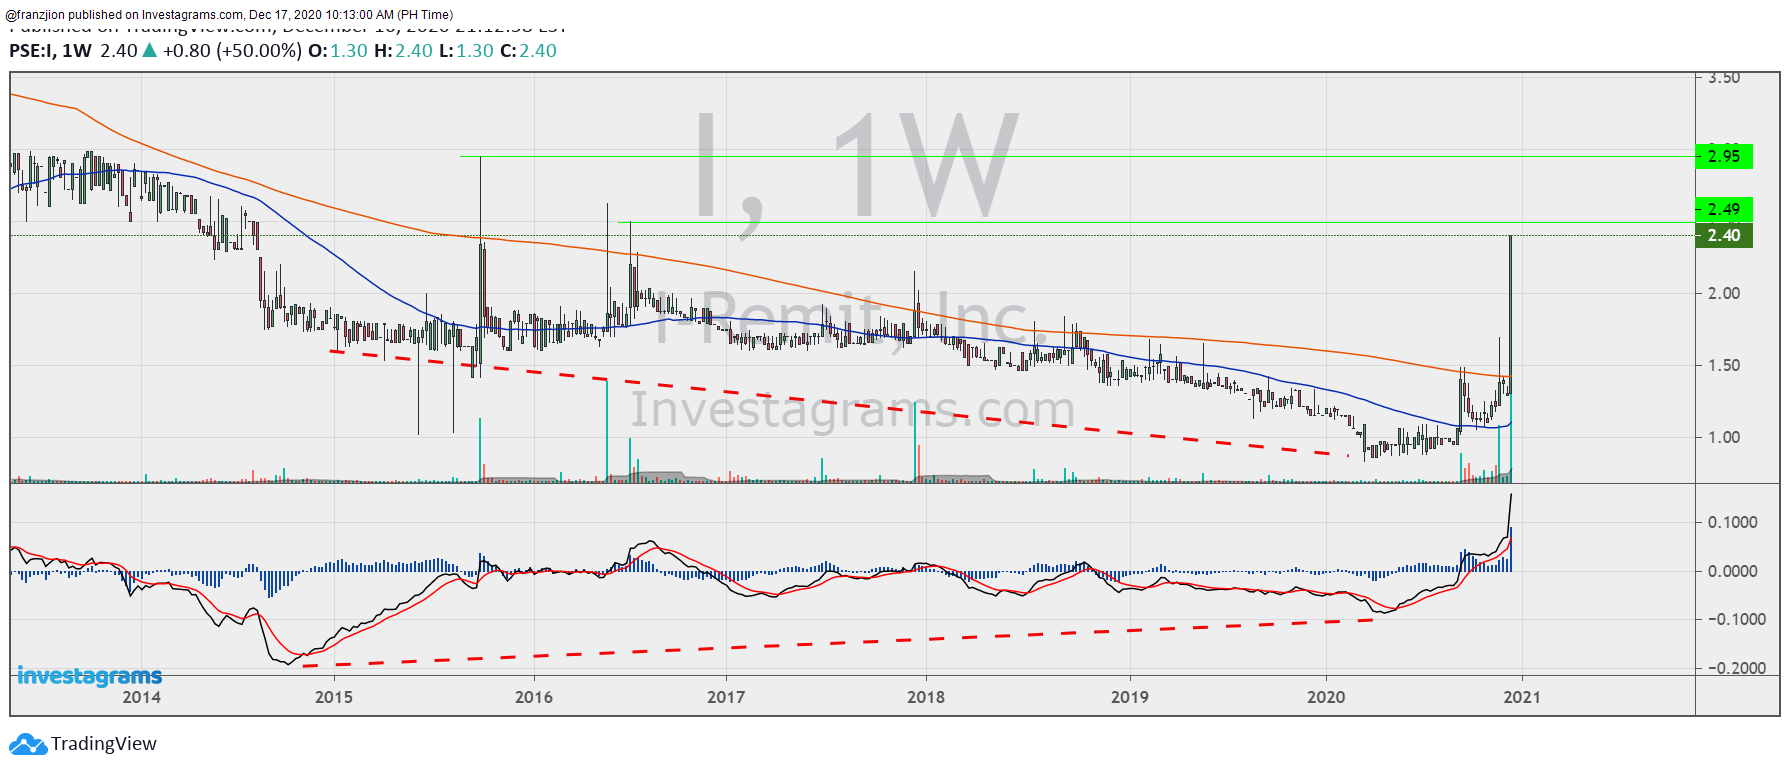
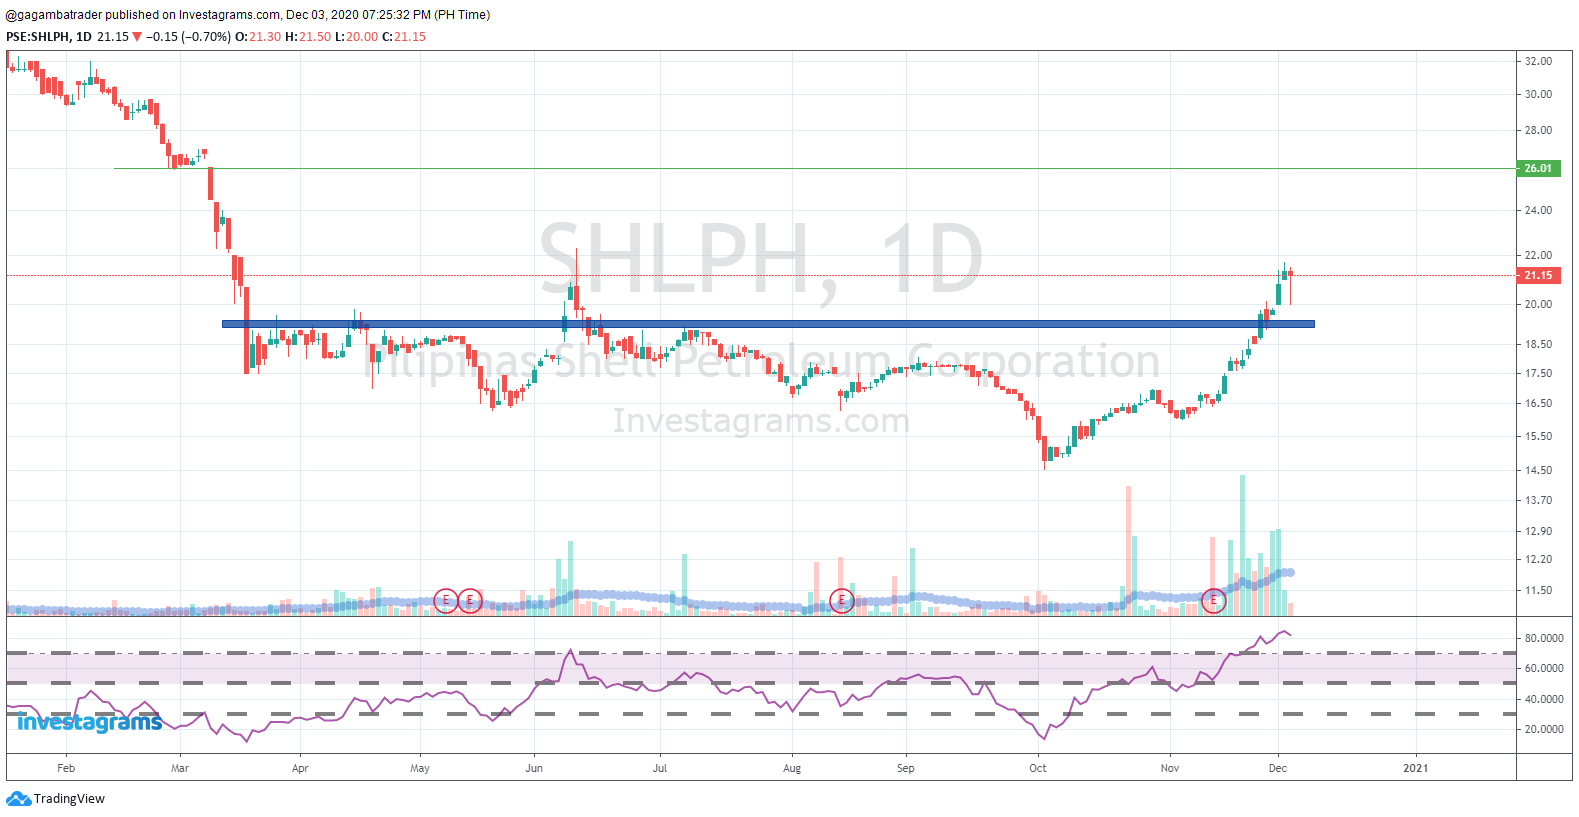
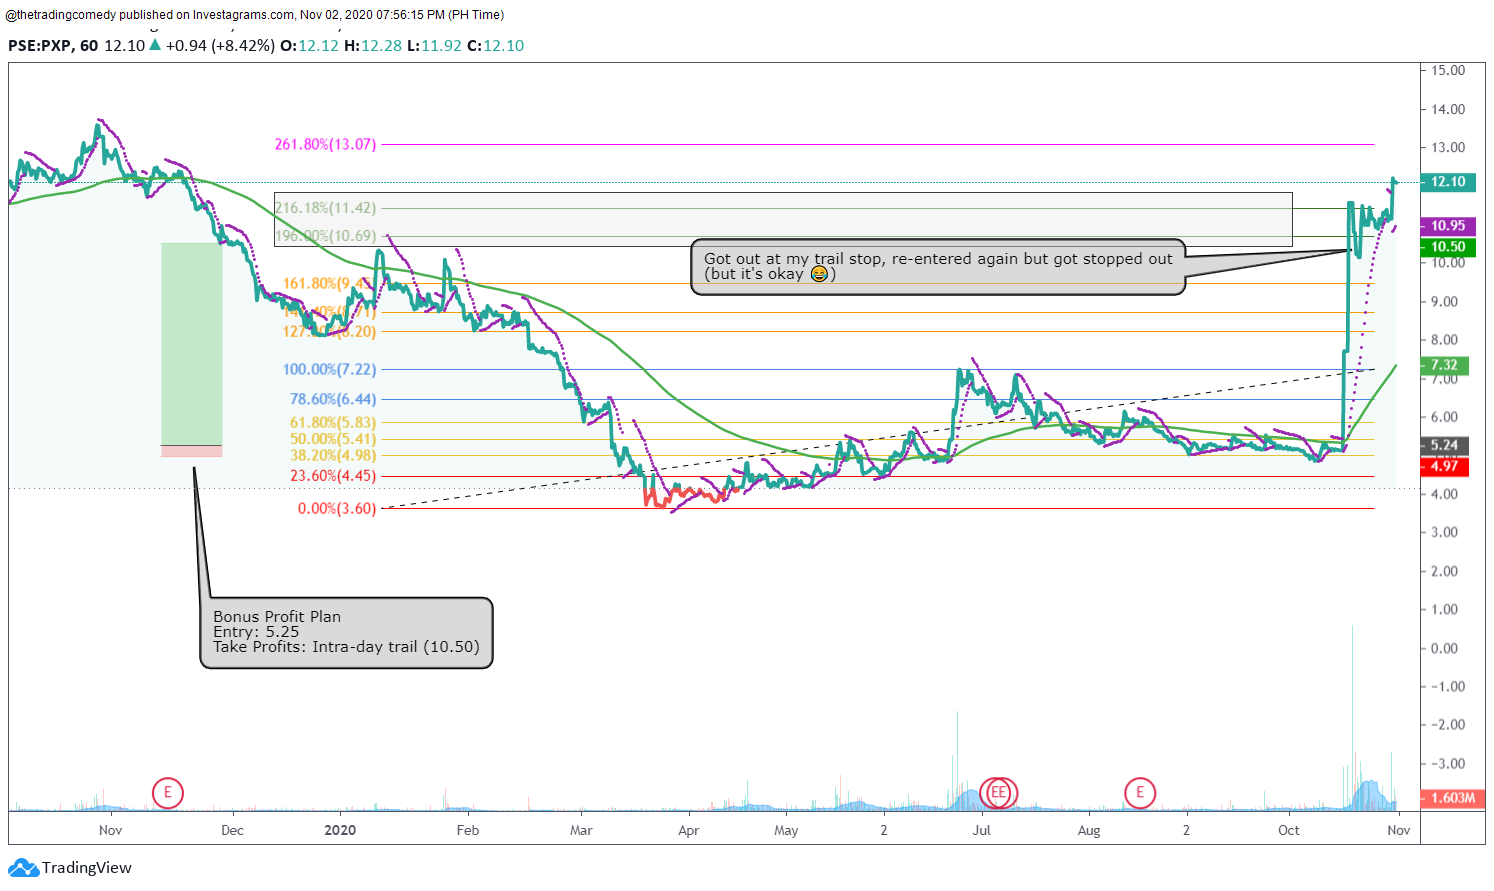
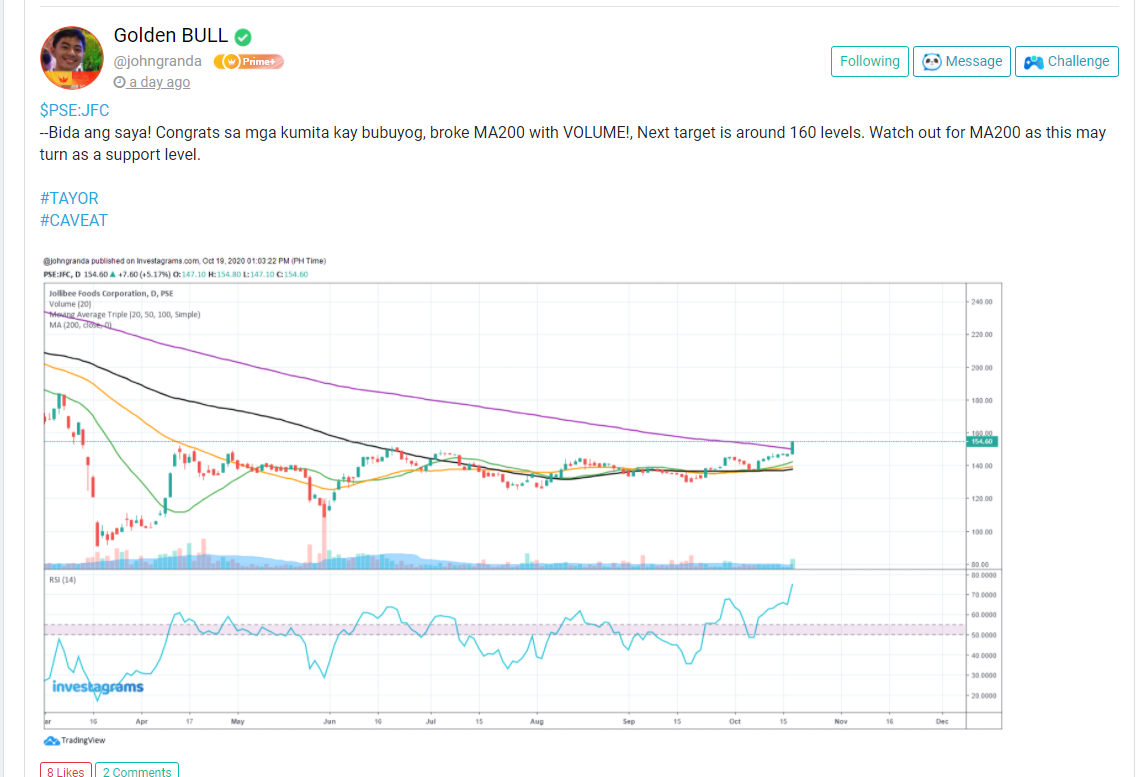
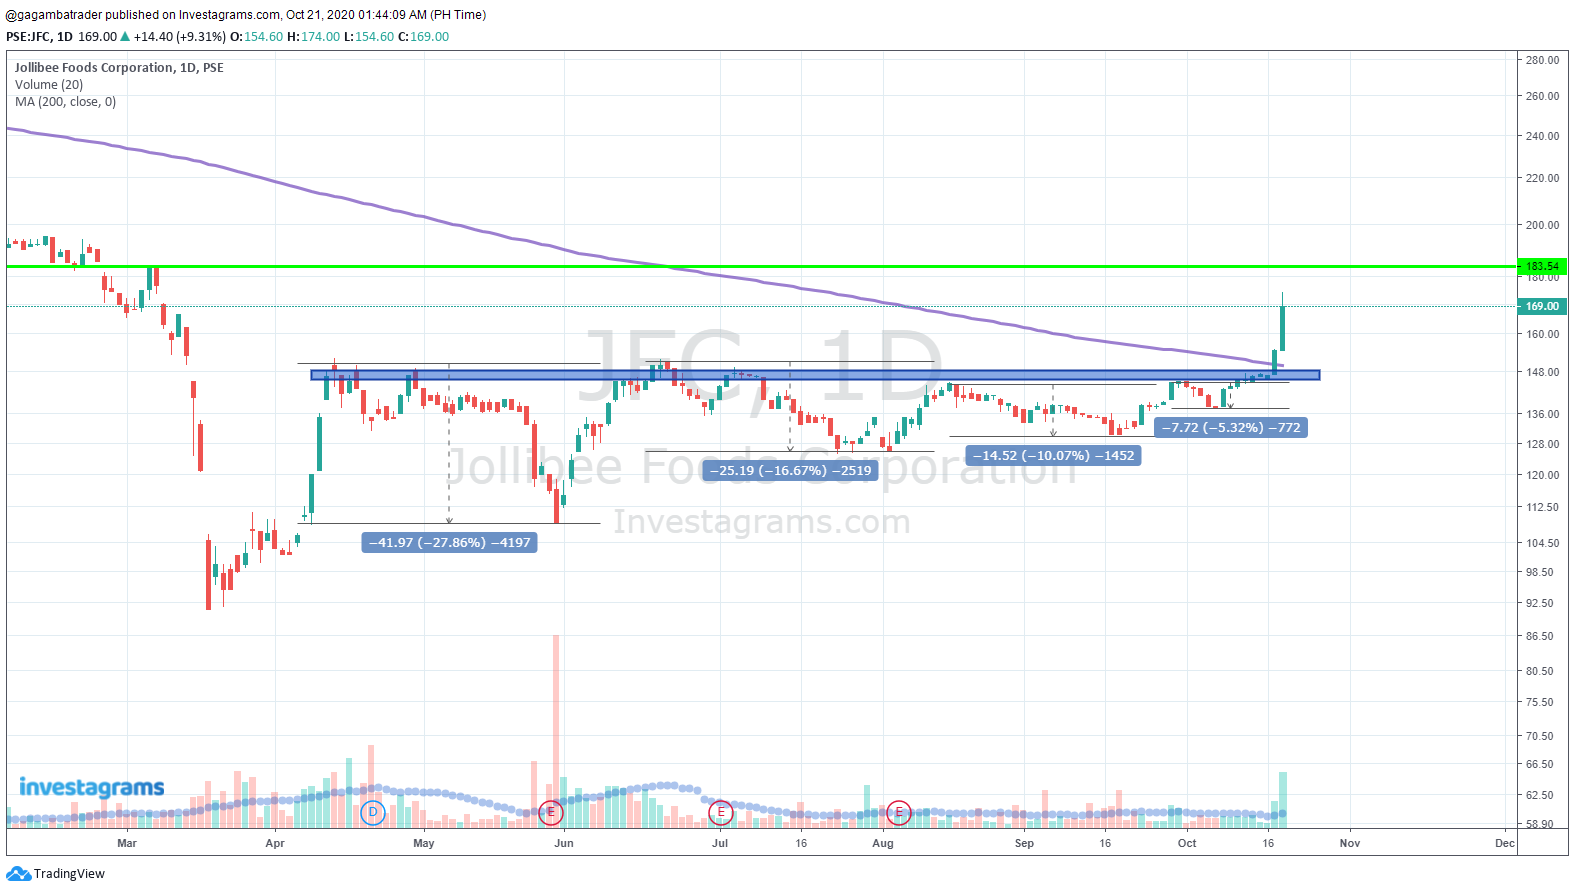
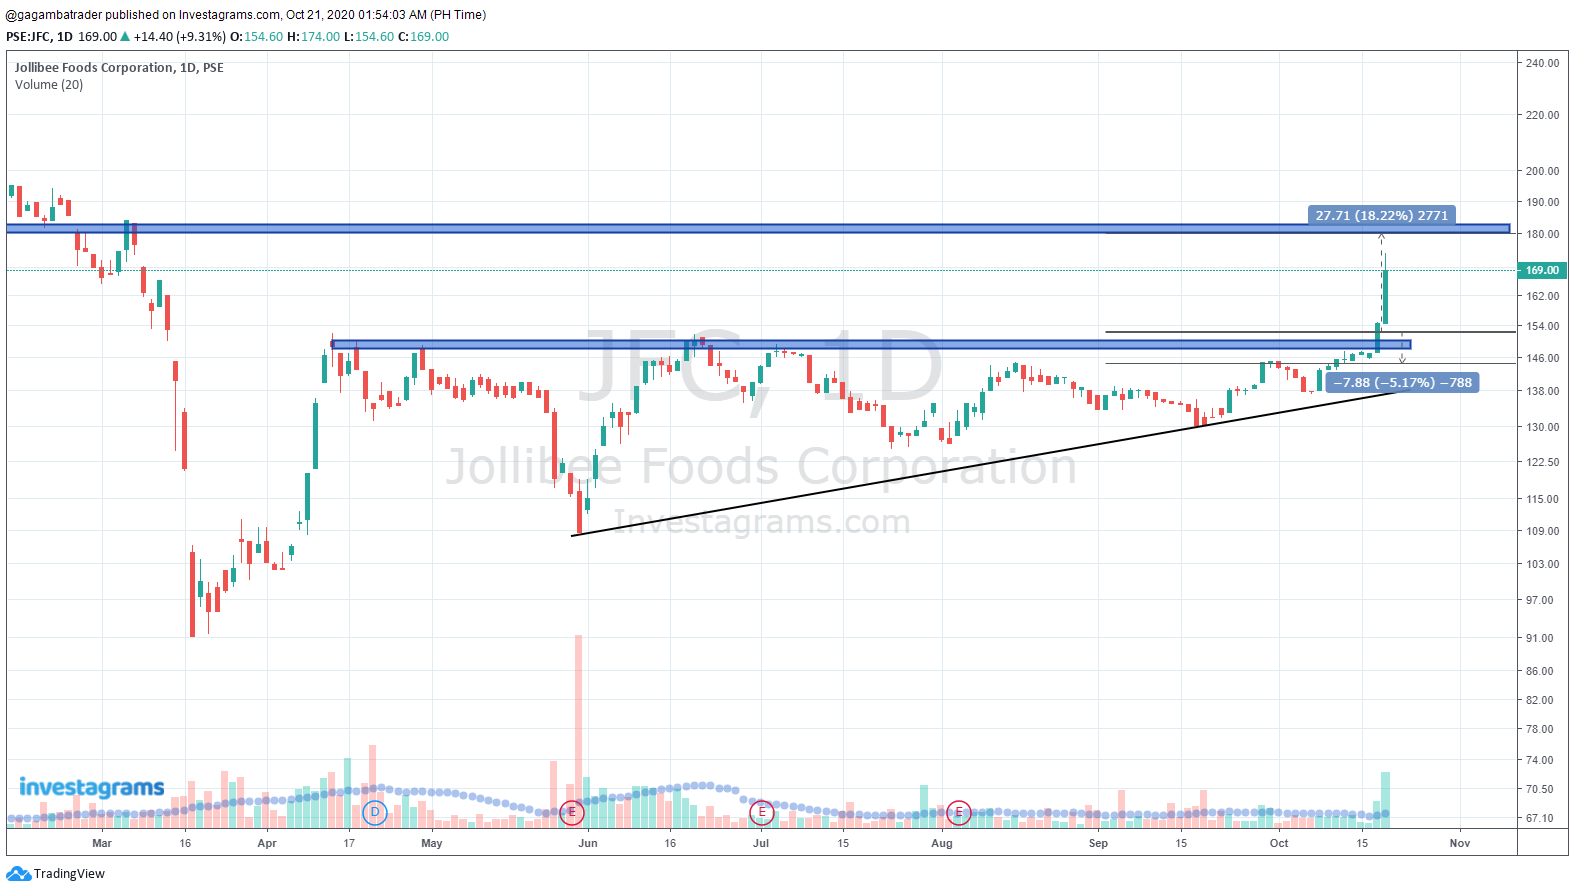
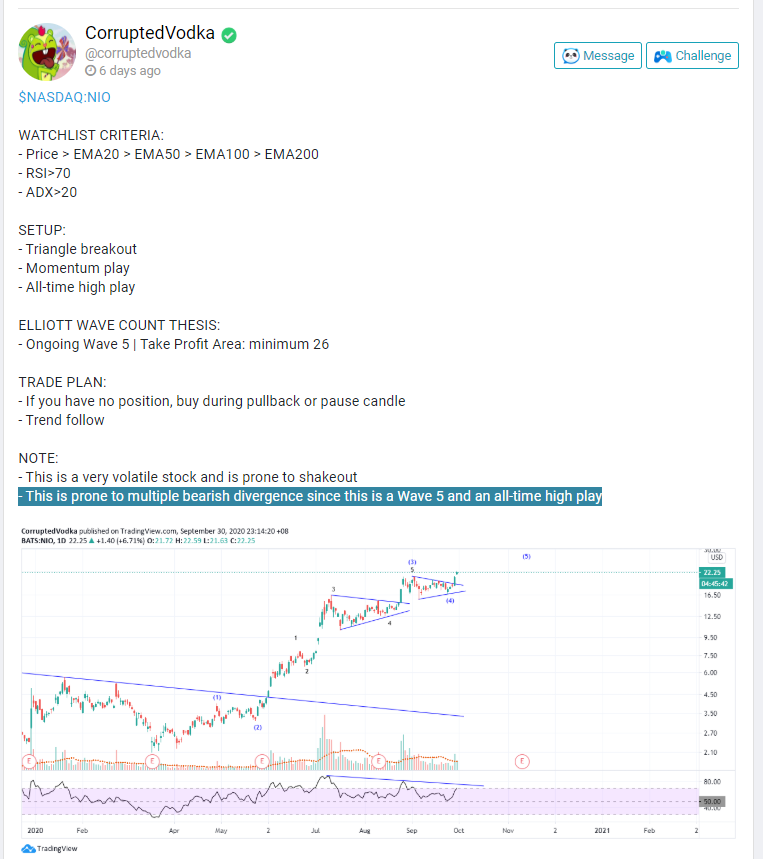
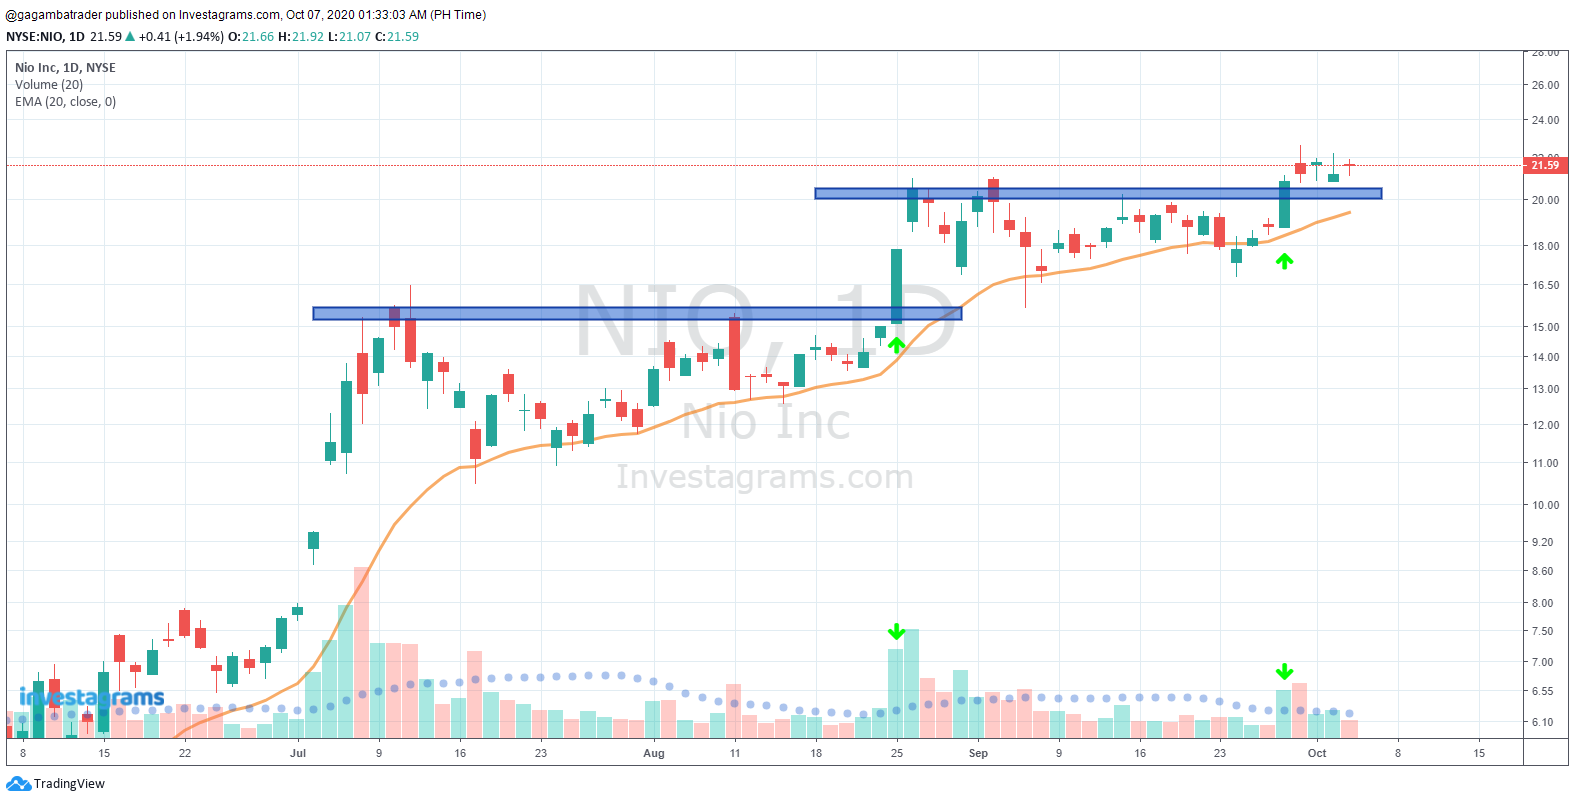
Figure 1: Example of a VCP pattern
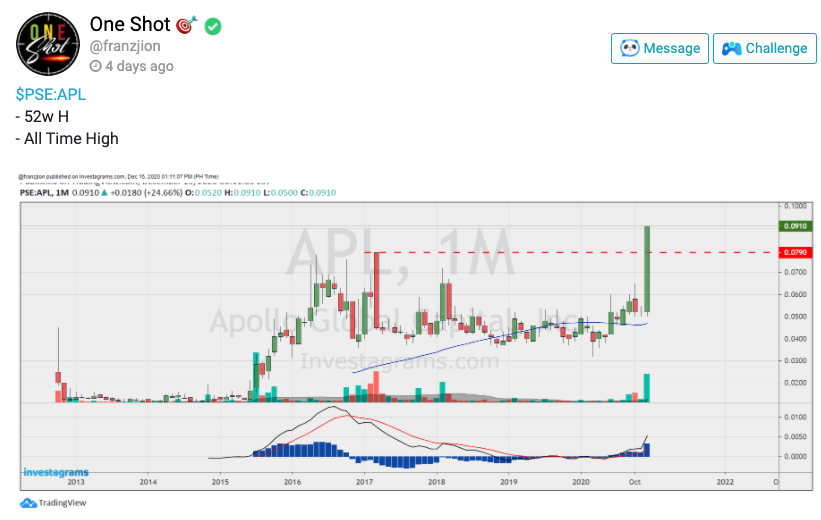
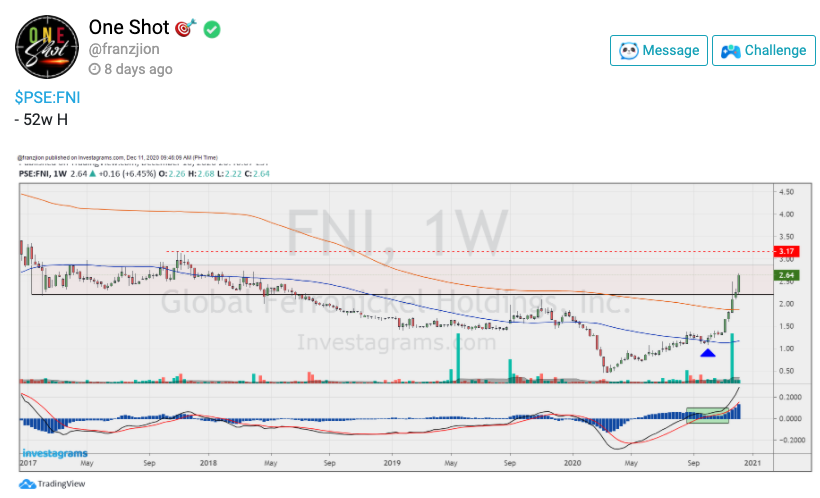
The key to identifying market leaders through the bottom-up approach is to spot names hitting 52wk highs or All-Time highs exhibiting a VCP pattern in its price behavior. It is a pattern that displays contraction in its volatility from its previous data to the following or present data.
Moreover, the said stock should be in the confluence of a surge of volume when creating a new move on the upside. Various names that have hit such parameters in a respective sector will often be the leaders.
Also, during a bear market, spotting names that are creating new highs with enormous volume, while the market is doing otherwise, is a good indication that when the bull market comes, the stocks that were unveiling such features are bound to become the overall market leaders for that period. They correct the least during a general market correction and rebound the fastest during a market recovery.
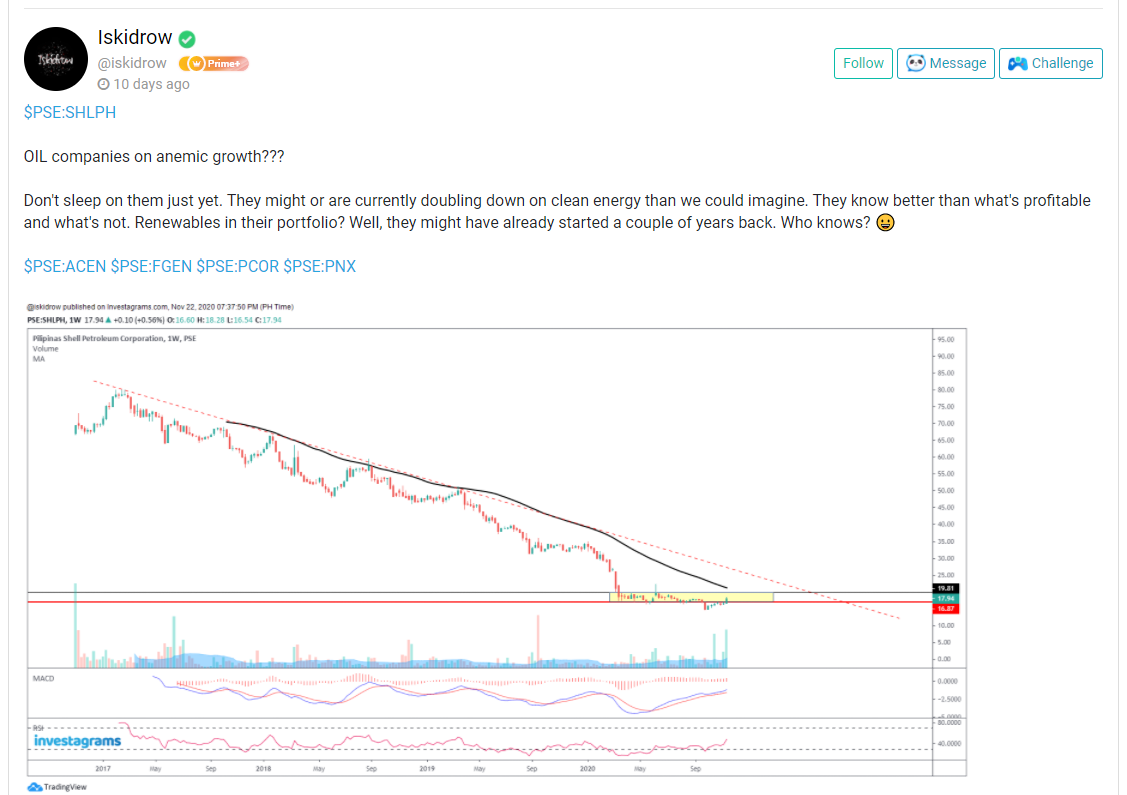
On the other hand, the Top-down approach is the opposite of that of the Bottom-up approach. This method’s problem is that a market participant gets discouraged from the overall indices and market sentiment. The top-down approach would limit the trader from the outliers or the potential market leaders that would move oppositely to its respective index.
LEARN STRAIGHT FROM THE EXPERTS FOR FREE! JOIN THE #INVESTAFEST2021 NOW.


If a said market participant adheres to the Top-Down approach, the chances are that the specific trader has loosely participated in the April 2020 rally. Wherein, these types of traders may have only grasped 5% of the overall opportunity that was offered by the financial markets.
There is no right or wrong approach to trading the financial markets. As Mark Douglas always exclaims, trading is an activity that offers the individual unlimited freedom of creative expression. Although aspiring market participants should be aware of the pros and cons of both methodologies.
Although professional traders use the bottom-up approach, wherein a trader does not rely on the opinions of other market participants; instead, they rely on their own bias towards individual names.
Are you a trader who employs the Top-down approach or the Bottom-up approach? Let us know in the comments section below!