
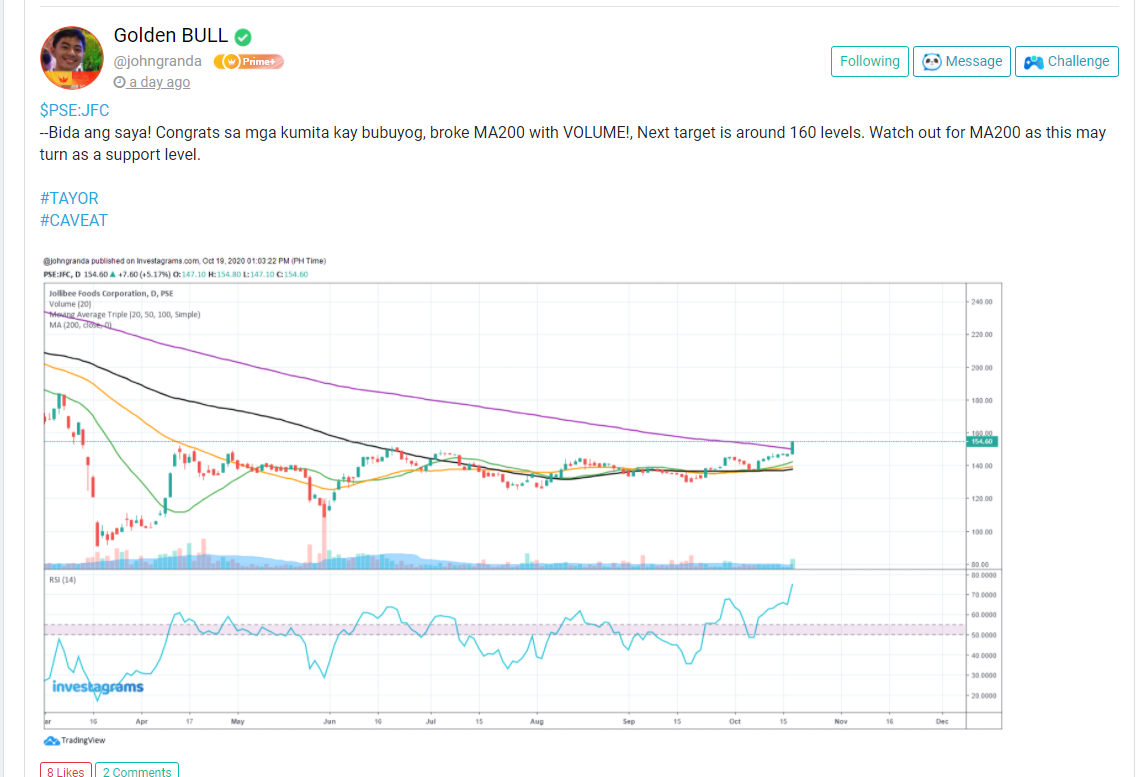
As the local index broke out of the 6000 levels in confluence with the 100-day moving average, several names have emerged, and one of which is a blue-chip company. Golden Bull (@johngranda) successfully spotted one of those potential leaders — Jollibee Foods Corp, or $JFC. This trader is an active member of the Investagrams community who endlessly provides his analysis and insights focusing on the local market.
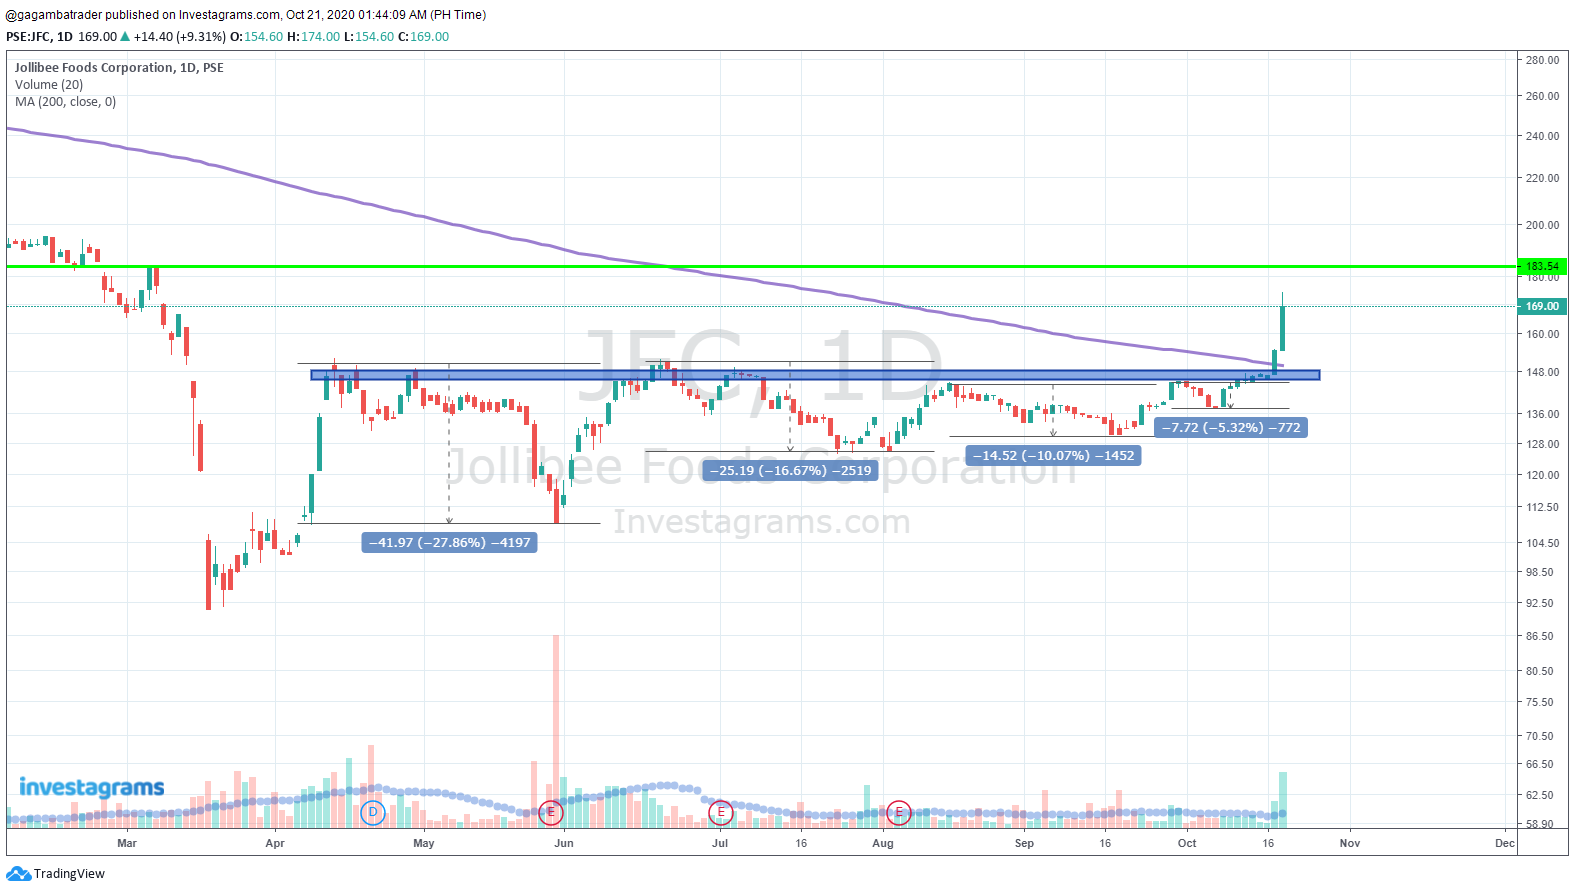
As seen in the pattern of the said stock, it exhibits a VCP pattern. Mark Minervini coined the said pattern in his book “Trade Like a Stock Market Wizard.” This means that the said pattern displays contraction in its volatility from its previous data to the following or present data. Moreover, it consolidated for six months, which solidifies that its breakout of the underlying base may be robust. Indeed, the bigger the base, the higher in space.
Moreover, Golden Bull (@johngranda) also mentioned the importance of also looking into moving averages as it is a form of support and resistance levels. In the book of Jason Cam named “The Trading Code,” the author explained that moving averages could be used as dynamic support and resistance. It is dynamic because merely moving averages are moving each day due to its statistical formula. Static support and resistance levels, on the other hand, are only not moving and are horizontal, just like the blue rectangle box that is representing the resistance of the underlying base in the figure above.
It is safe to say that $JFC has broken out of the pivot high of the underlying base in confluence with the 200-day moving average. Breaching the 200-day moving average is crucial as it is in a long-term horizon, which ultimately makes it more significant than that of the 20-day, 50- day, and 100-day moving averages.
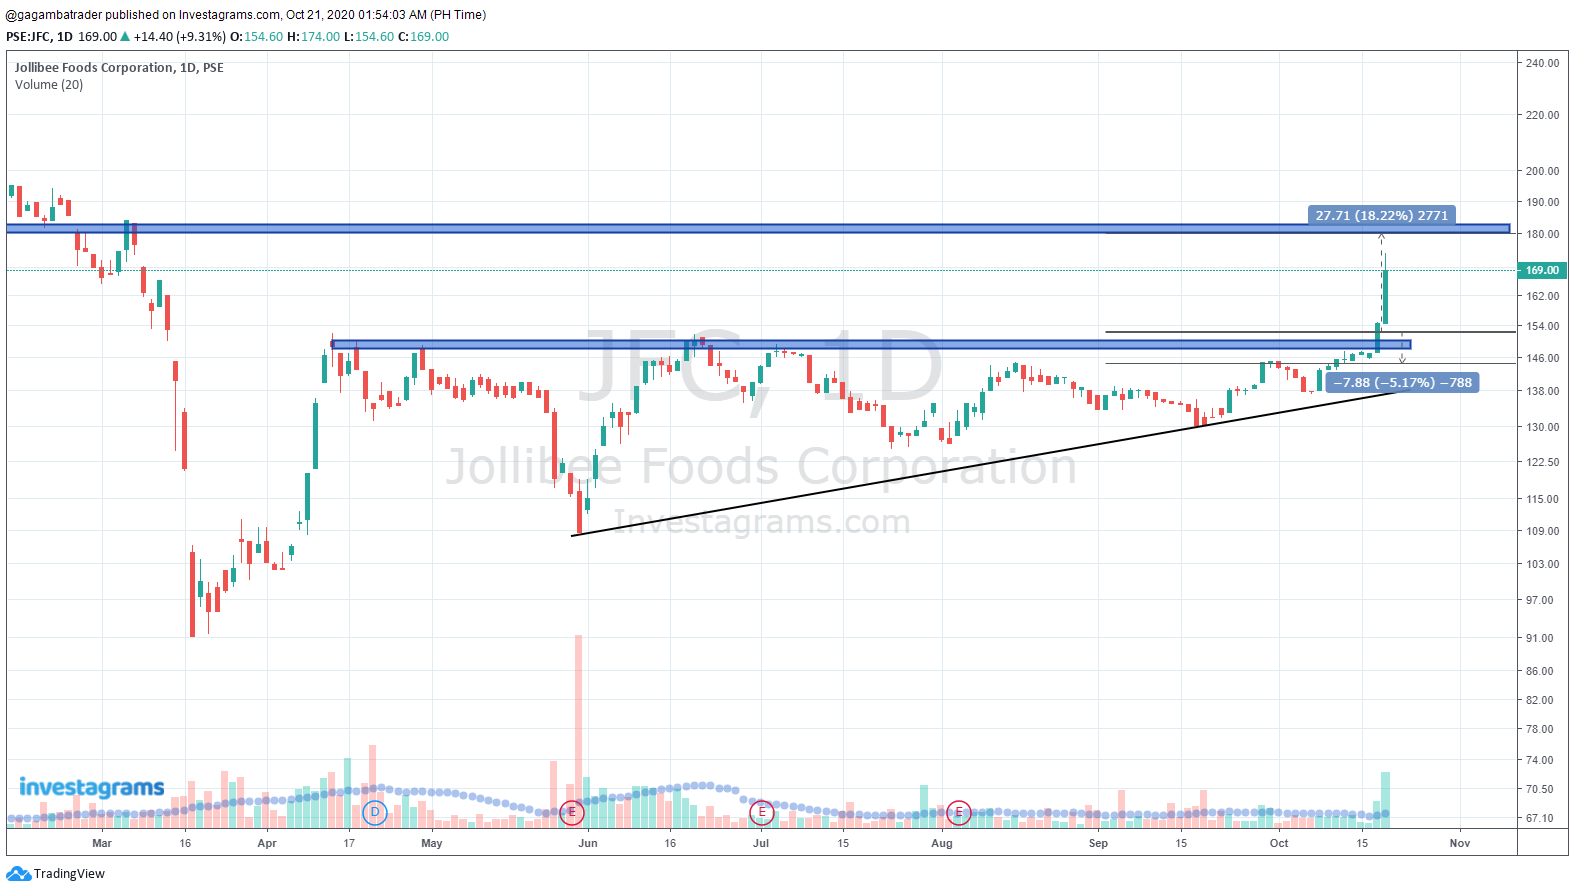
A breakout of the 150-peso pivot area was an ideal buy point as it was the confirmation of the ascending triangle breakout accompanied by massive volume. It is a low-risk, high-reward trade, as the stop loss levels for the said breakout point is around 144 (-5%), and the take profit areas could be the structural resistance at 180 (19%). As of this writing, the stock ended the trading session strong. Let us see if another constructive base will be formed to place our ideal 2nd tranche.
The said stock needs to break and sustain the 180-peso levels to assert its dominance further. Although we can also expect the displayed name to pullback on the old resistance turned to new support in confluence with the 200-day moving average. At the very least, the 150-peso levels should hold. It is also expected that since the $PSEi is increasing, $JFC should, and it is a bluechip stock.
Congratulations to those who were able to maximize the momentum of $JFC. Lastly, kudos again to Golden Bull (@johngranda) for sharing his execution. Your FREE 1-Month InvestaPRO access is on its way!
READY TO GET SERIOUS ABOUT YOUR TRADING?
JOIN THE EXCLUSIVE LEARNING AND COACHING SESSION WITH BEARYOTRADES!

Click here to download the RCBC Securities Stock Market Daily Guide for October 23, 2020:
Click here to download the RCBC Securities Weekend Recap for October 23, 2020: