Whenever we close our trades, we will often think to ourselves – could I have taken more profits? Would there be a way for me to have a better entry? If I did this or that more consistently, would it have been better for my portfolio?
There will always be things we can improve on, and asking these questions is a good first step. In order to really hone our edge and become traders, we have to take the next step and that is to backtest our system. Whether it be for missed trades or testing different approaches to your past trades, backtesting lets us test changes to our strategies. With the InvestaBacktest, we can simulate going back in time before any moves could have happened.
Let’s take a look at how we can effectively use the InvestaBacktest to hone our trading systems.
- Choose a stock and date to go back to
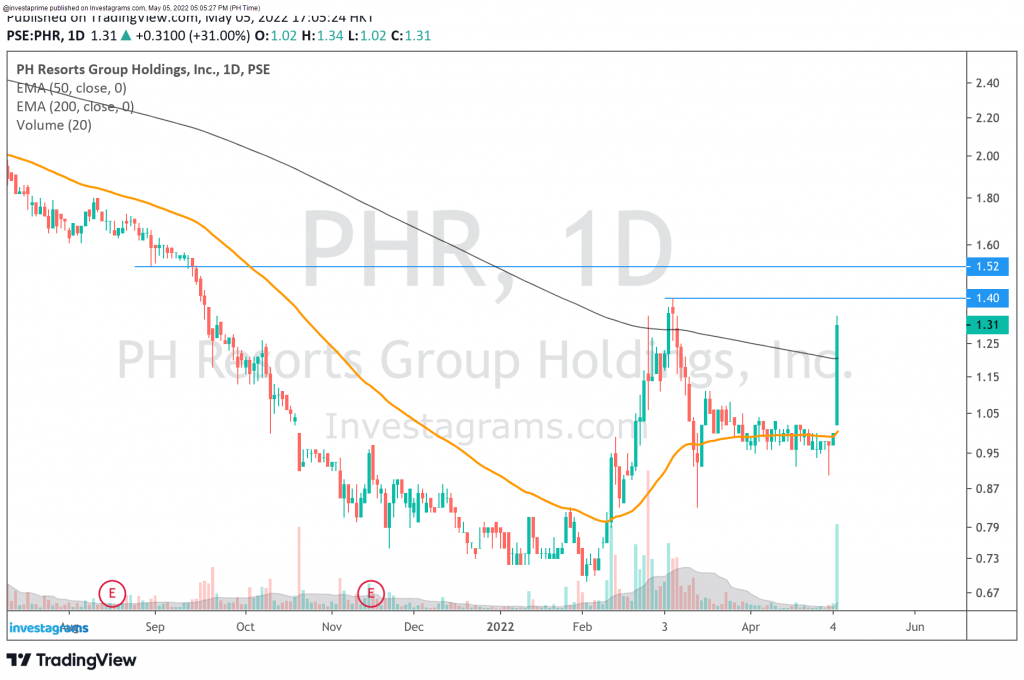
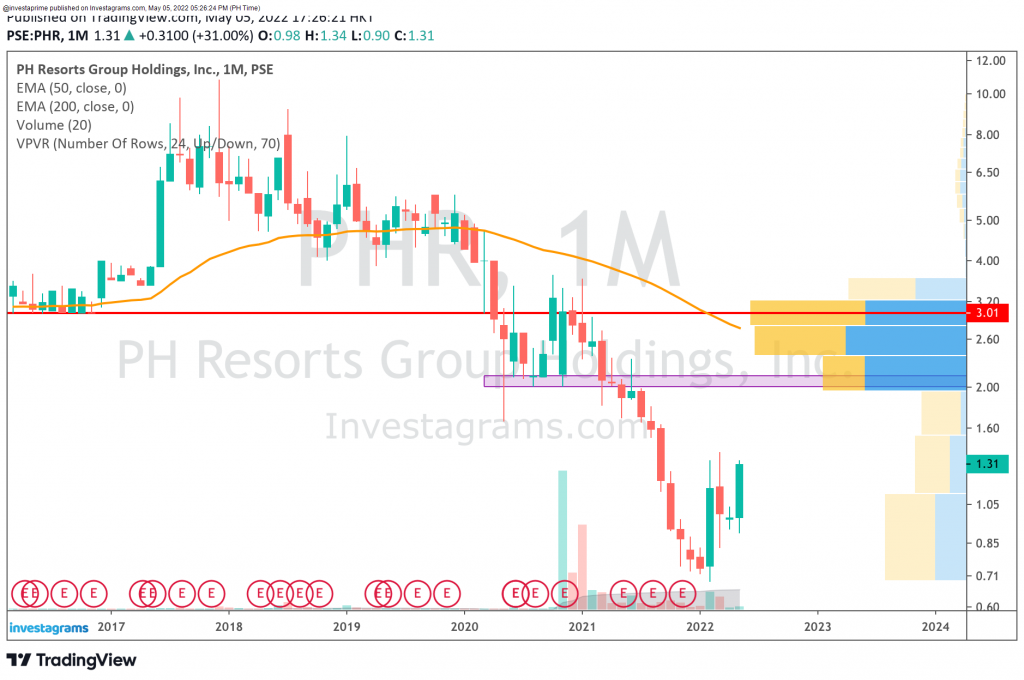
There are two ways we can look for a stock and time period to test. The first way is to go back to trades we missed and see if our strategy is suited for catching those kinds of plays.


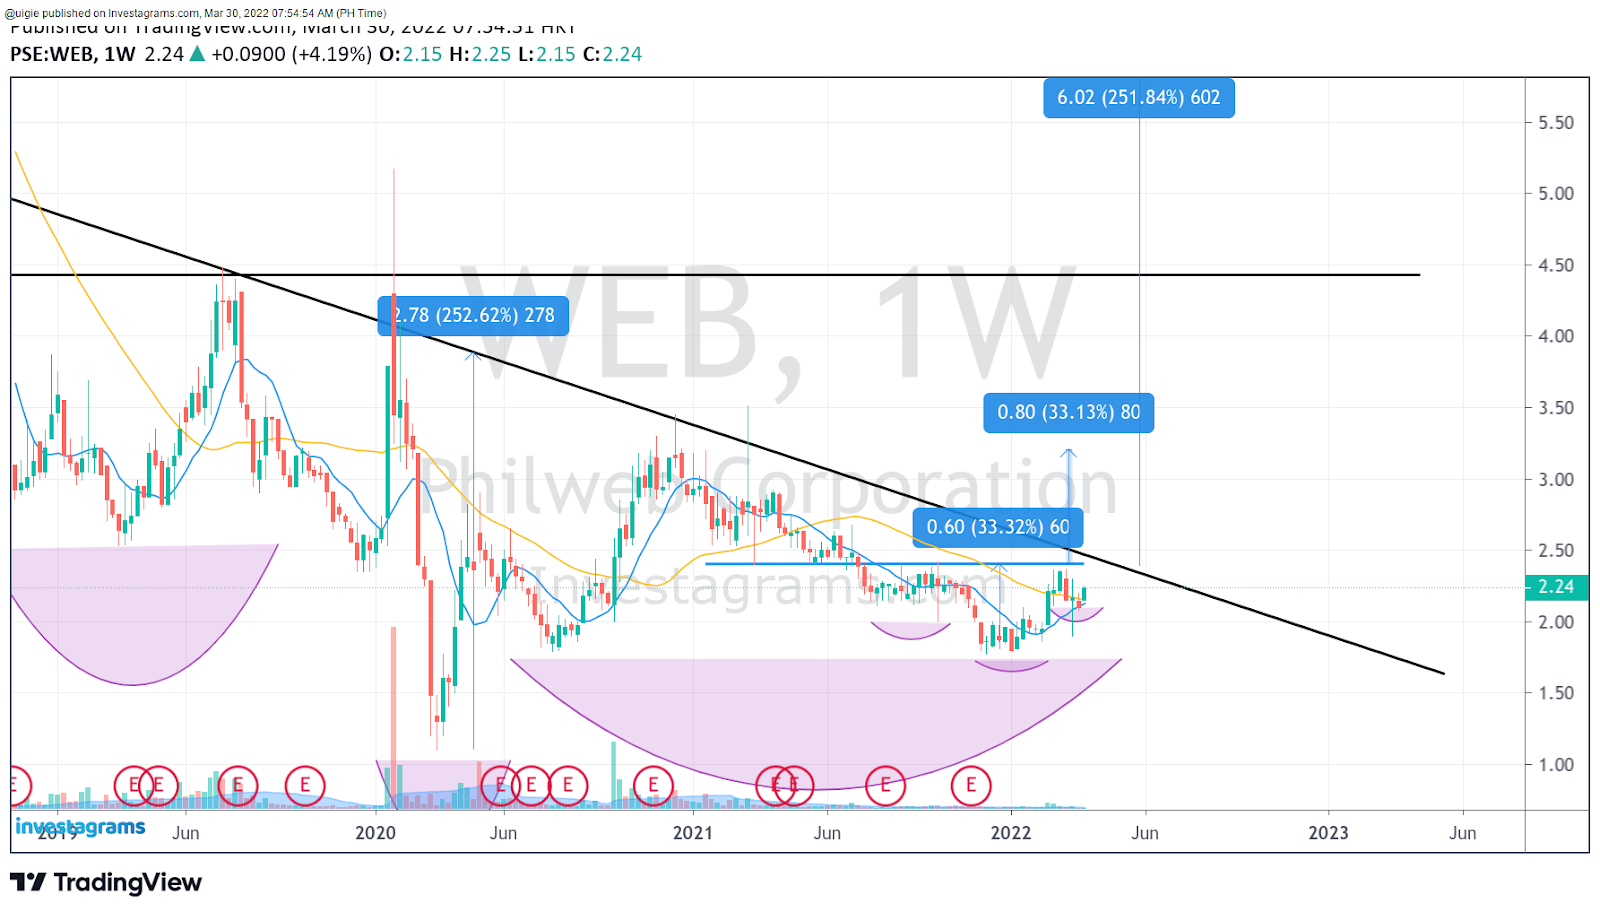
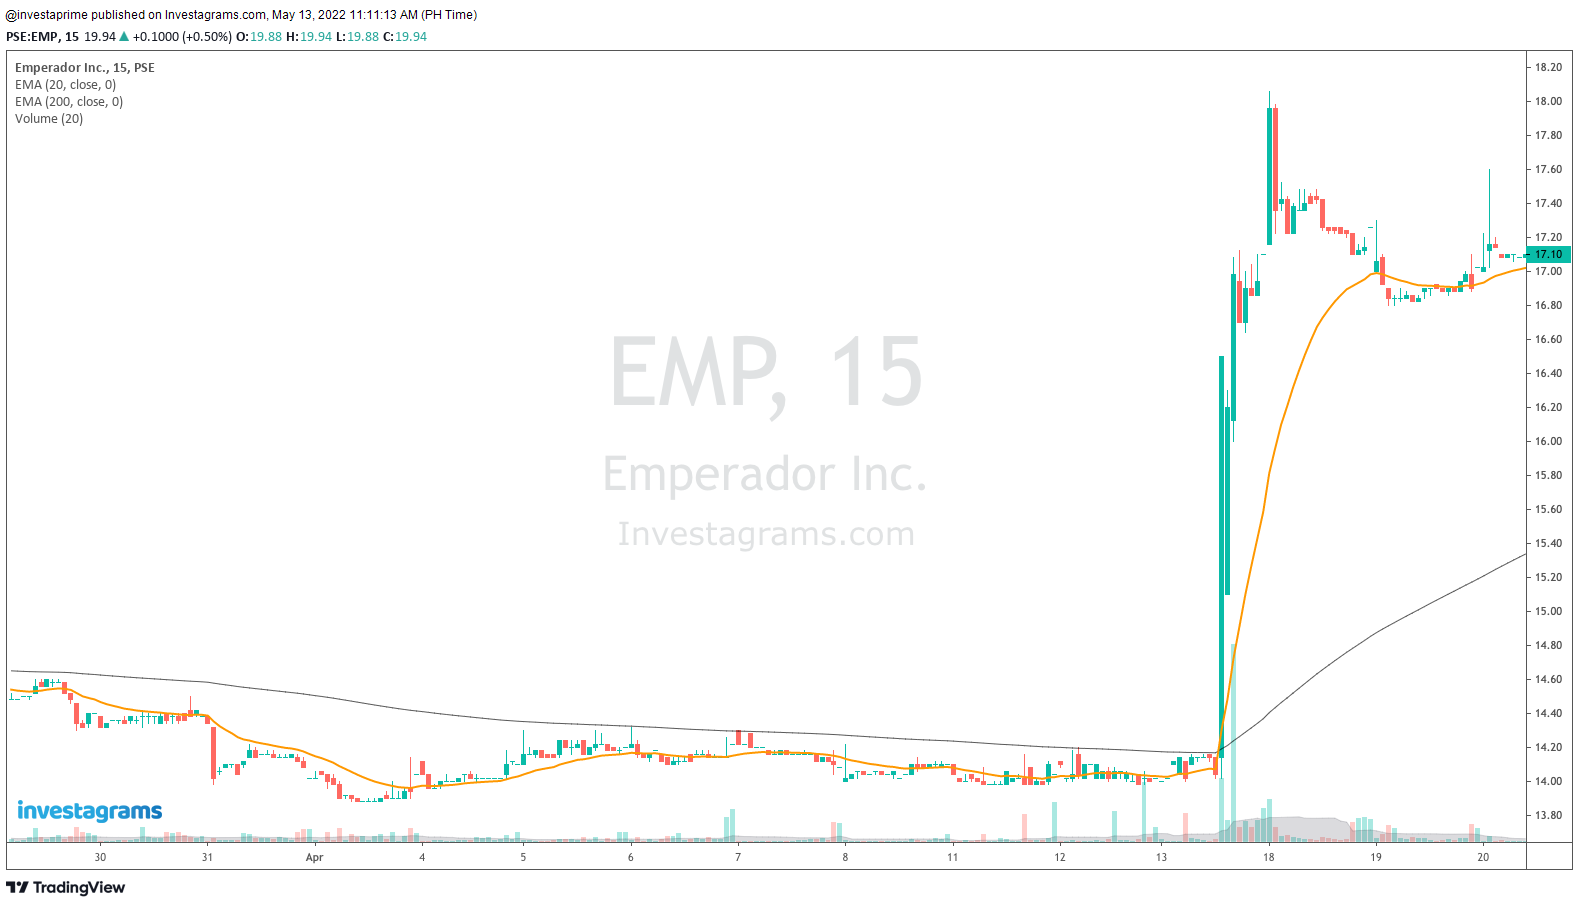
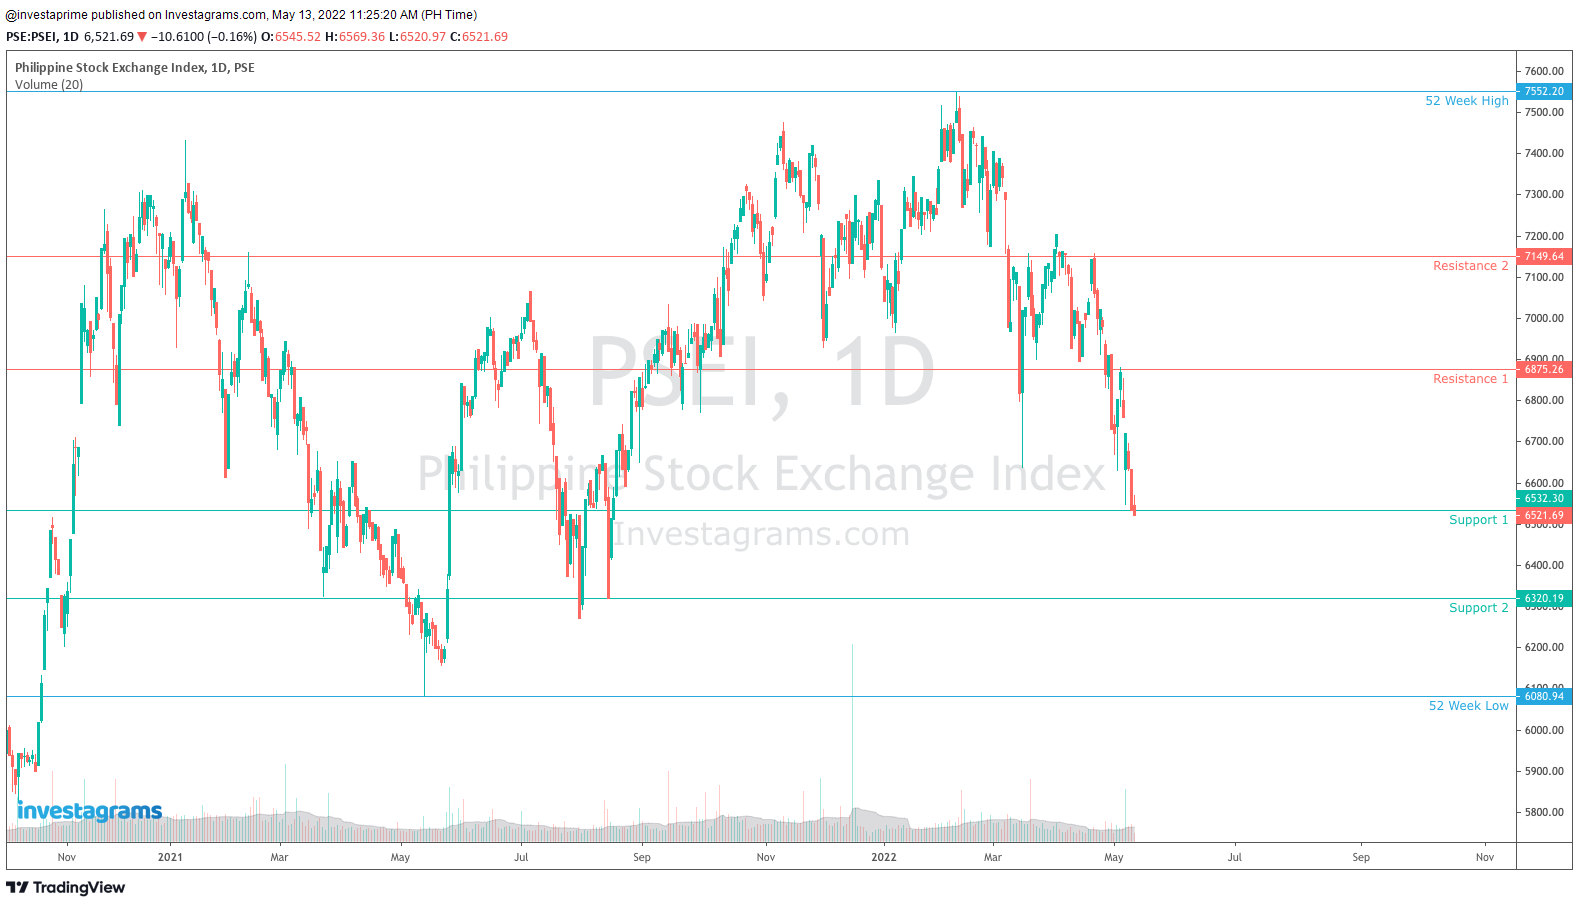
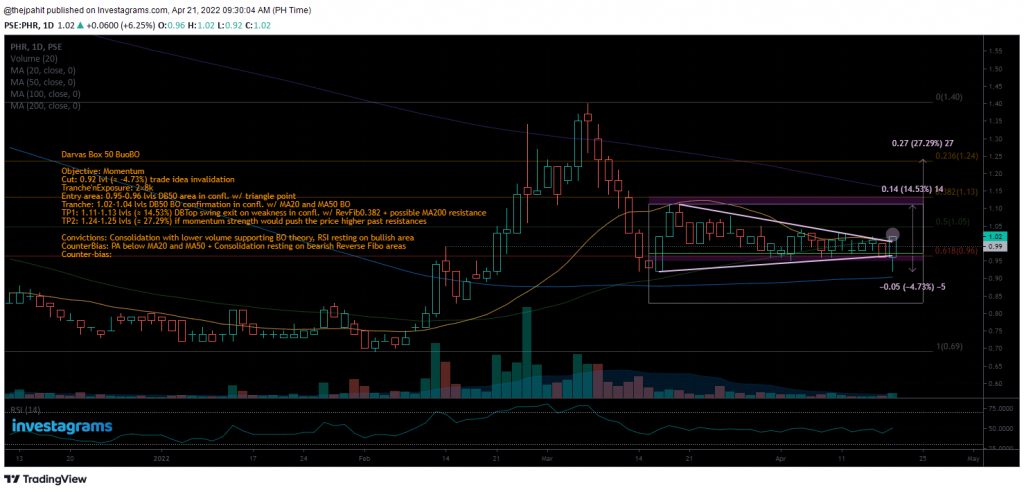
Here we will just input the stock and the date before the move we missed so that we can simulate what the chart would look like before the move itself. Since we know how things will unfold, we have to be as objective as possible and really stick to the strategy we want to test.

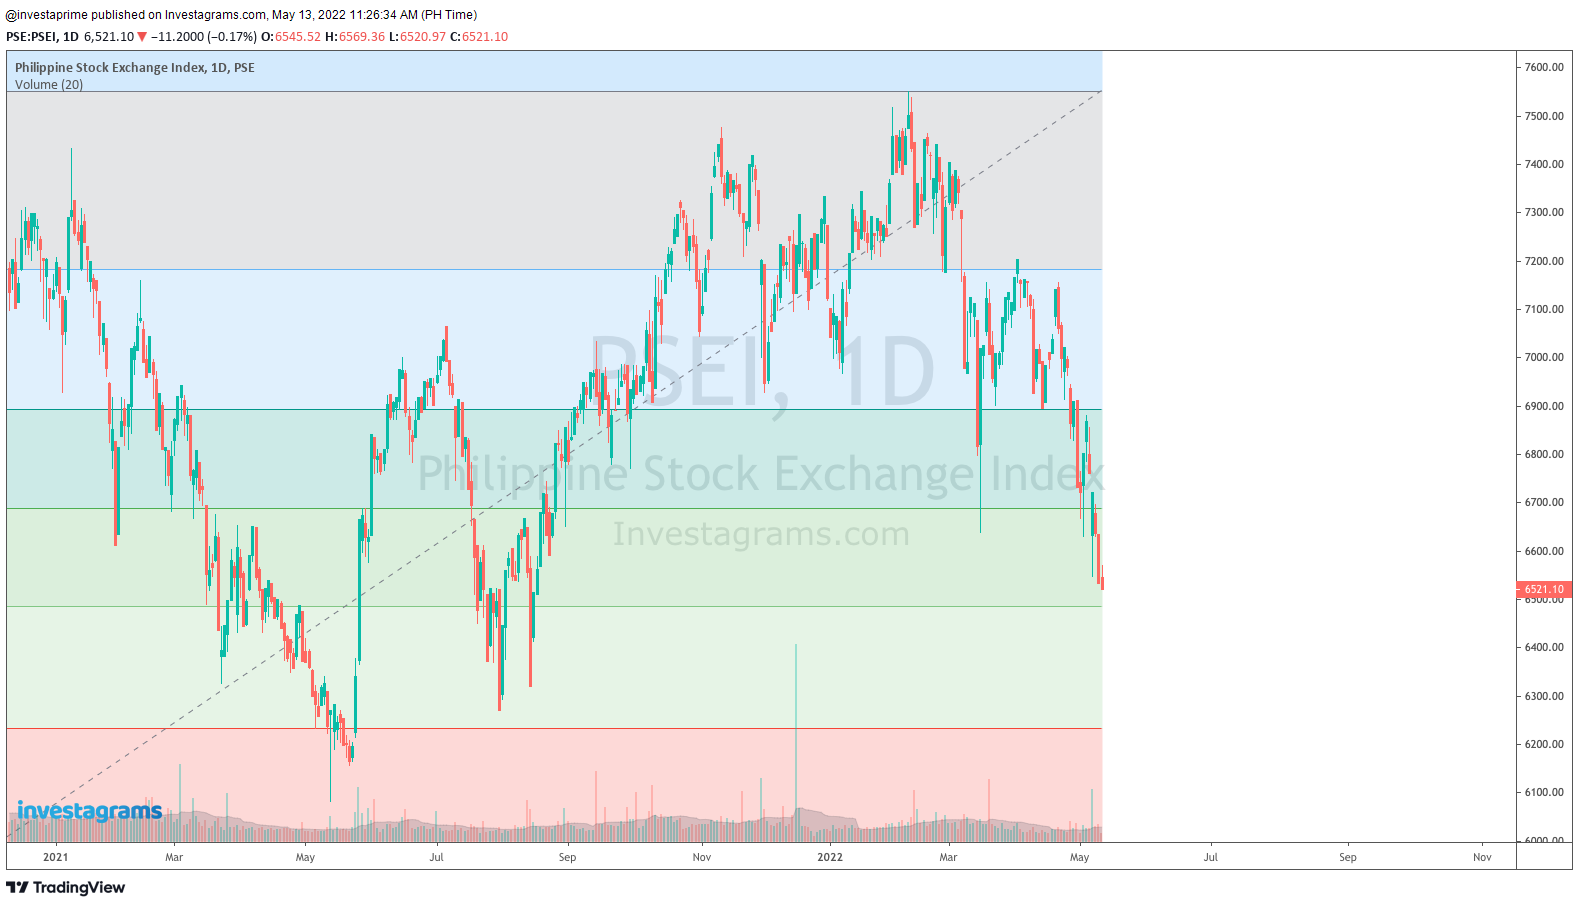
Another method could be selecting random stocks and picking specific market environments to trade in. Whenever we stress test our strategies, we should always be aware of what is happening to the market index as our strategies should naturally change whenever broad market conditions change. Even if, for example, we have a solid system for breakouts, it will most likely crumble if trades are forced during bear markets. Of course, there is merit in seeing how systems fail in bad environments, but we won’t be able to get any insights if we’re just randomly backtesting in an unknown environment.
- Set the indicators for the strategy to be tested
Once we have the set of data we want to backtest, we then input the indicators that we would be using for the strategy to be tested. No extra fuss whatsoever, it will be exactly as if we went back in time when we see the chart.

- Trade as if we don’t know what will happen
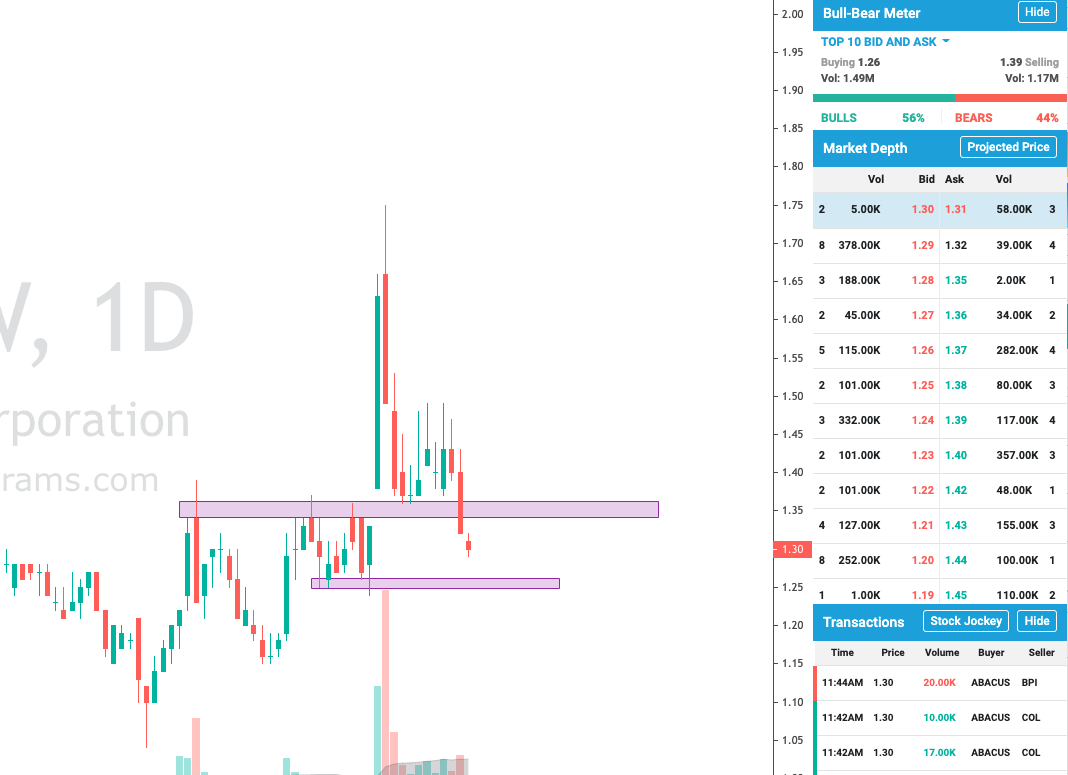
When everything is all set and ready to go, we now just have to trade and see how we perform. The execution is simple, we can just click the “NEXT DAY” (shortcut: Q) button to go one candlestick forward, and click the “BUY/SELL” (shortcut: E) button to buy or sell.

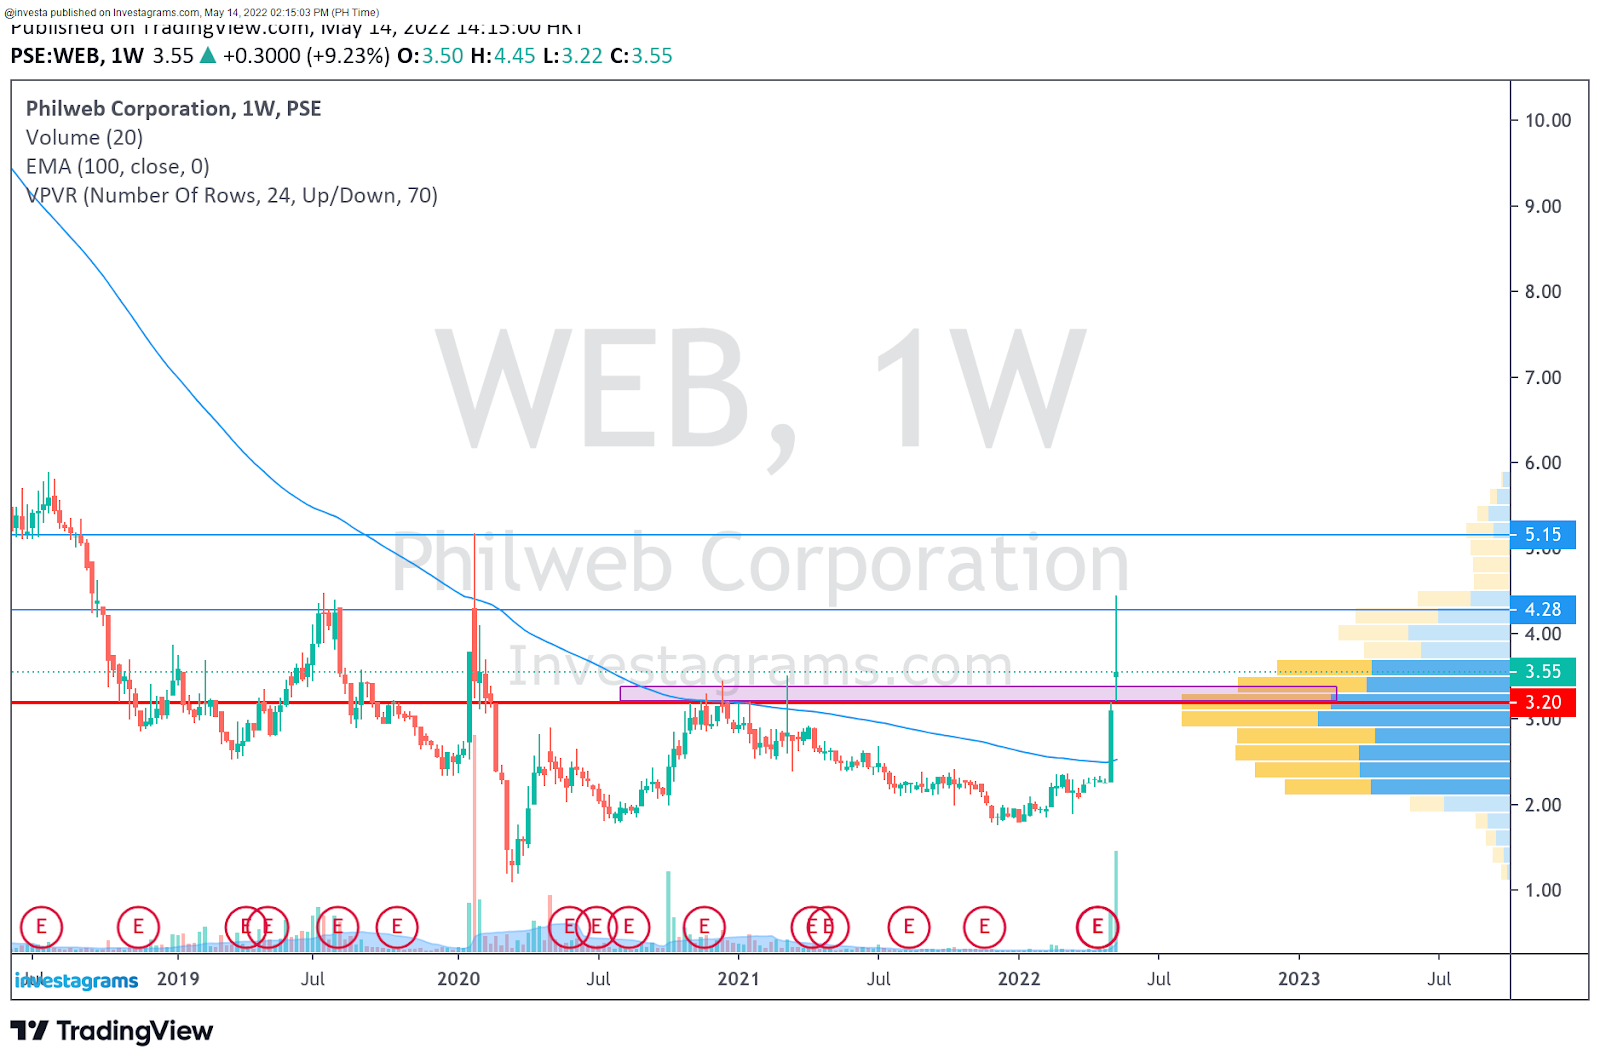
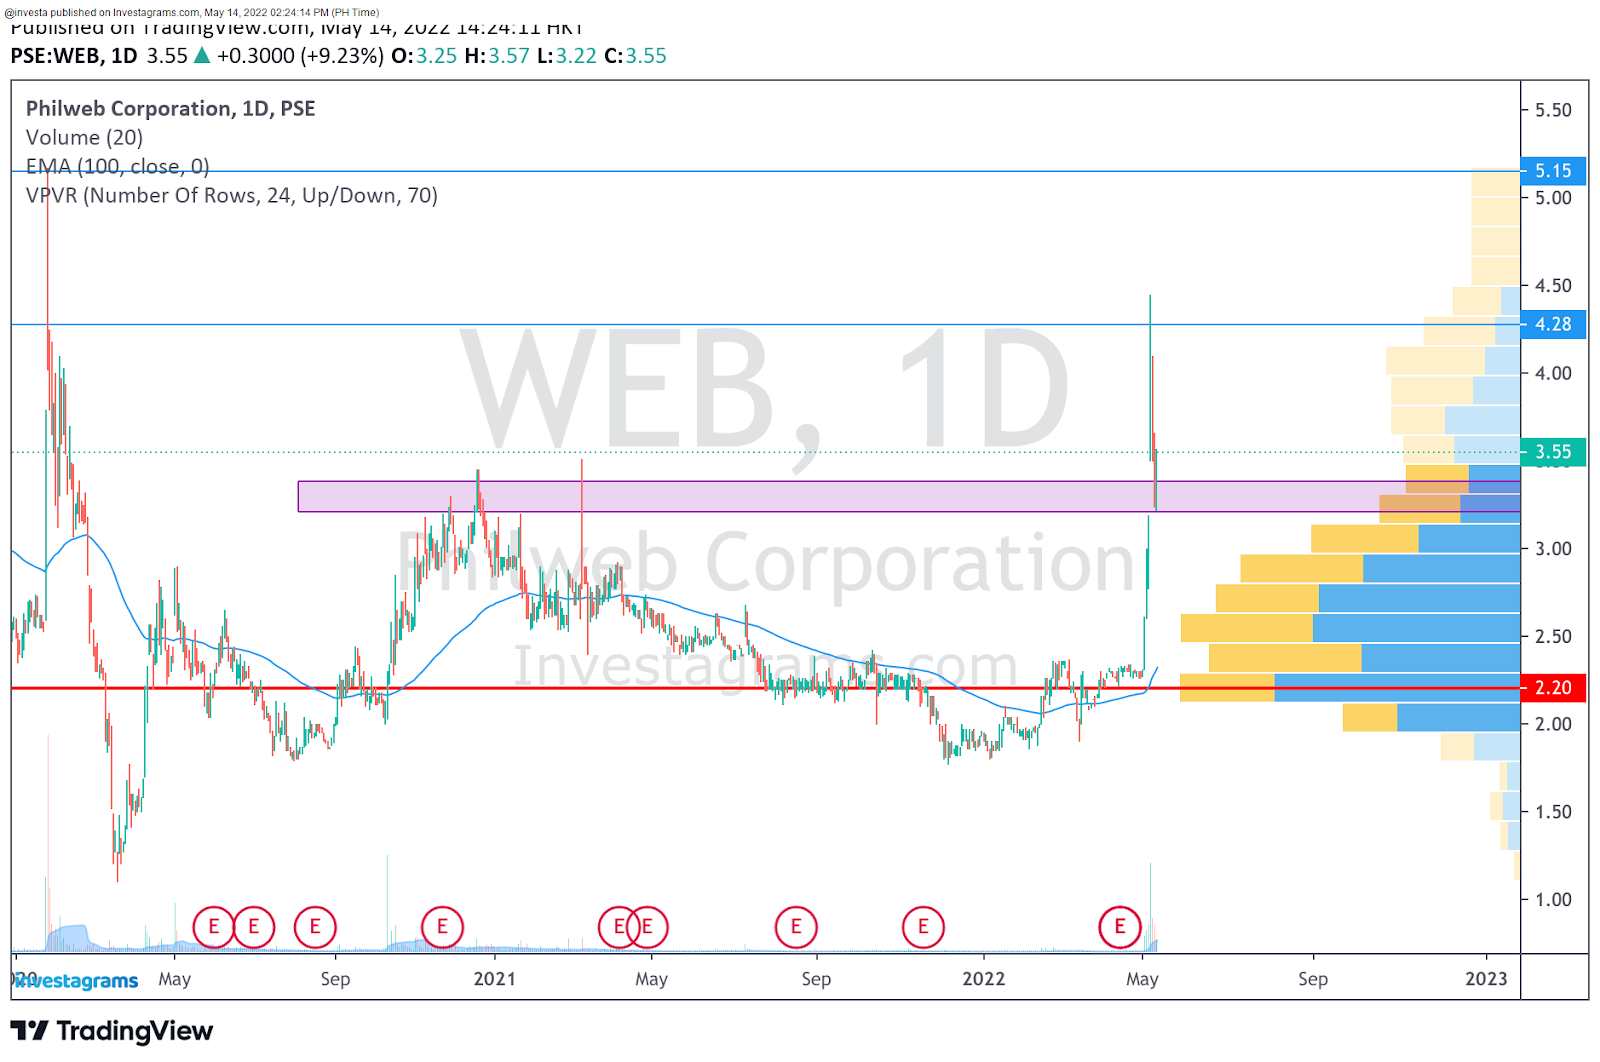
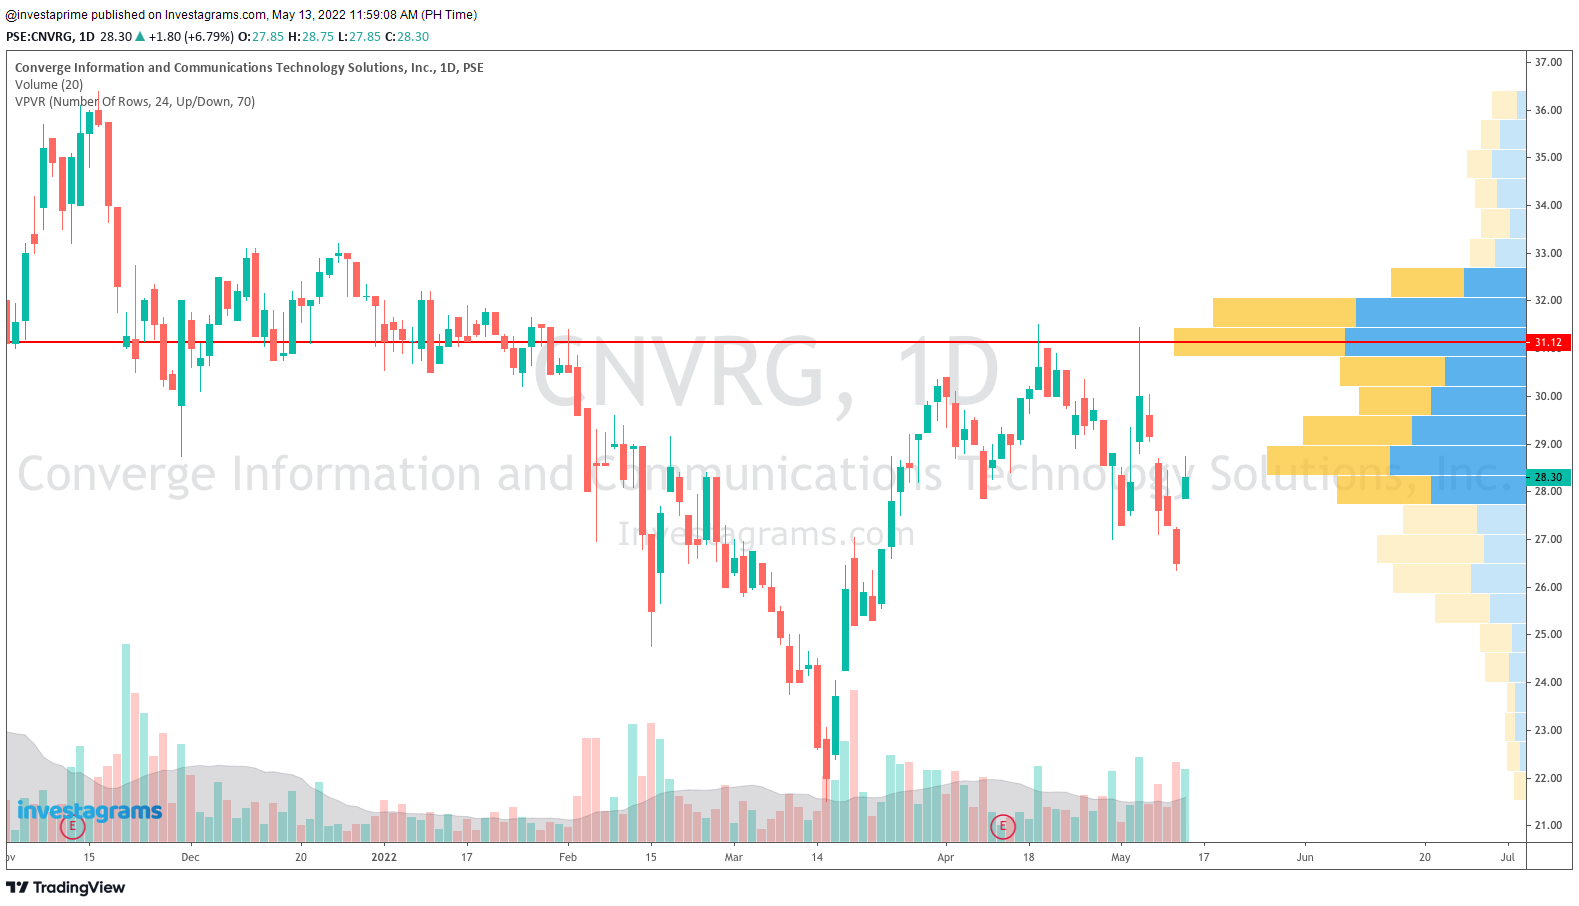
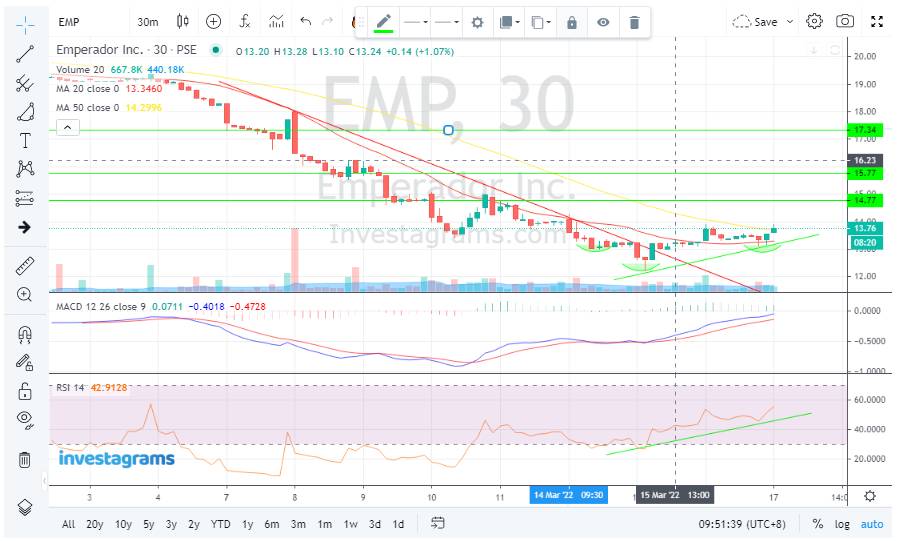
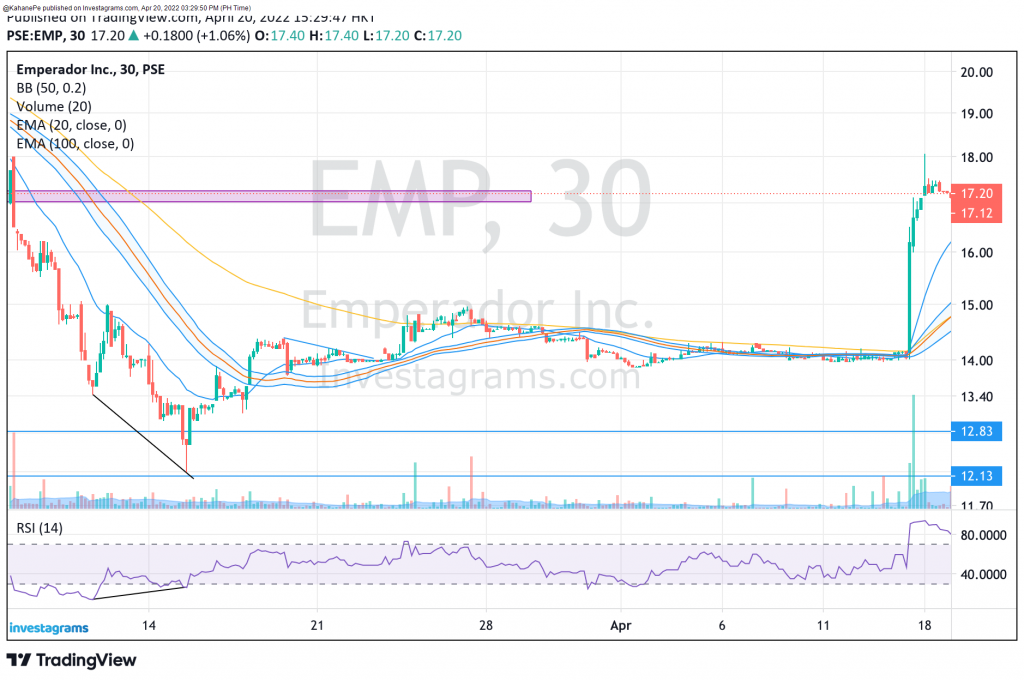
Although it might seem like a small thing, the InvestaBacktest’s feature of not knowing what will exactly happen with the next candle really helps us be more objective. Compare the above picture to the one below.

Again, we might already know what will happen, but being able to not see the exact movements lets us better fight biases, where we would trade more perfectly just because we already know what the next candle looks like
- Check how the strategy performs
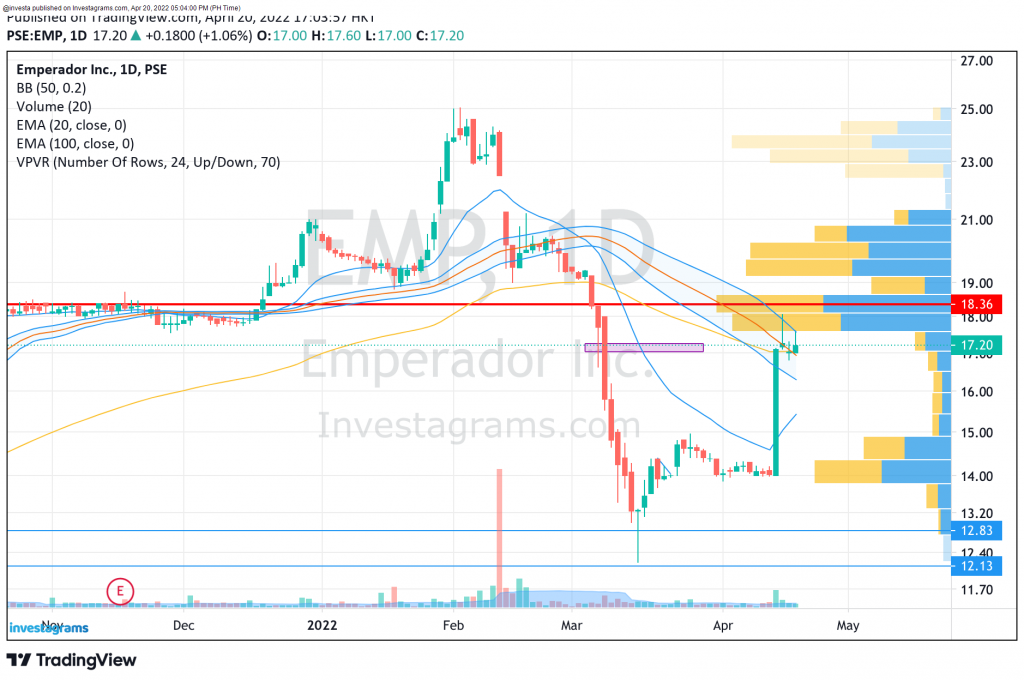
Lastly, once we have backtested as much as we want, it’s now time to check our results. By clicking the “End Backtest” button, the test will be stopped and our trade history along with some statistics will be shown.


We can see how long our trades lasted, how much we gained per trade, what our total win rate is, and how much our total gain is.
One last thing that you should be wary about when backtesting is that there is such a thing called the optimization bias. Many traders want to have the perfect trading system, so while they build and backtest their system they keep on adding more and more complex rules or indicators to have the perfect entries and exits. Having an incredible system is good, but it is important to know that there is no holy grail in trading. All systems will be subject to losses, and if a system seems too perfect, it will likely have been subjected to lots of optimizations that make it unrealistic to trade with in real-time. The rule of thumb to remember is to keep things as simple as possible.
As you can see, it is really simple to use the InvestaBacktest as we wouldn’t need to know anything about coding as with what other programs use. We would only need an InvestaPrime+ subscription at the least along with our trading system to test.
Want to know more about what we offer? Head on over to the InvestaPrime landing page to look at all the features that we provide to our subscribers!