Have you ever experienced a losing streak which ultimately depleted your confidence in trading the markets? There is also a similar situation that is as dreadful. It is when you experience a winning streak that ultimately makes you overoptimistic.
The Superman Syndrome enables you to feel like an eternal being thinking that the trader possesses a tremendous control over their next trades. The trader starts to execute setups that are not in conjunction with their trading system. As if the market participant deems that their future trades would be mostly right. The trader feels that they can bear with the extra losses as they have gained a significant hedge through their previous gains. The Superman Syndrome enables impulsive decision making through overtrading rather than being in Zen through being selective in their stock selection.
It is also as bad as feeling lost and being diffident on your next trades. Thinking ahead that their next trades will be losers. An individual would find it difficult to execute a trade given the bias that is circling in their head. Being too defensive will hinder an individual from amassing the full potential embedded in the financial markets.
Having confidence in trading is a key aspect to achieve success in the financial markets. However, a market participant should not be reluctant nor conceited when it comes to their trading psychology.
It is best to take a breather whenever you score huge gains and winning streaks to reset your urges. This also applies when your money is on the drain after a losing streak. As they say, trading is 80% psychology and 20% methodical.
Being in Zen while being free from external negative energies that could disrupt your trading is a non-negotiable aspect of this endeavor. Being in this type of state enables the trader to stay in the flow. Traders who are at peace tend to make themselves available on the endless streams of opportunity that the market is offering at any given moment.
Click on the photo to GET YOUR FREE ACCESS.
Possessing the urge to revenge trade or to trade impulsively due to the Superman Syndrome must be treated instantly. The same goes with being hesitant due to losing streaks. It pains to be in an emotional rollercoaster while pursuing this type of endeavor. As they say, you attract what you are.
To learn more about trading psychology, I highly suggest reading the book called “Trading in the Zone” by Mark Douglas. It is a trading psychology book that will enable you to master the market with the proper discipline, confidence, and attitude.
Before entering the level 10 in a game, the player needs to start at level 1. Before even the famous Shakey’s or Mang Inasal have started, they have started small too! And just like any other investor or trader, everyone starts with the foundation of the basics in technical and fundamental analysis.
Winning in the stock market is a process. It is never just a one-step win or even a trade with 80,000 pesos gain. Everything starts with a good foundation of financial literacy, and this starts with the basics in technical and fundamental analysis.
Now, what’s in it for you to understand the basics? Understanding each concept of technical and fundamental analysis will help you assess the stock you are about to pick. It helps you gain more wisdom on how you should understand the stock market and the company on various perspective, just like how you would choose between wearing a casual or formal attire. Analysis provides information that will help you interpret the structure of the company or even understanding the figures on the financial statements.
As an investor, you must know the intrinsic and true value of a stock. You must be able to determine if the value reflects on the stock prices. Of course, who would like to buy a 500 pesos worth of ground coffee without knowing its history, background, and components! This is the reason that you should invest in knowledge on analyzing the stock market.
Fundamental Analysis
Fundamental analysis is not just defined to be any fundamental, basic, or elementary education. Understanding the component of fundamental analysis would help you asses the quality, profitability, sustainability, and growth of the company.
Start from a top-down approach, in which you would start analyzing information from general to specific. Now, how are you supposed to win the basics in fundamental analysis? Remember the acronym FLIGHT! And now we are boarding to our destination, the fundamental analysis
F stands for Financial as your Language
English and Tagalog are not enough in understanding the stock market. Make finance as your language.
Why? So that you can understand the financial characteristics and financial statements of the company you are about to invest into. Now, making finance as your language does not solely mean accounting or computing. It also helps you understand underlying factors and signals such the news and press releases of the company. Assess the valuation, earnings, and growth, of the company to know the financial health in terms of assets, obligation, ratios, and cash flows.
L stands for the Law of Demand and Supply
Math? Stock Market? And now Economics? Yes! You see, if there are sellers and buyers, there is a demand and supply in the market, and this makes the stock prices rise and fall. Take note that when the stock goes uptrend, there are many buyers. Otherwise, there are many sellers.
I stands for Intrinsic Value
Always keep it in mind that you would want to buy a stock which reflects its value on the stock price. To know this, you must check the Price-Earnings ratio of the company and compare it among its peers or company of the same industry.
G stands for Growth and Good Investment
The relationship of the price and value also leads to quality of growth and goodness of the investments. In order to know the quality of the company, you must check on the high-quality rate of the company’s value on the financial statements (balance sheet, income statement, cash flow) and financial ratios (liquidity, operating, valuation, common size, solvency).
Never just check on one part of the structure! You must check the signals and be able to determine if the company is under too much debt or is it well operating on its finances.
H stands for Historical Performance
It is a must to check on the historical performance of the company to check whether or not they are growing. Ask yourself if it is the company you are willing to place your money into for a certain period.
T stands for Think not Trend
Never invest on a stock just because it goes trending or your friends tells you so. Think wisely and analyze the company’s stability and development. Remember being famous or big does not necessarily mean it is good investment.
And now we are unto our next destination, technical analysis. Now, let’s READ!
Technical Analysis
R stands for Reading Charts, Lines, and Patterns: Market Structure
Understanding the different charts, trend lines, and candlestick patterns will help you understand the market structure. With these visual representations, you can slowly begin to determine if the stocks are going uptrend, downtrend, reversal, or sideways.
E stands for Evaluation with Indicators
Now, in technical analysis there are various indicators. However, you must begin with learning the concepts then applying each and checking which one would fit your strategy as a scalper, day trader, position, or swing trader.
You must first understand the concept of floor price and the floor ceiling, also know as the support and resistance. Why? Because this will help you understand the breakouts and breakdown with the candlesticks,
You can also use the RSI, to know if the stocks is overbought or oversold, or the moving average to know the buy signal. There are various purposes of indicators. But most importantly, this will help you enter and exit the market on a great time.
A stands for Assessing yourself
Assessing chart movements is useless if you do not have risk management and control over your emotions. As Alexander Elder quoted, “the markets are unforgiving, and emotional trading always results in losses”, and I guess you wouldn’t want that either!
D stands for Don’t forget to read and do a strategic application
After all these points to remember, always enjoy learning and re-learning over and over again.
Charlie Munger: The game of life is the game of everlasting learning. At least it is if you want to win.
CLICK ON THE PHOTO TO GET YOUR INVESTAPRIME ELITE FREE 14-DAY ACCESS!
Being an Independent Operator is a skill that seems difficult to do for most aspiring traders. The ability to cancel the noise regarding various opinions from fellow market participants is essential to being profitable in the years to come. Craving for the insights of other traders towards your trade selection is not an ideal way of amassing consistency in the long run.
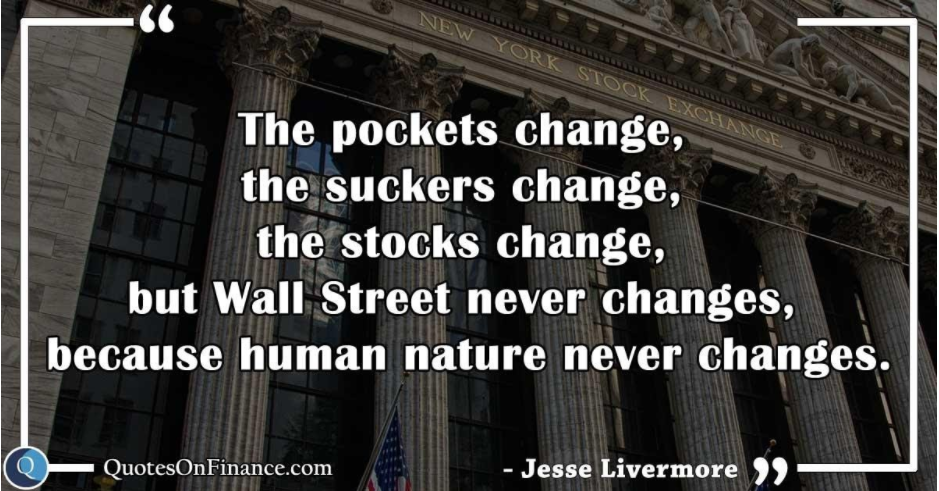
The late Jesse Livermore, one of the best traders in the world, also succumbed to the opinions of others back in the day. This shortly led him to financial ruin. As he exclaims, the markets are never wrong, only opinions are. Furthermore, the late Nicolas Darvas also experienced something similar.
After developing the Darvas Box system, there was a phase in his life where he moved next to the office of one of his brokers. This led him to jive in with rumors, opinions, and insights with regards to his stock selection. After both critically acclaimed traders experienced turmoil, they started to commit to the golden rule of deciding their stock selections by themselves.
Source: QuotesonFinance.com
Even if these events happened sixty to eighty years ago, it is still relevant up to this day. These events still happen in the trading community today. People pushing their thoughts in social media, people debating about their stock picks, people telling the community to ride in the stock as it reaches the moon. Unfortunately, this is inevitable.
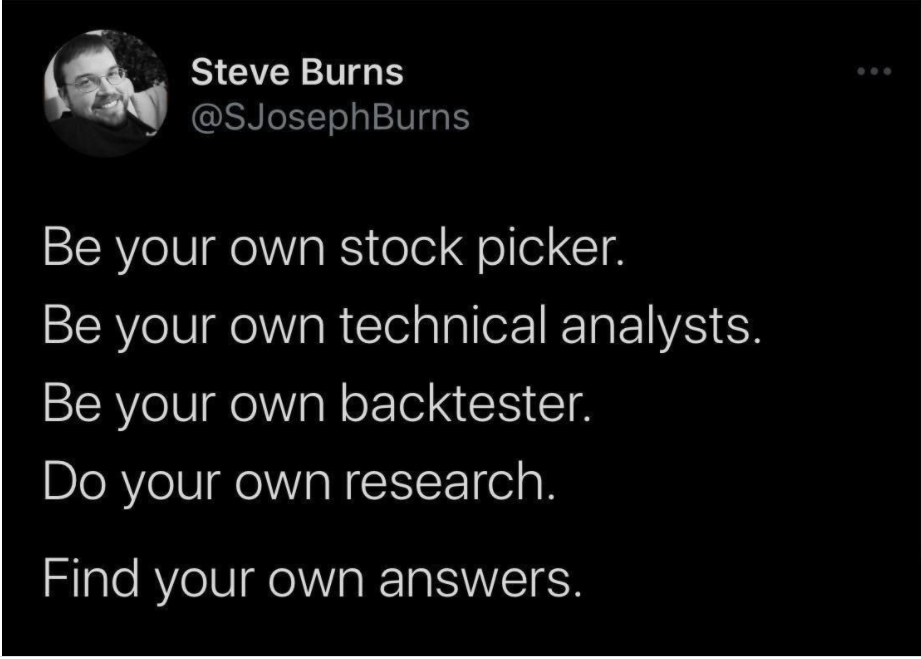
The financial markets will never change so long as human nature never changes. Given that it is predominantly humans who trade the markets, the behavior of which will always be in accordance with human nature.
Source: Steve Burns’ Twitter Post
If you crave and rely on another person’s bias towards a stock or any asset class, how can you become an independent operator? It is a fact that everyone is unique. We have different perceptions regarding a subject matter.
Avoid being succumbed to rumors and opinions about the markets. I am not saying that we should not seek individuals who are better than us to guide us in our journey, what I am trying to say is that you have to learn how to take things with a grain of salt. Seek knowledge and insights on HOW TO DO IT ON YOUR OWN. Just as in life, you cannot long for your parents’ guidance forever.
You still have the chance to be the Champion of the Biggest Trading Competition in the Philippines! Trading Cup 2020’s Registration is open until OCTOBER 4. Join now!
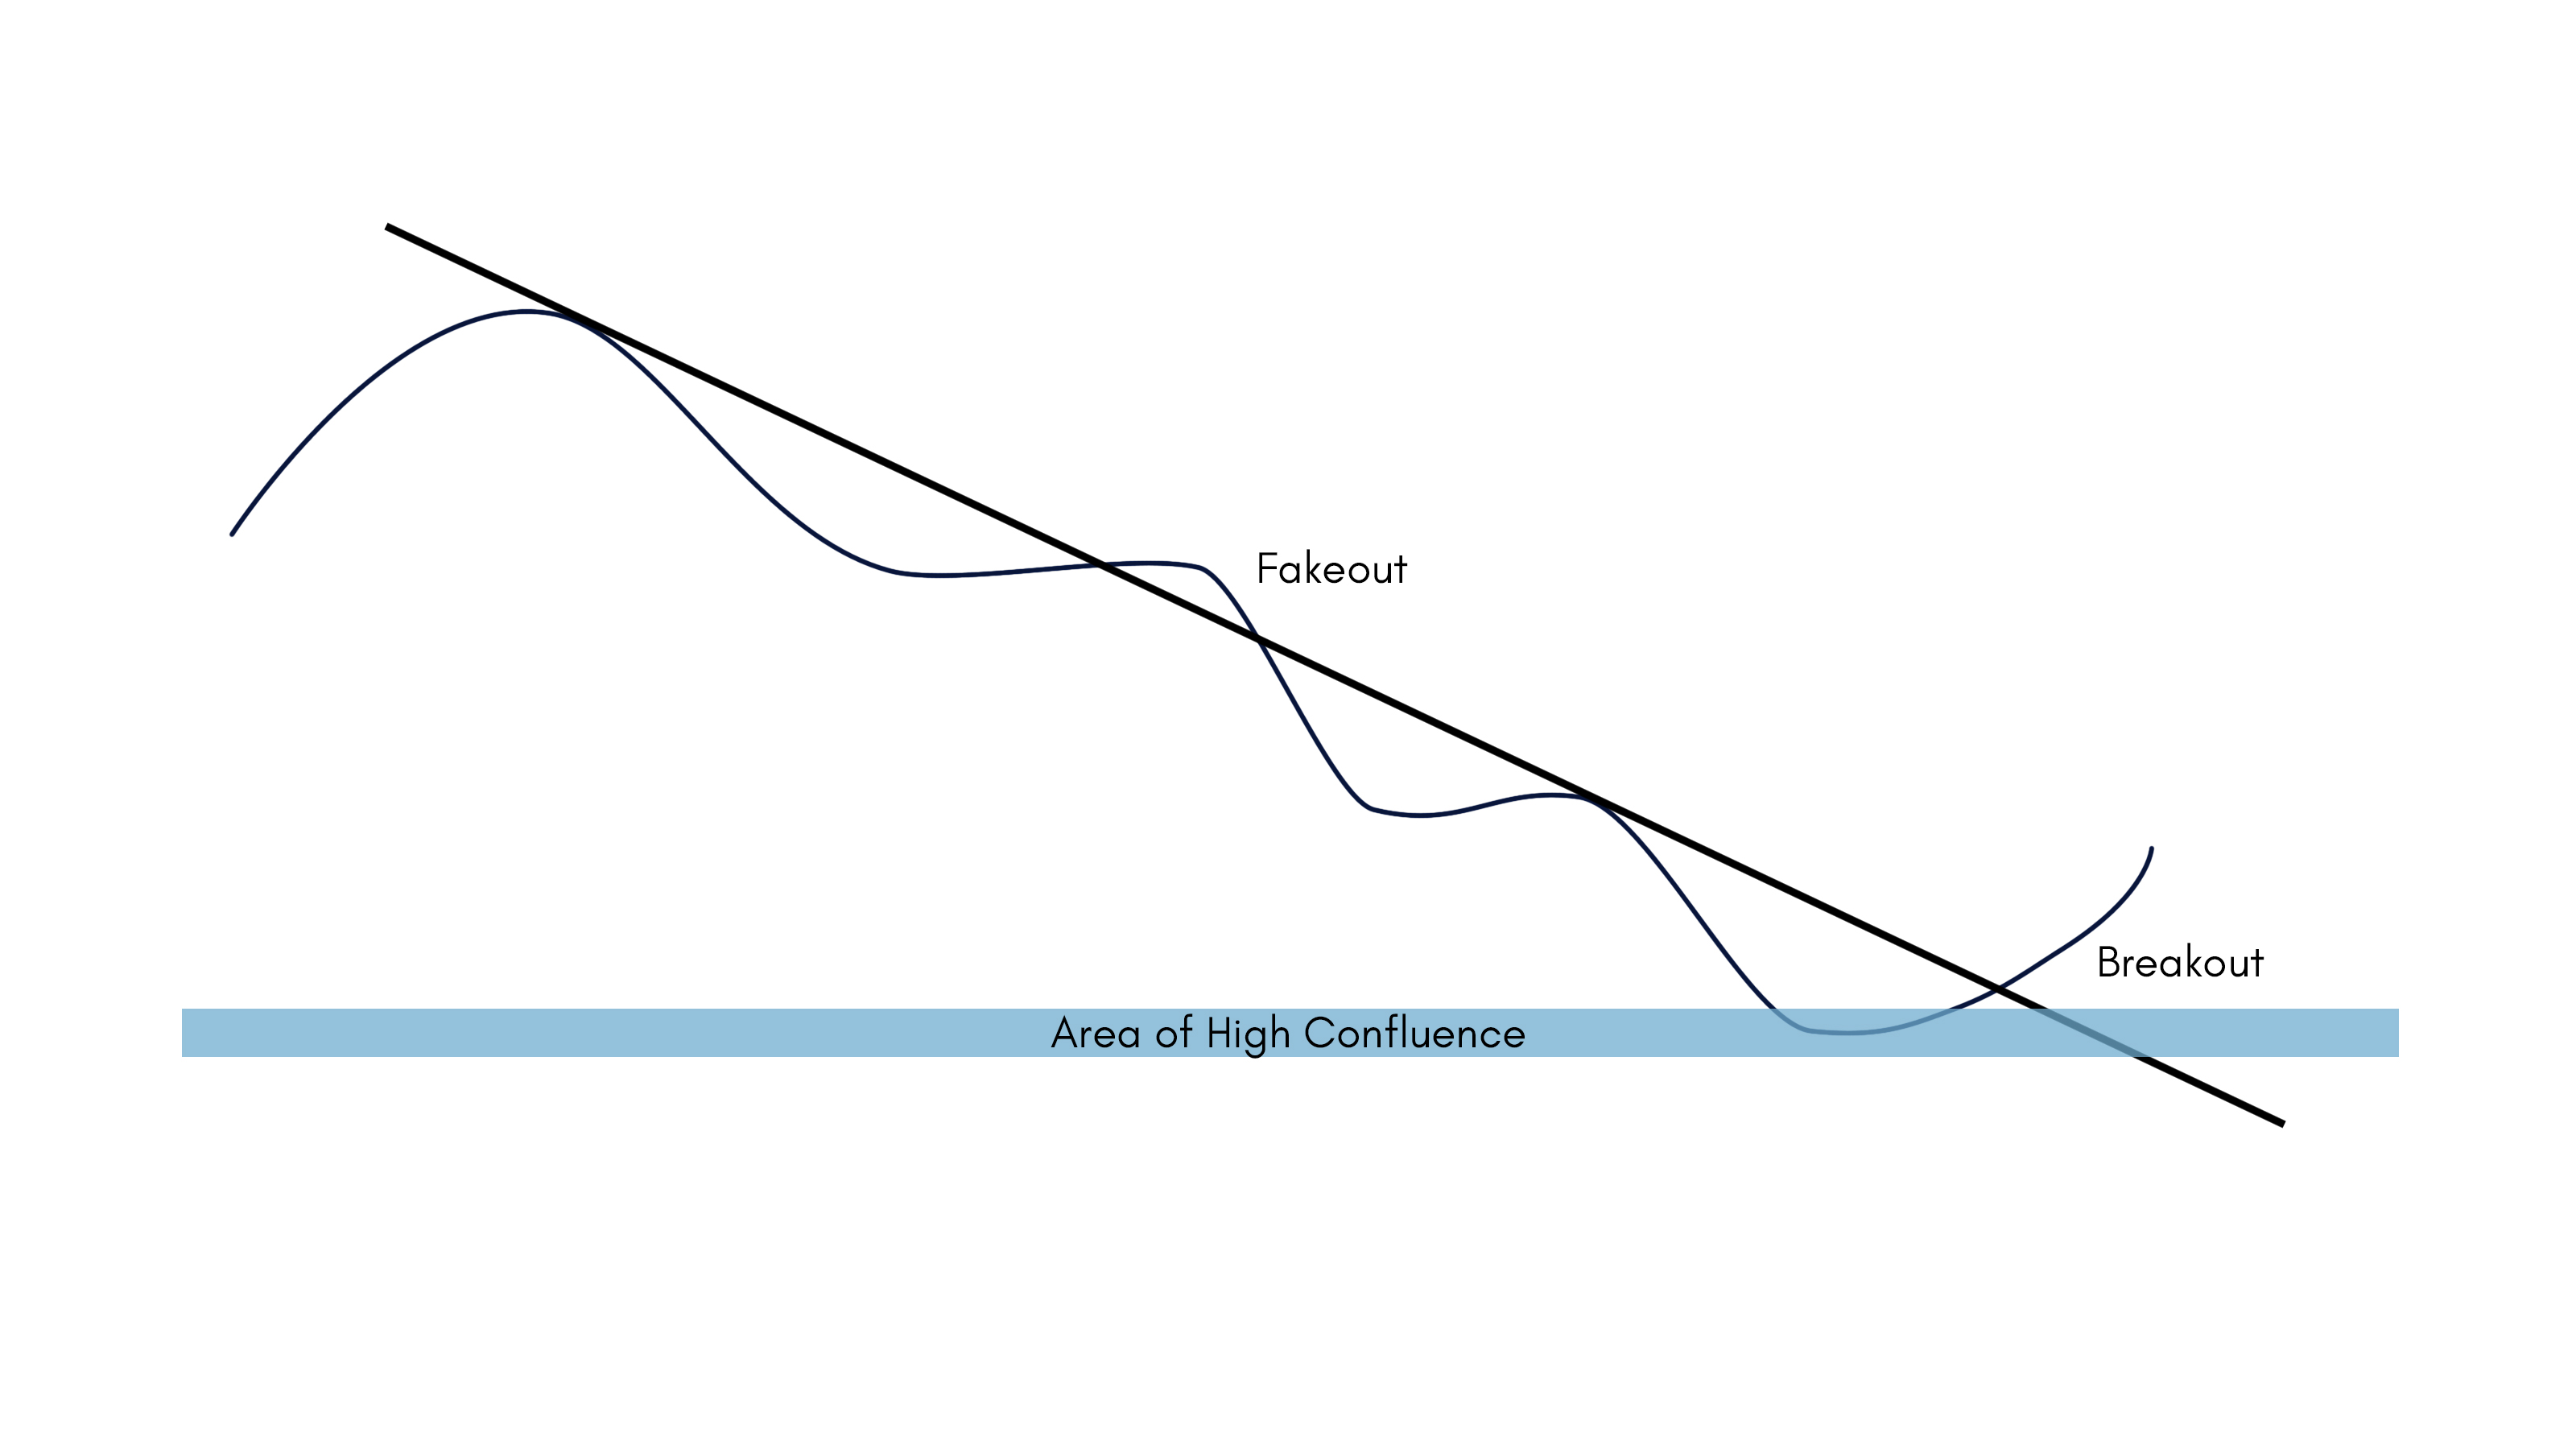
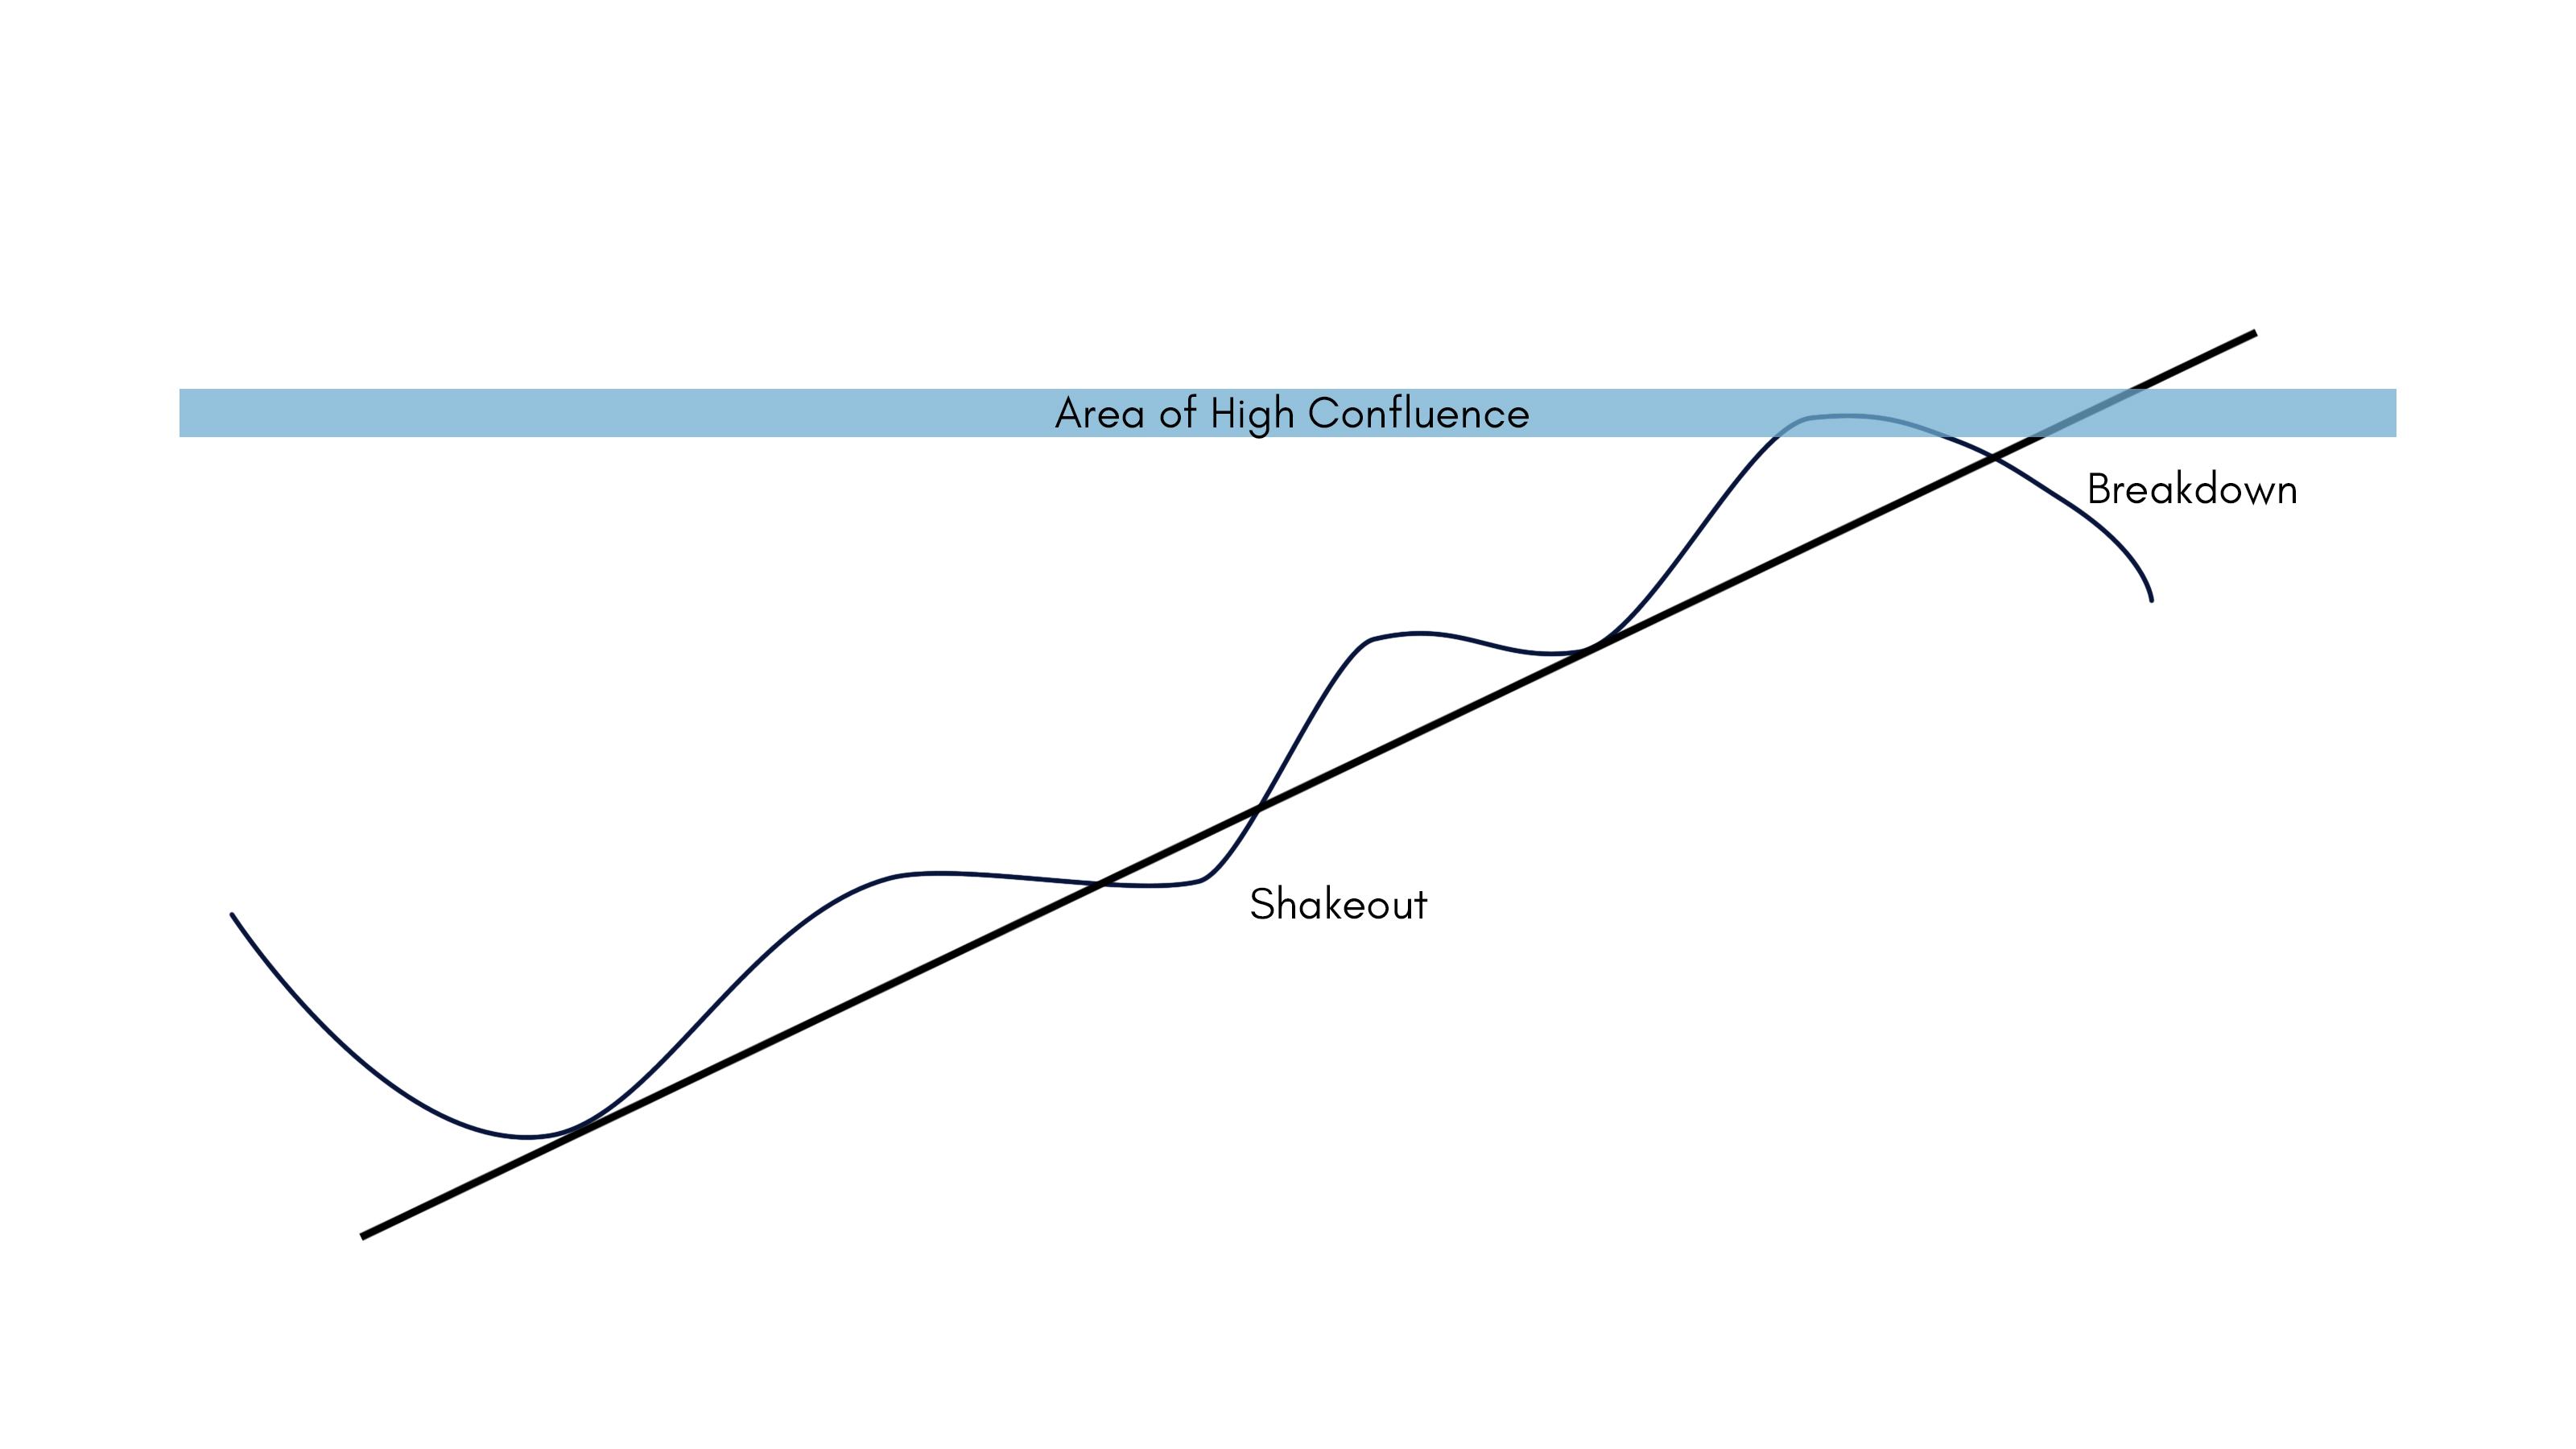
If you are a technical trader, chances are, the trendline is one of the first charting tools that you have learned to use. Its elegance comes from its simplicity: just trace the line and either follow the trend or wait for a breakout. However, like supports and resistances, trendlines are prone to both fakeouts and shakeouts. If you find yourself a constant victim to these fakeouts and shakeouts, then maybe your trendline strategy is missing the most important component: confluence.
In the world of trading, confluence refers to the convergence of different trading strategies. An example would be a set of moving averages, structural supports, and fibonacci retracements all indicating the same critical level for a certain stock. This critical level is often referred to as an area of high confluence. The idea behind the importance of an area of high confluence banks on the fact that different traders use different trading strategies.
From time to time, a high number of traders will consider a price level critical in accordance with their strategy. Once the price reaches this level, there will be a surge in the number of buyers/sellers since a lot of traders consider the price as a critical level. In a nutshell, areas of high confluences often equate to higher probabilities.
Incorporating areas of high confluences with your trendline strategy is as easy as making sure that the price touched an area of high confluence before approaching a trendline. This removes the small errors from mistakes in drawing your trendline as well as irregular market behavior.
Essentially, the key takeaway is that trendline breakouts and breakdowns are invalid if the price did not come from an area of high confluence prior to the breakout/breakdown. This strategy goes well with both breakout trading and trend following since a breakdown from the trendline without a bounce from an area of high confluence is probably a shakeout and not a trend reversal.
Fakeout vs BreakoutShakeout vs Breakdown
Areas of High Confluence can be composed of (but not limited to) any of the following:
Chart patterns
Range support and resistance levels
Moving Averages
Bollinger Bands
Ichimoku Clouds
Fibonacci Retracement Levels
It is important to note that for your trendline strategy to be effective, you should not only consider areas of high confluences but also the plotting of the trendline itself. The price should touch the trendline at least two times, the more touches, the better. Including the wicks depends entirely on your judgement as a trader as well as the “DNA” of the historical behaviour of the stock. With all this said, let’s head on to some examples.
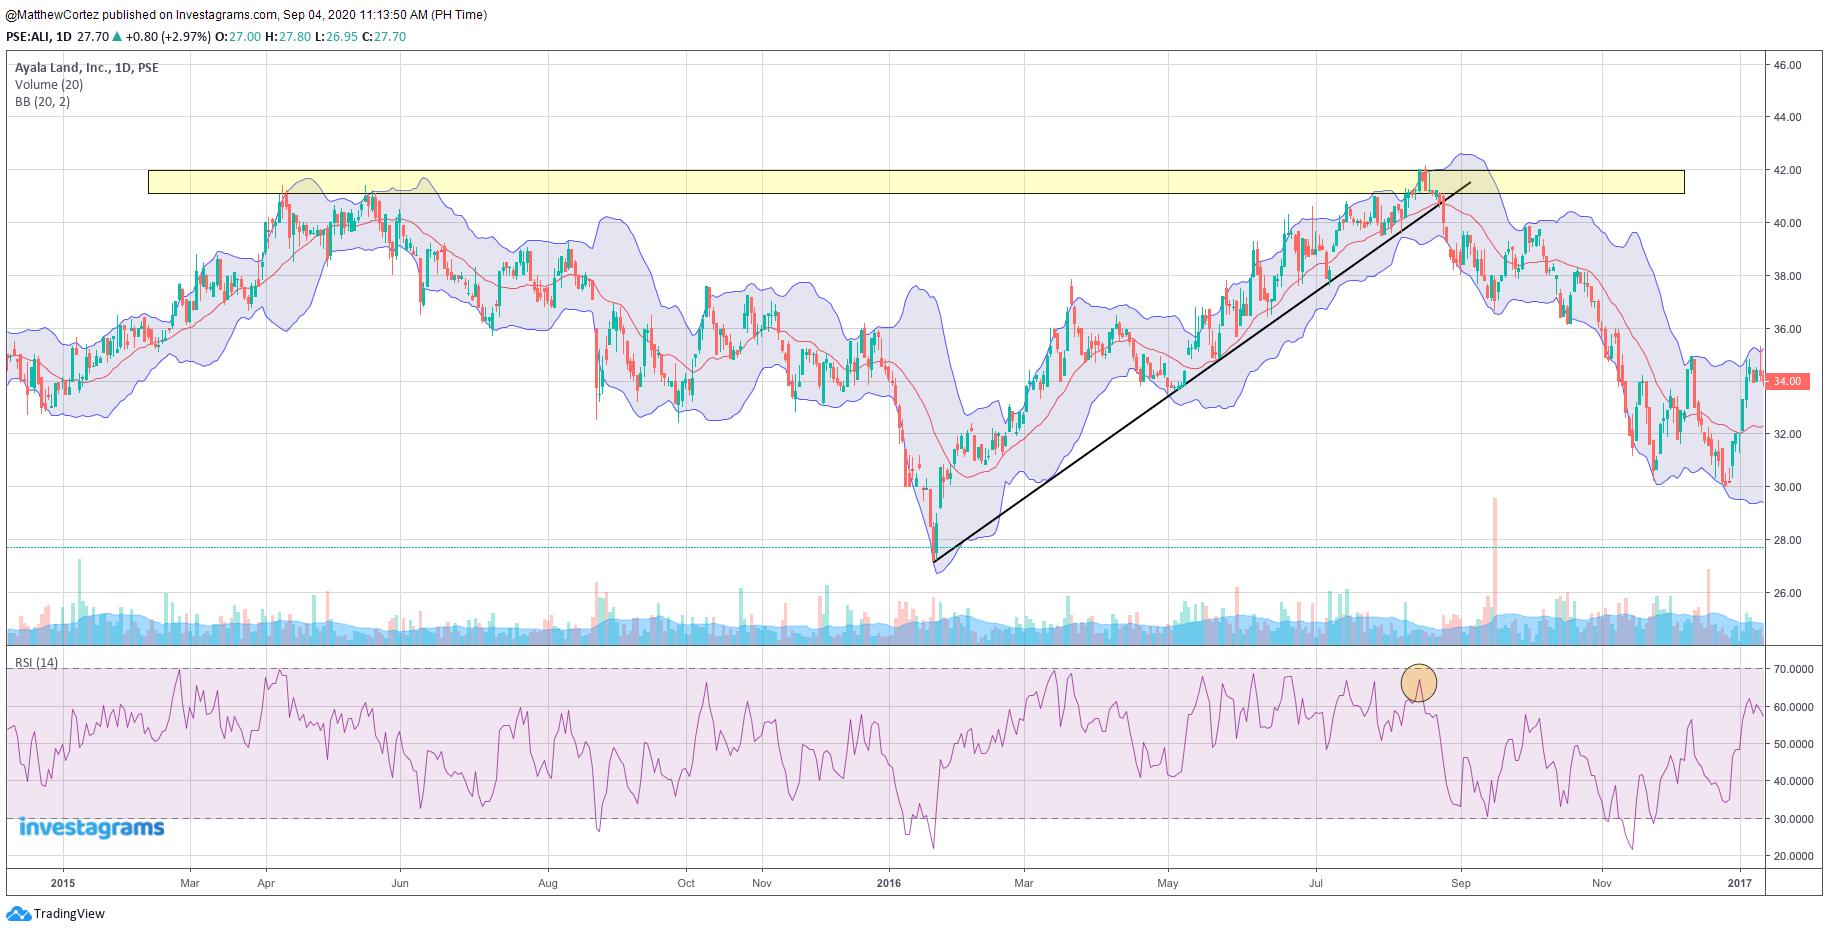
$ALI [DAILY][2016]
In the photo above, there is a defined trendline on the daily chart of $ALI. We can see that the 40 price level is an area of high confluence because of the following factors: (1) it is a psychological resistance, (2) it is the high of the previous uptrend, (3) the price is already at the top of the Bollinger bands, (4) the RSI is near overbought levels.
Because the price bounced from an area of high confluence before breaking the trendline, there is a high probability that the price action is a breakdown and not just a shakeout. As we can see through what happens next, the move is in fact a breakdown of the trendline.
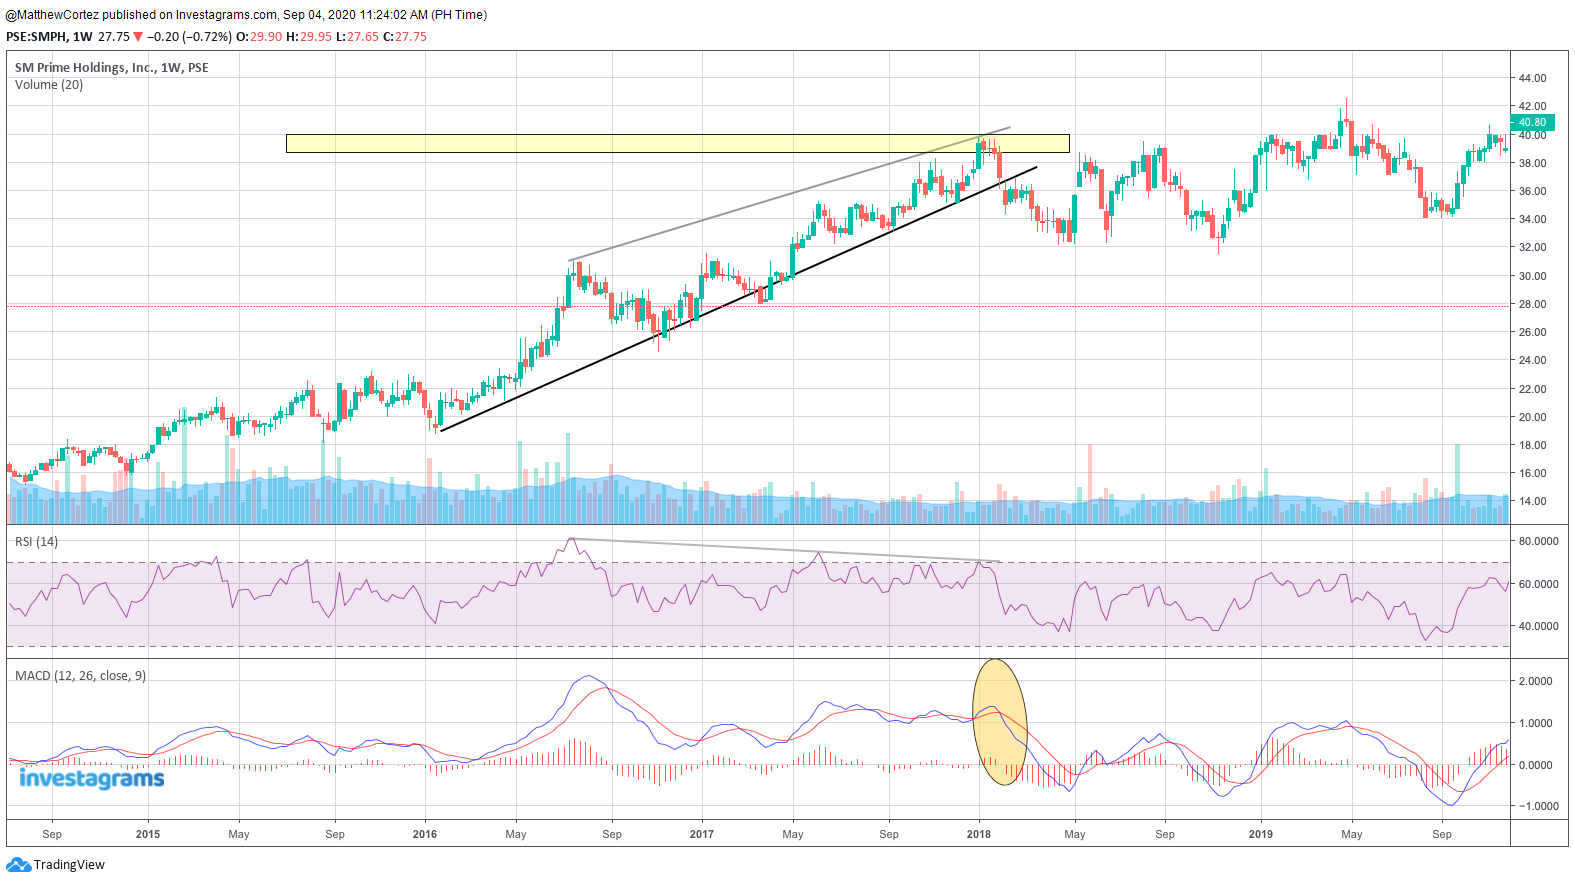
$SMPH [WEEKLY][2016-2018]In the case of $SMPH, the 40 price level serves as a psychological resistance which the stock tried to break prior to the breakdown from the trendline. Aside from a trendline break, we can see that the chart actually looks like a normal bearish RSI divergence. This validates our initial hypothesis that the move is a breakdown and not a shakeout. Aside from this we can see that the MACD is showing bearish signs with the histogram expanding below zero.
This trendline strategy shows us that although we should develop a trading system that is tailored to our specific needs, we should also be familiar with tools and indicators outside of our system. This helps us widen our understanding of where the market might be headed since we are not only tapping into one strategy, but to multiple ones at the same time.
The stock market is basically a psychological battle between traders of different niches after all. Normal trading rules (take profit, position sizing, and stop loss) still apply. All of these strategies will help you trade the confluence and hopefully take you one step closer to financial freedom.
Take your trading to the next level.
Join the INVESTACUP 2020 and get a chance to WIN OVER HALF A MILLION WORTH OF CASH PRIZES!
Never just invest, but invest with a clear mind, invesTHINK!
A good and great trader and investor must refrain from having a prejudice or biased preference. Lots of mistakes can also be rooted from a common mistake, which is then again, having a fallacious and biased concept about the stock market. Exhibiting and executing decisions based on emotions, peer influences, or your confidence towards the market, may happen at times. However, it is a sign of poor financial literacy towards the stock market.
What are your signals and indicators when you begin to enter and exit from the stock market? Were you just hyped among your peers? Have you monitored and checked the 20-day moving average and 50-day average? Here are the common biases you might encounter while creating decisions and analyzing your stocks. Who are you among these?
The Hyped: Social proof
One of the most common biases and errors occur are due to being hyped with the decision of peers and trends in the community. People tend to be under peer pressure and follow the idea of the majority. Which on the latter, we deem it to be true. Now, the wrong thing about this is that we overlook on the importance and essence of doing our own analysis. It’s just like eating the same flavor of ice cream with your barkada, not knowing that it contains peanuts, which you are allergic too! Do you now realize the danger?
The Follower: Confirmation bias and Groupthink
“Ano gagawin mo? Bibilhin mo na ba ngayon?
Down market diba, mag-aaverage down ka na ba ng stock mo?” This type of thinking shows a flaw, a misconception. Now following and agreeing turns out to be a bias if you try to prove and justify your decision based on the actions of someone else. You try to seek out the support and the same thinking among your peers.
Now with groupthink, just because everyone else says that “babagsak na yan, benta mo na” does not always mean they are right. Once you set foot in this bias, you lose the discipline and creativity of solving your own problems.
The Madame Auring, Manghuhula: Hindsight bias
Regrets and disappointments run fast, once you begin to suffer. Some investors and traders try to predict the movement, value, and the future of the stock based on their indicators. “All time low siya noong 2020, 10 pesos na lang siya. Ngayon 11 pesos na lang, bilhin ko na ulit!” The misleading factor on this is that, you tend to look for a similar cause that would make you react whenever the market crashes. You try to create your own predictions and make poor decisions whenever a certain event have occurred. To avoid this, always examine, record, and journal your outcomes.
The Blind: Clustering Illusion
In order to analyze charts, we use several indicators such as candlestick patterns, moving averages, RSI, volumes, and support and resistance. It is also necessary to check on the historical performance of the stock, may it be a daily, weekly, monthly, or yearly basis. However, clustering illusion happens when people tend to become oversensitive and seeing patterns where actually none have existed. Is it possible? Yes. If a trader or investor sees that the market structure repetitively illustrates higher highs, higher lows, higher highs, higher lows, the investor or trader may think that the market is going uptrend. It may seem like it, but always be cautious on the movement. Never create assumptions based on seeking certainty on your own perception.
Conclusion
Always be grounded with a strong foundation of principles and rules, in dealing with the stock market. Decision making will always be difficult, and that should be recognized. However, to be able to create a sound decision takes a lot of learning and re-learning. Always have a discipline in your study routines. And one day, you will achieve success too.
Are you up to the challenge of becoming the Champion of the Biggest Trading Competition in the Philippines? JOIN THE INVESTA TRADING CUP 2020: BOUNCE BACK CHALLENGE.
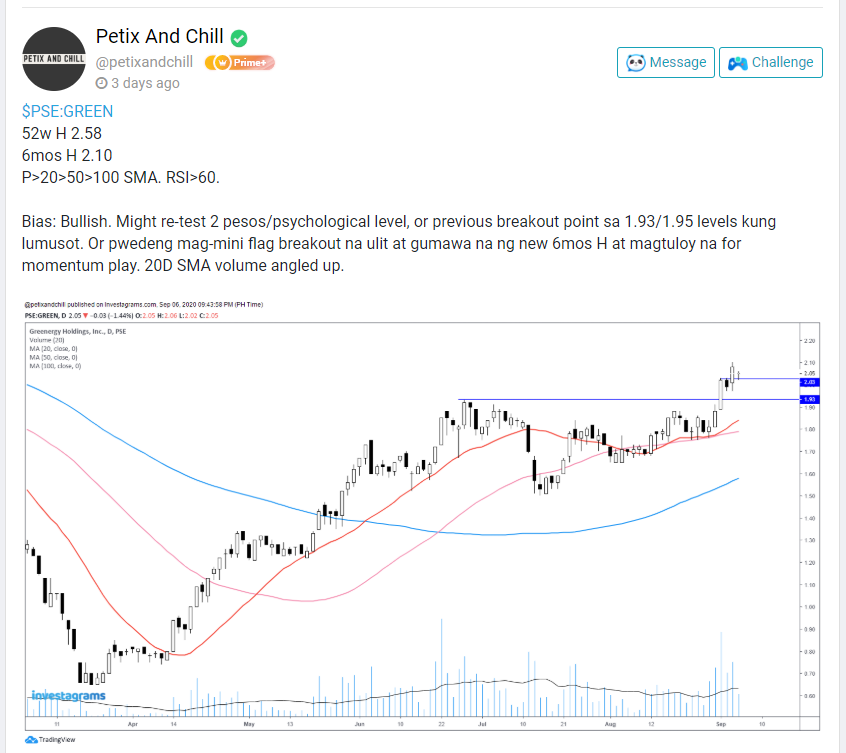
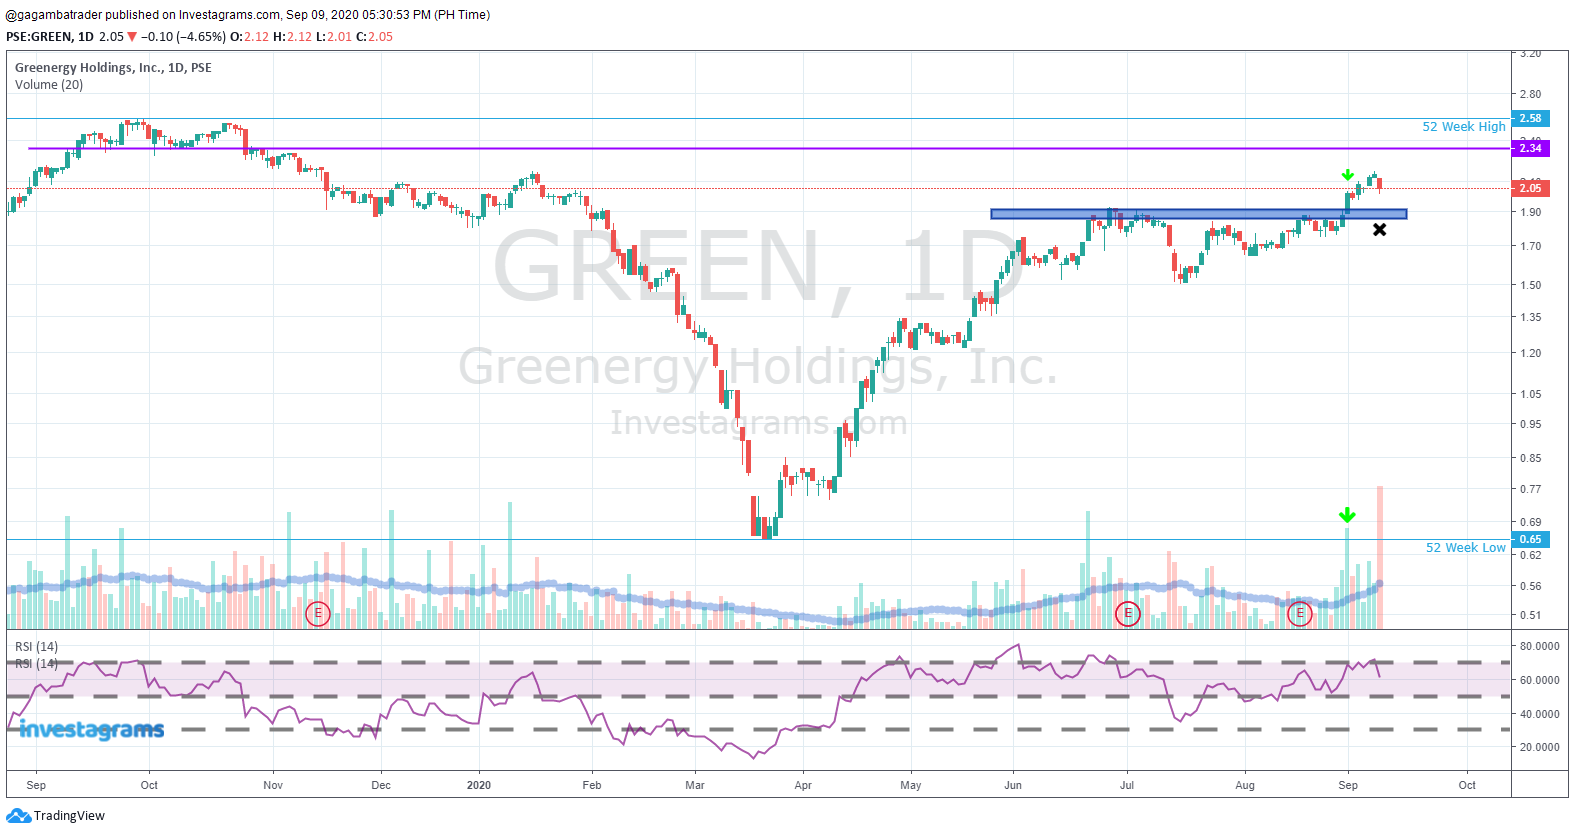
As the local index found support at the 5700 levels, the $PSEi presented numerous trade opportunities to select from. Petix and Chill (@petixandchill) was able to spot one of those potential leaders — Greenergy Holdings, Inc., or $GREEN. This trader is an active member of the Investagrams community who endlessly provides his analysis and insights focusing on the local market.
As seen in the technicals of the said stock, this name formed an ascending triangle pattern. This pattern resembles a triangle or flag that exhibits higher lows in price in confluence with a resistance level from a recent pivot high. While the stock was forming a base, it was supported with dried-up volume. Furthermore, it was also hovering above RSI (14) 50, which further solidified the creation of the said base.
A breakout of the 1.95 pivot area was an ideal buy point as it was the confirmation of the said bullish pattern accompanied with massive volume. It is a low-risk, high-reward trade, as the stop loss levels for the said breakout point is around 1.85 (-5%), and the take profit areas could be the structural resistance at 2.35 (20%) and near the 52-week high (28% to 30%). As of this writing, the stock ended the trading session with a loss. This could be an opportunity to wait for a pullback at the previous breakout point.
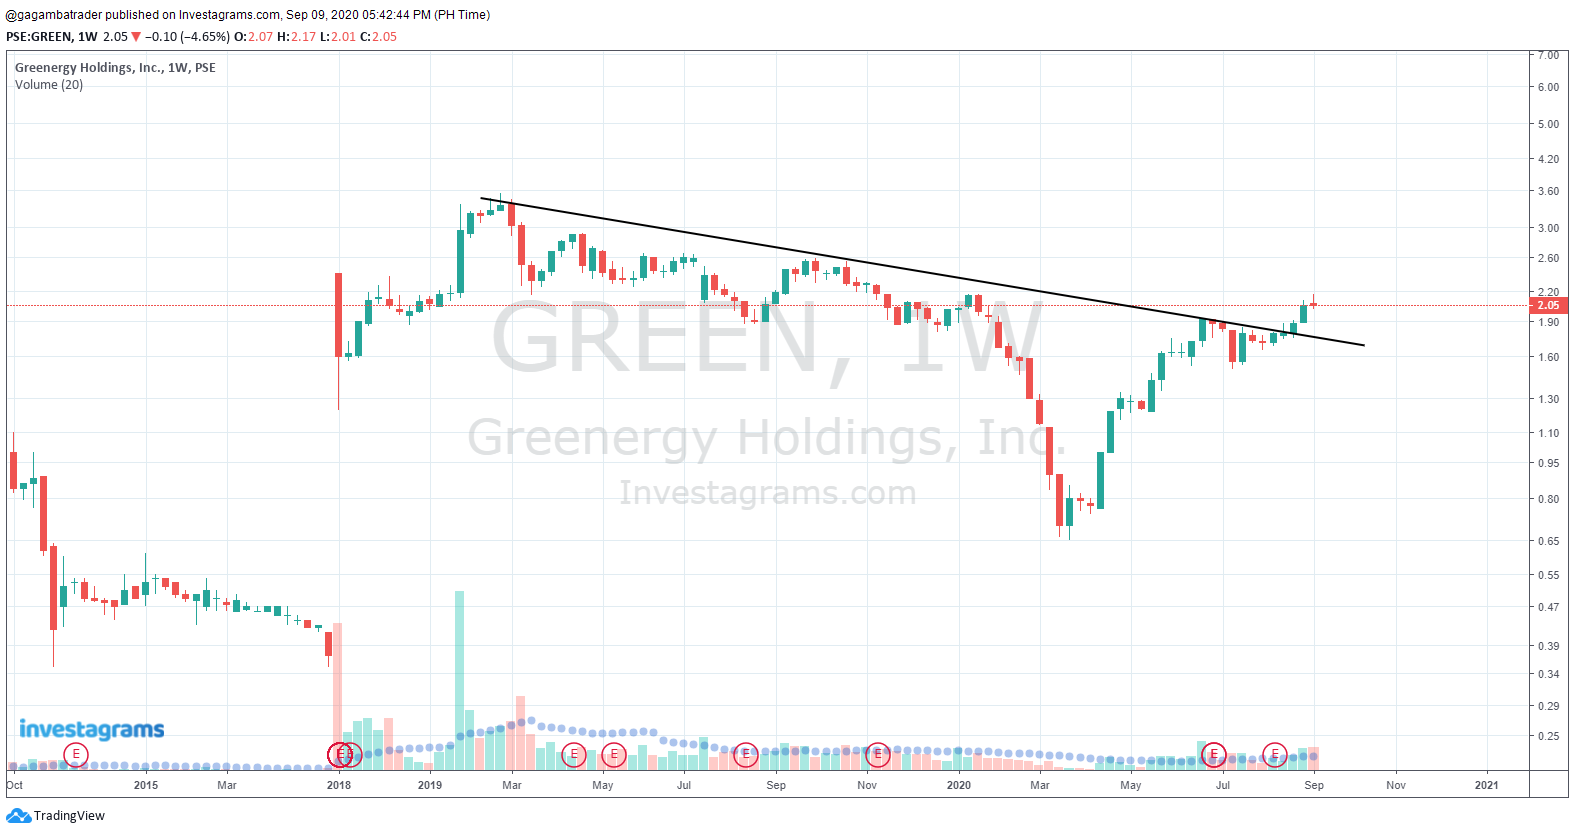
To further sustain its dominance, this stock should hover above the 1.9 to 1.95-peso area. In the bigger picture, the stock seems to be on the right track as the breakout of the said pivot was also in conjunction with the breach of the longer-term trend line resistance as seen in the weekly chart.
The epitome of professional trading is the ability to be disciplined and patient when it comes to an emerging name. Waiting for the right moment to strike, whether it would take weeks or months, is an essential skill that we must incorporate in our trading arsenal.
Congratulations to those who were able to maximize the technical swing of $GREEN. Lastly, kudos again to Petix and Chill a.k.a. @petixandchill for sharing his execution. Your FREE 1-Month InvestaPRO access is on its way!
Take your Trading to the Next Level.
JOIN THE INVESTACUP2020 and have the chance to WIN MORE THAN PHP 300,000 IN PRIZES!
“Successful traders know that a consistent and systematic review of their daily trading activities is the direct path to growing and improving”
– Van K. Tharp
While looking at the movements of your charts, play the Reflection song by Lea Salonga and sing along with these lines: What is that trade I see? Staring straight, back at me. Why is the reflection something I don’t want?
Reflecting is not only done for the state of your mental health, to have a clear mind, or even to create better decisions. Reflecting must also be done when investing and trading to create sound and correct decisions. In order to do this, you must have a good, healthy, and peaceful environment. At the same time. It is very essential to have your thoughts and actions documents. Just like how you journalize the things you do every day; you must also journalize your investments and trades!
For investors and traders, journalizing helps develop a more efficient and effective strategy in dealing with the market. With journalizing, you can see your mistakes clearly and what were the principles and rules that you have went against. At the same time, you can look at where you have excelled in! That’s the great thing about journalizing, it gives a peace of mind and determines the areas where you need to improve on. It instills the value of sticking with the rules and principles in beating the market.
One thing to know about journalizing your trades and investments is that it develops the discipline and habit of documenting every transaction that you have made — from buying to selling, and even checking the chart movements.
Here are the things you should know when creating a journal for your trades.
Step 1: Determine what stock to purchase and what type of stock
It’s a must to know the stock you will be purchasing. But not only that, you must know what stock you will be purchasing. Is it a speculative stock? Defensive? Cyclical, blue chips, or tech stocks? This initial step already determines if you are a good trader. A good trader knows where he or she invests in. You can use either technical or fundamental analysis, or combination of the two. Remember, the organization of your trades starts on your discipline in analysis.
Step 2: Listing the quantity of shares bought
Do not rely on the information and journal given by your stock brokers. Record and list down the quantity of shares bought so you can be fully informed about your total investment. This will help you note if have already gained or made losses in your portfolio.
Step 3: The buy and sell point
This refers to the entry/exit point at which you decide on the price you would buy or sell your stock. To limit losses, you must note your target profit and stop loss. The benefit and essence of this step is to know the progress or status of your holdings.
Step 4: Type of time holding period
Determine on how long would you be holding the stock. Would it be for 3 weeks? For 2 months or 3 years? Decide whether you would be holding it on a short, medium, or for long term.
Step 5: Trading Strategy
Trading strategies and holding period goes hand on hand. Journal whether you will be strategizing it with position trading, swing trading, day trading or scalping. Being informed with your strategies will help you on your decision making
Step 6: The buy signal and the reason
Journal the signals and indicators at which made you buy a stock. Were you just hyped with the news or alongside with the comments of traders? Always make a logical and clear decision with a good foundation of analysis, not with feelings. This will also help you understand more the importance of understanding the market structure and indicators. Was there a breakout? A hammer candle stick? A double bottom or an ascending triangle?
Step 7: Date when sold
Consider all dates important, as if they were your anniversary or even your birthday! Treat this as an important component of your trade for it will determine if you broke your rules and time frame.
Step 8: The sell signal and the reason
Selling your stock also goes hand on hand with your time frame. Determine what was the reason for selling. Have you reached your stop loss or target profit? Was there a market breakdown or have you foreseen that the market is on downtrend?
Step 9: Principles and Results
As much as every step is important, you would and must also see the results of your trades! Have your stocks been performing well? Have YOU been performing well? Were your imposed rules and principles followed? If not, what were the results of your non-compliance with your principles?
Conclusion
Consider every step important. With the discipline of journaling, you will always continue to grow and develop the areas you need to improve more!
Take note: You do not just record your success but failures as well! TAYOR!
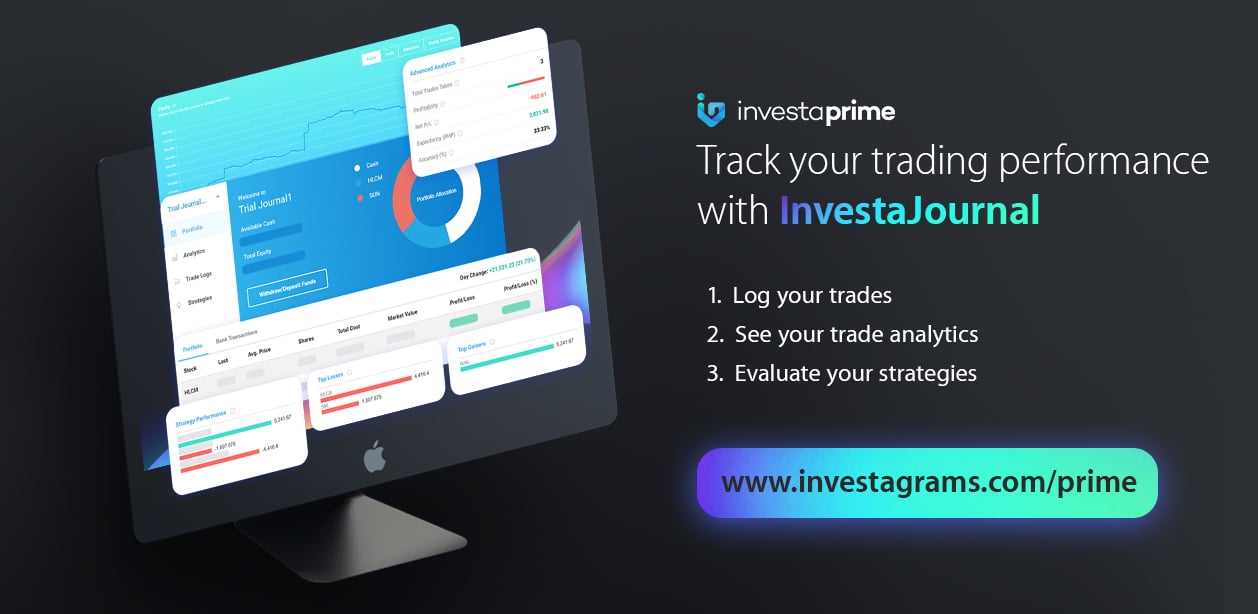
Track your trading performance with InvestaJournal. Now available on InvestaPrime’s FREE 14-DAY TRIAL!
Click on the photo to get your InvestaPrime FREE ACCESS.