
Jose Marco, a.k.a @jomarc, takes the spotlight for this week’s featured trader! Spot how he used basic support and resistance (or S/R), Moving Averages, and an Exponential Moving Average to identify a potential breakout in $GSMI and determine a clear exit point.
Using multiple indicators in combination can assist traders in making more informed and unbiased trading decisions by providing complete and thorough market analysis. This approach helps filter out false signals and identify high-probability trading opportunities.
Let’s take a look at how @jomarc used these indicators to his advantage.
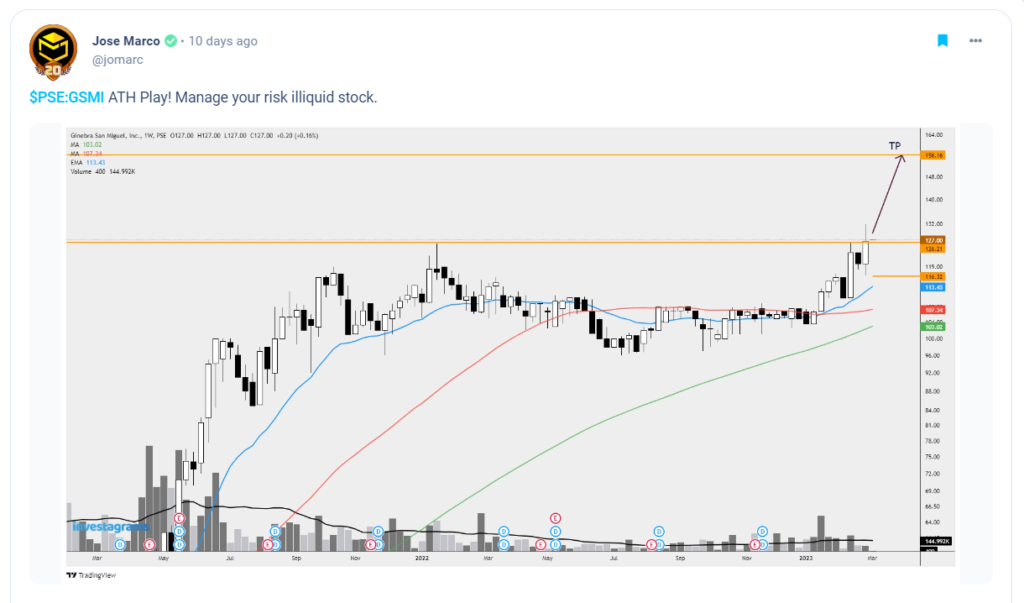
What can be seen in this chart is how $GSMI is trying to contest its local resistance at the 126 level. When a stock is challenging the resistance level, it means that its price is nearing a level where there has been a strong history of selling activity. Traders pay close attention to the resistance level to determine if the stock’s price will break through or reverse direction. If the price breaks above the resistance level, it may indicate a potential bullish trend, whereas if it breaks below, it could signal a bearish trend. As a result, the resistance level is a crucial factor to consider when making trading decisions.
The stock’s uptrend is supported by the presence of the moving averages and exponential moving average, which can be observed below the candle. This suggests that buying the stock may be a favorable option for traders as it could potentially increase in value.
At the time of his post, $GSMI was trading around the 126 level. The stock surged in price a few days after and hit @jomarc’s target profit area after 3 days for a total increase of around 23%. It even exceeded the 156 level, peaking at 160 for a total increase of 26% in four days and forming a new all-time high.
TECHNICALS OF THE TRADE
The three most prominent indicators that @jomarc used in his post are the S/R, Moving Averages, and the Exponential Moving Average.
@jomarc utilized his chart’s support and resistance levels to assess the potential movement of $GSMI and identify points where momentum could slow down. These levels are essential in determining breakout and exit points as they indicate where the market will likely move. By recognizing the critical support and resistance levels, traders can better understand the market dynamics and make informed trades.
Moving averages are a tool traders use to identify market trends by smoothing out price fluctuations of financial assets such as stocks or currencies. They calculate an asset’s average price over a set period, giving a better understanding of its overall price movement.
Exponential moving averages are a type of moving average that places greater emphasis on recent price movements compared to older ones. This means that they are more responsive to changes in price and react more quickly to market fluctuations than simple moving averages.
To simplify, while both MA and EMA are types of moving averages, EMA places greater emphasis on recent price movements and responds more quickly to changes in the market than SMA.
FUNDAMENTALS OF THE TRADE
Ginebra San Miguel Inc. (GSMI), the alcoholic beverages subsidiary of the diversified conglomerate San Miguel Corp., achieved its highest-ever profits in 2022 due to robust sales.
Despite facing challenges caused by global supply chain disruptions, high inflation, and a weak peso, the company’s net income increased by 9% to P4.5 billion. Total sales grew by 11% to P47.3 billion, fueled by strong volume growth and higher selling prices.
According to GSMI President and CEO Ramon S. Ang, the company’s ability to grow amidst adversity demonstrates its resilience and strength. Income from operations also increased by 13% to P6 billion, while earnings before interest, taxes, depreciation, and amortization rose by 7% to P6.7 billion.
GSMI’s board has approved the payment of regular cash dividends of P0.75 per share and special cash dividends of P1.75 per share to stockholders recorded as of March 24, 2023.
WHAT SHOULD BE YOUR NEXT MOVE
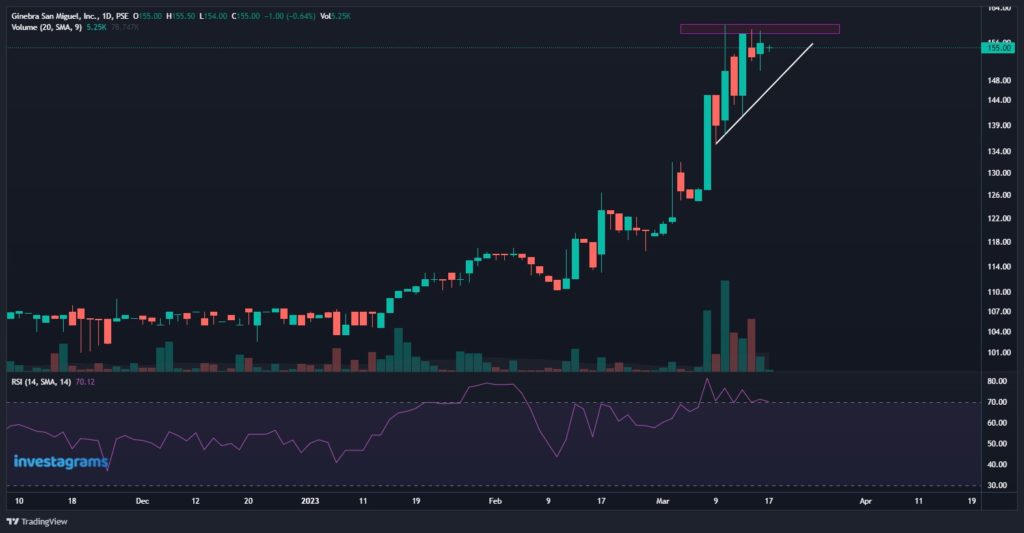
The stock’s chart is potentially forming an ascending triangle pattern, often resulting in an upward breakout. This means that if the stock’s price breaks above the upper trendline, it may be a signal to purchase the stock. However, it is crucial to wait for breakout confirmation before executing any trades. On the flipside, the RSI is also showing signs of the trend being overextended due to the bearish divergences that formed. Momentum traders could still look for a play here on the breakout. However, swing traders and trend followers would most likely get the most value by waiting for a pullback.
It is also important to note the importance of using other indicators in confluence with the pattern. When you combine the analysis of multiple indicators with the ascending triangle pattern, you may gain a more comprehensive and precise understanding of the market. This, in turn, would enable you to make well-informed trading decisions that minimize the risk of false signals and provide a more dependable trading strategy.
Once again, KUDOS to @jomarc for being this week’s featured trader! Enjoy your 14-day InvestaPrime Access and continue to be an inspiration to the trading community.
Join our Investa x XM TRADE AND WIN promo and win amazing prizes!
We’re giving away:
- Apple Airpods
- Huawei Matepad T10
- 50 USD
How to join:
1. Register an XM account here: https://invs.st/XMMarchGiveaway
2. Trade at least 0.01 lot size on any asset class (Stocks, Crypto, FX, or Commodities) from March 8 to March 31, 2023
View the full mechanics here: https://www.investagrams.com/daily/2023/03/trade-and-win-big-prizes-with-xm/
Don’t miss this chance to win these big prizes!