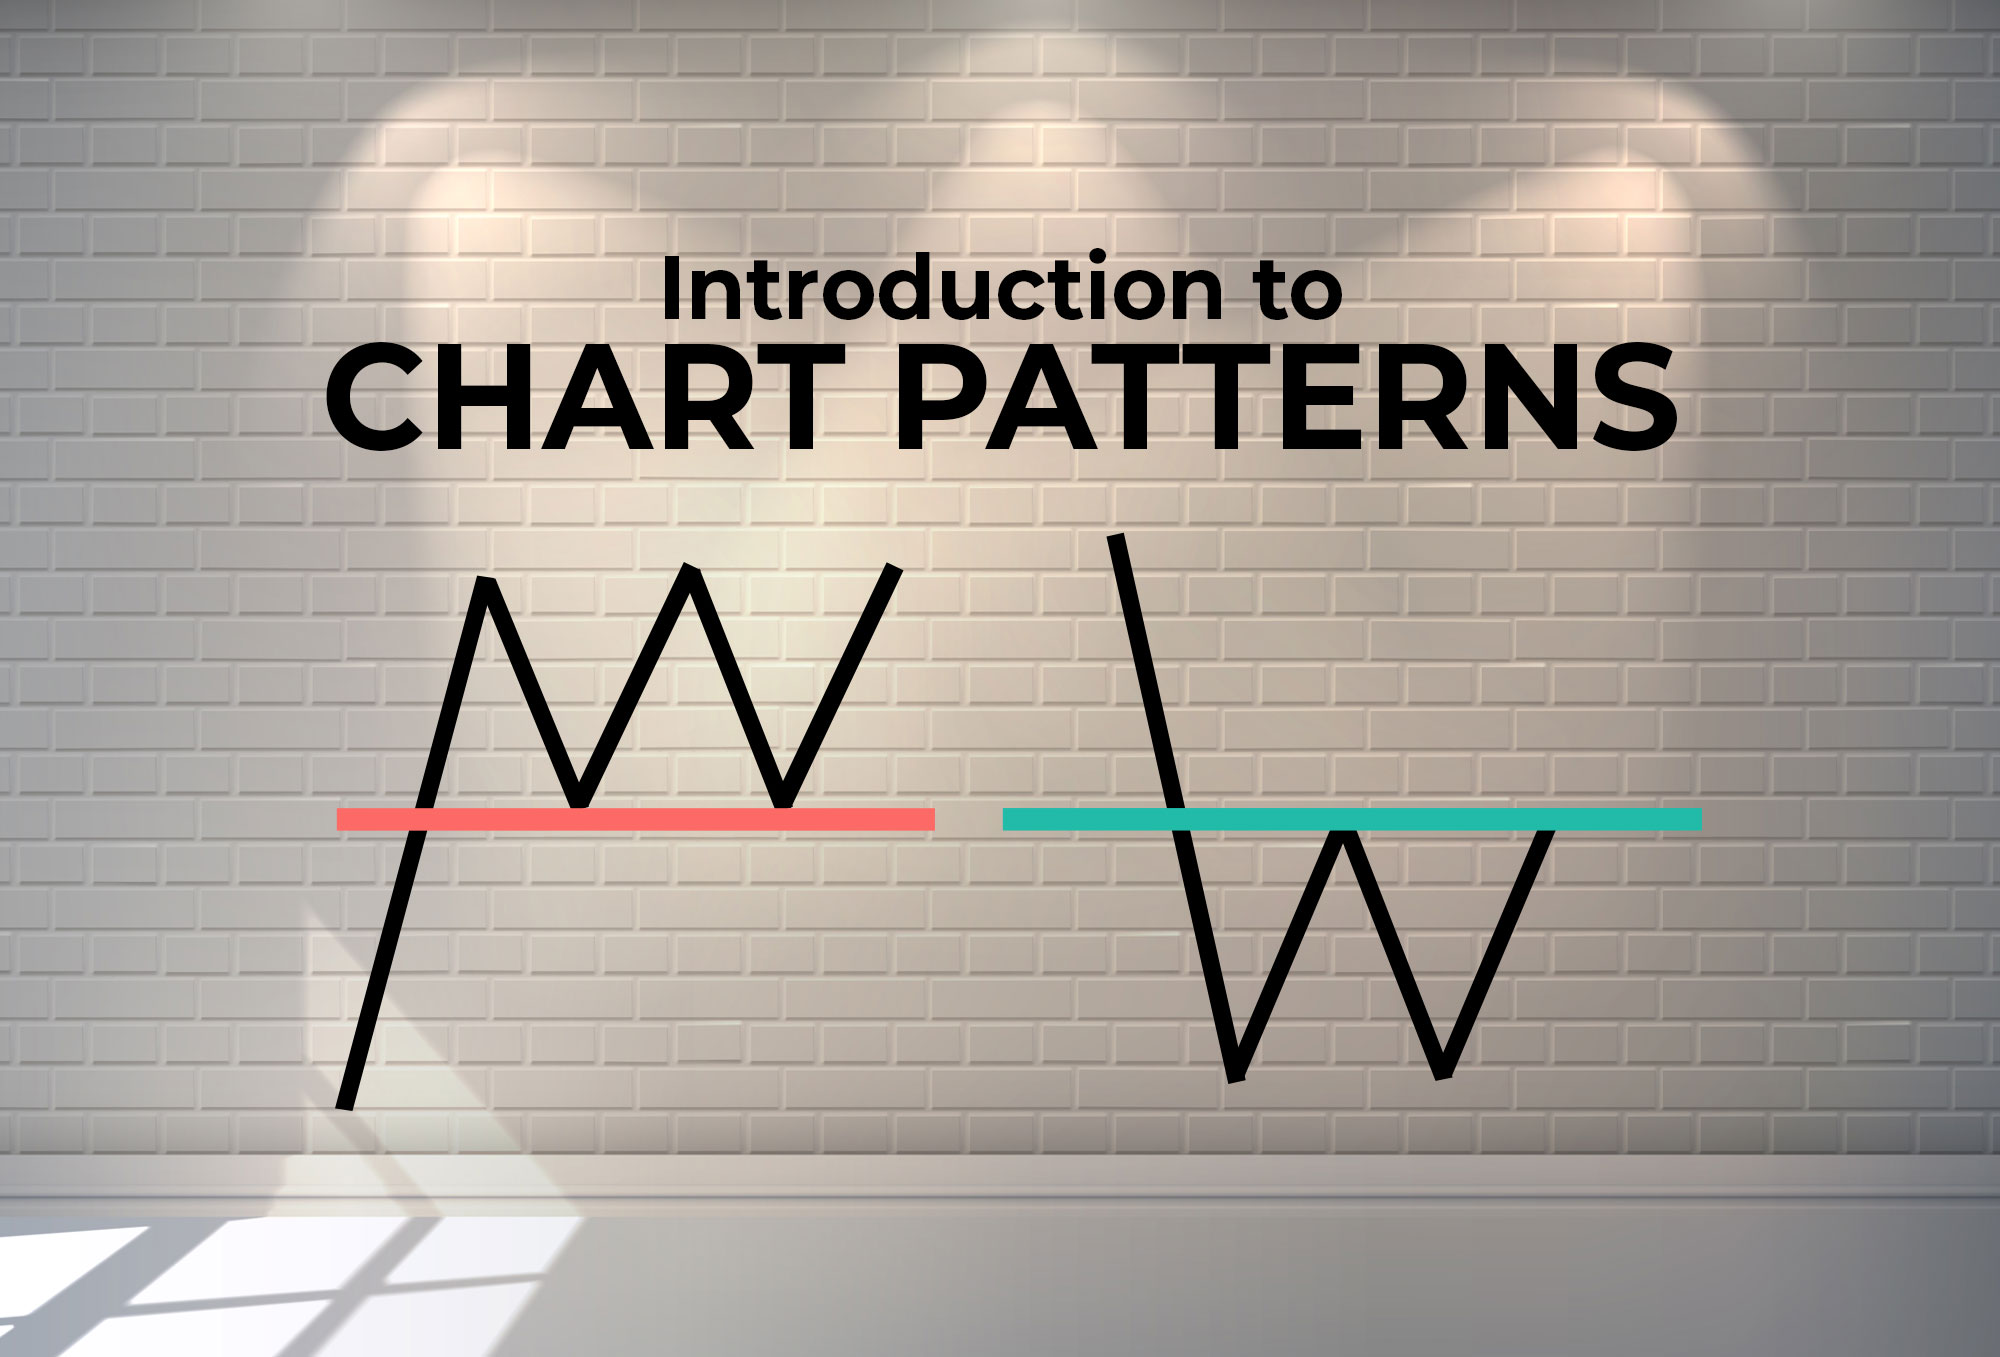
When trading on technicals, some traders consider chart patterns as of one the most effective trading tools in their set up as they are pure price-action. Traders look out for chart patterns or price formations to help them know if the odds are in their favor.
Chart patterns play a significant role in your ability to be more profitable in the market as it will give you an idea wha¬t to play and a chance to ride the breakouts, reversals, continuations, and many others. These chart patterns can occur in any given time frame such as intraday, monthly, weekly, or daily, as you will see in the following chart examples.
If you’re a new trader, there are loads of chart patterns you need to acquaint yourself into. Using real chart examples in the PSE, we’ll discuss how you can use some of these patterns to your advantage.
1. Head and Shoulders
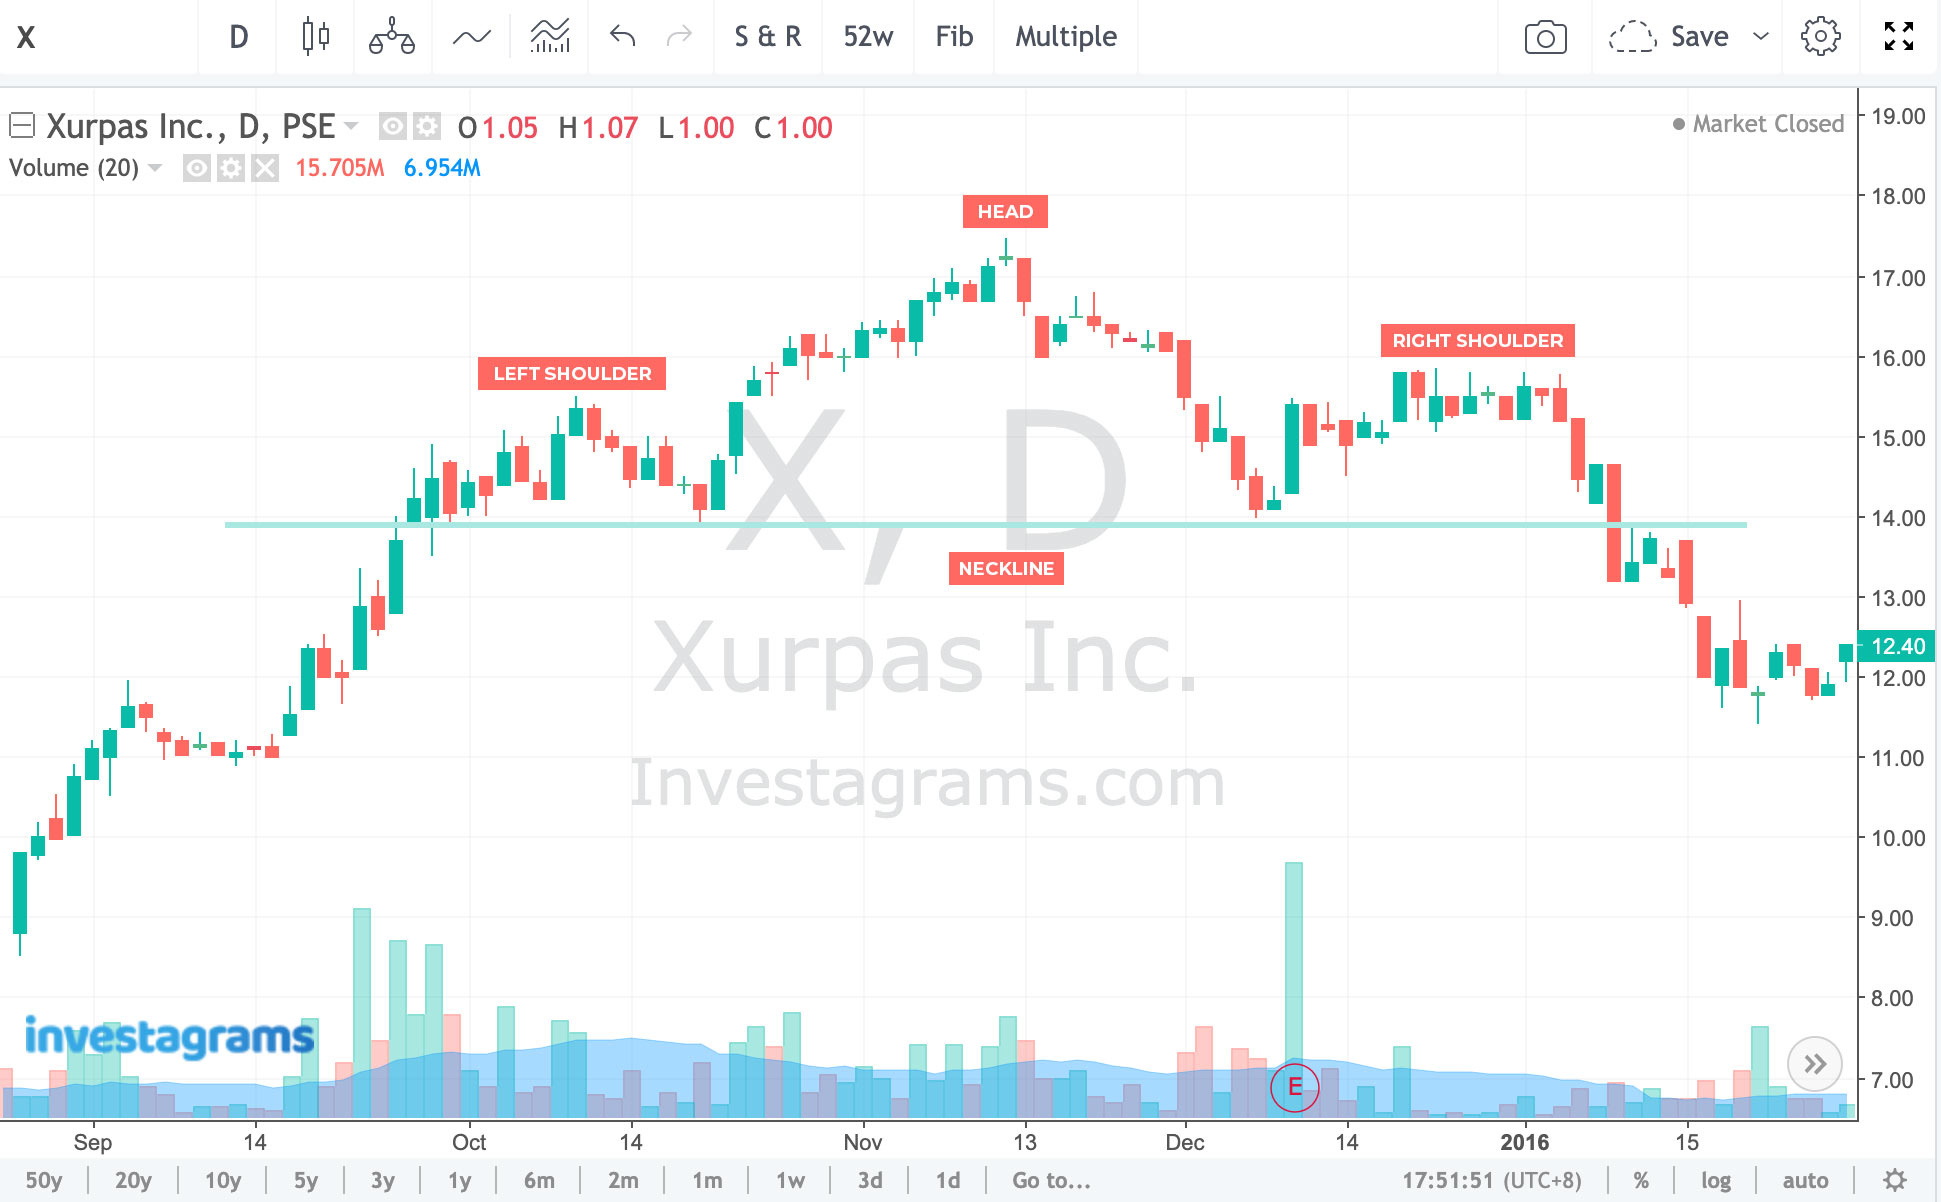
Head and shoulders is one of the most popular chart patterns among the list and is most likely to occur during the end of most bullish trends. It has four parts: the left and the right shoulders, head, and neckline.
Here’s the analysis behind the pattern using the chart above.
From the low (P8.50/sh) of the leftmost candlestick of the chart up until the highest traded price during November (P17.46/sh), we can see how $X (Xurpas Inc.) held a bullish trend that gained more than % in gains.
By placing our attention to the bullish trend pattern (identified by successive higher highs and higher lows), we can gauge a stock’s likeliness to continue its trend or be prepared if a reversal is looming.
$X did not create a higher low after retracing from its high of 17.46/sh, it would have been better if $X found support at the resistance (high) of the left shoulder for a classic price flip (support/resistance flip). The market required $X to find support at the same low of the left shoulder, forming the so-called neckline. This could be taken as an indication that the uptrend was weakening given that the retracement was deep (a steep -19% pullback). Sellers were prevailing during that time. For the right shoulder, we can see that $X didn’t create a higher high and didn’t test the high of the head. It then preceded to strongly breakdown the previous support (neckline) confirming the succumbing of the buyers to the sellers.
The key in this pattern is to look at how a stock creates its highs and lows during an uptrend and check if it breakdowns key areas of support.
2. Inverse Head and Shoulder
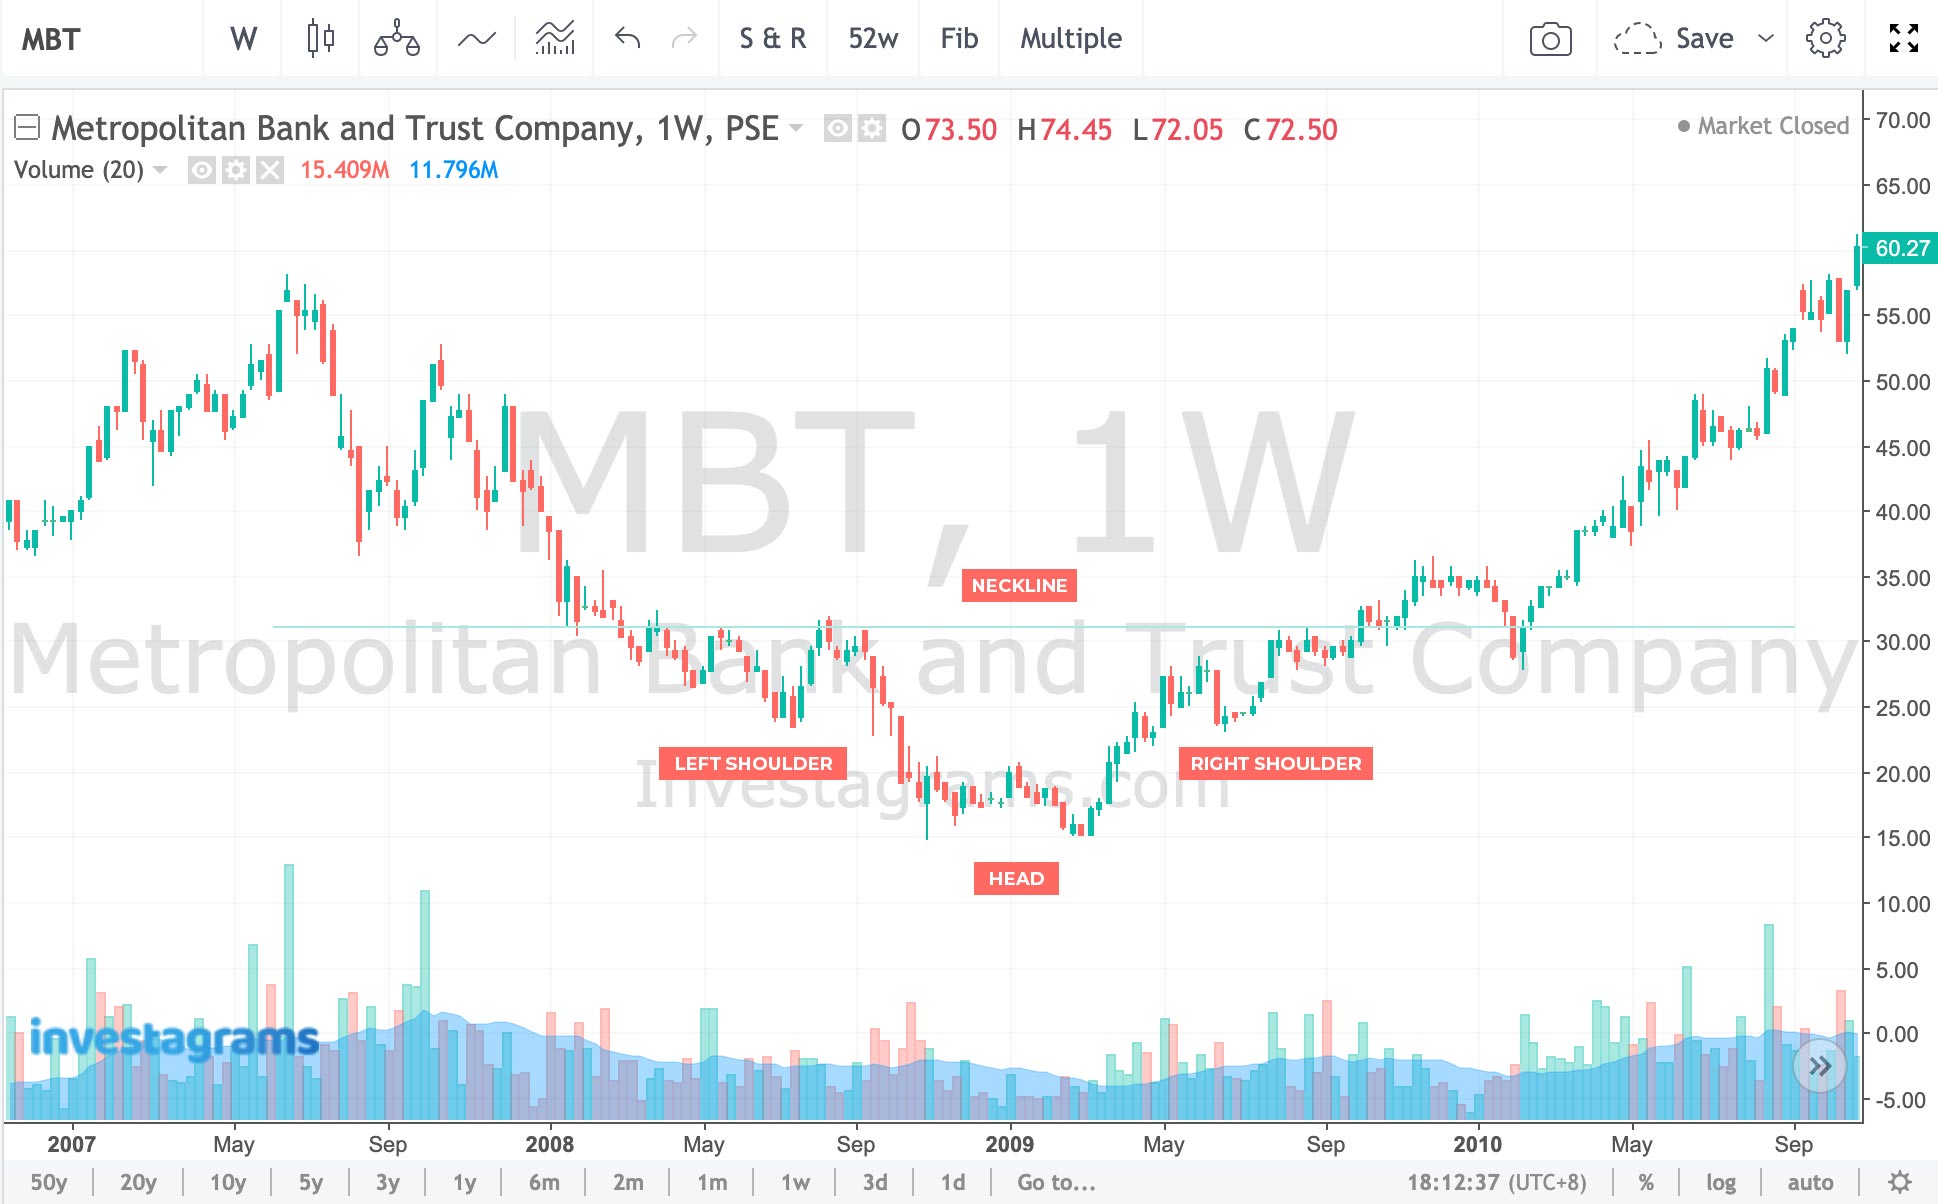
Inverse head and shoulders pattern, the opposite of the head and shoulders pattern (as shown above), also have the main three parts: left and fight shoulders, head, and neckline. This time, it’s an indication of a bullish reversal. See how each succeeding pullback after the head turns into a higher low, catapulting $MBT (Metropolitan Bank & Trust Company) to form new higher highs. After breaking the neckline, the banking company gained for as much as 94% up to the rightmost candlestick in the chart.
3. Cup and Handle
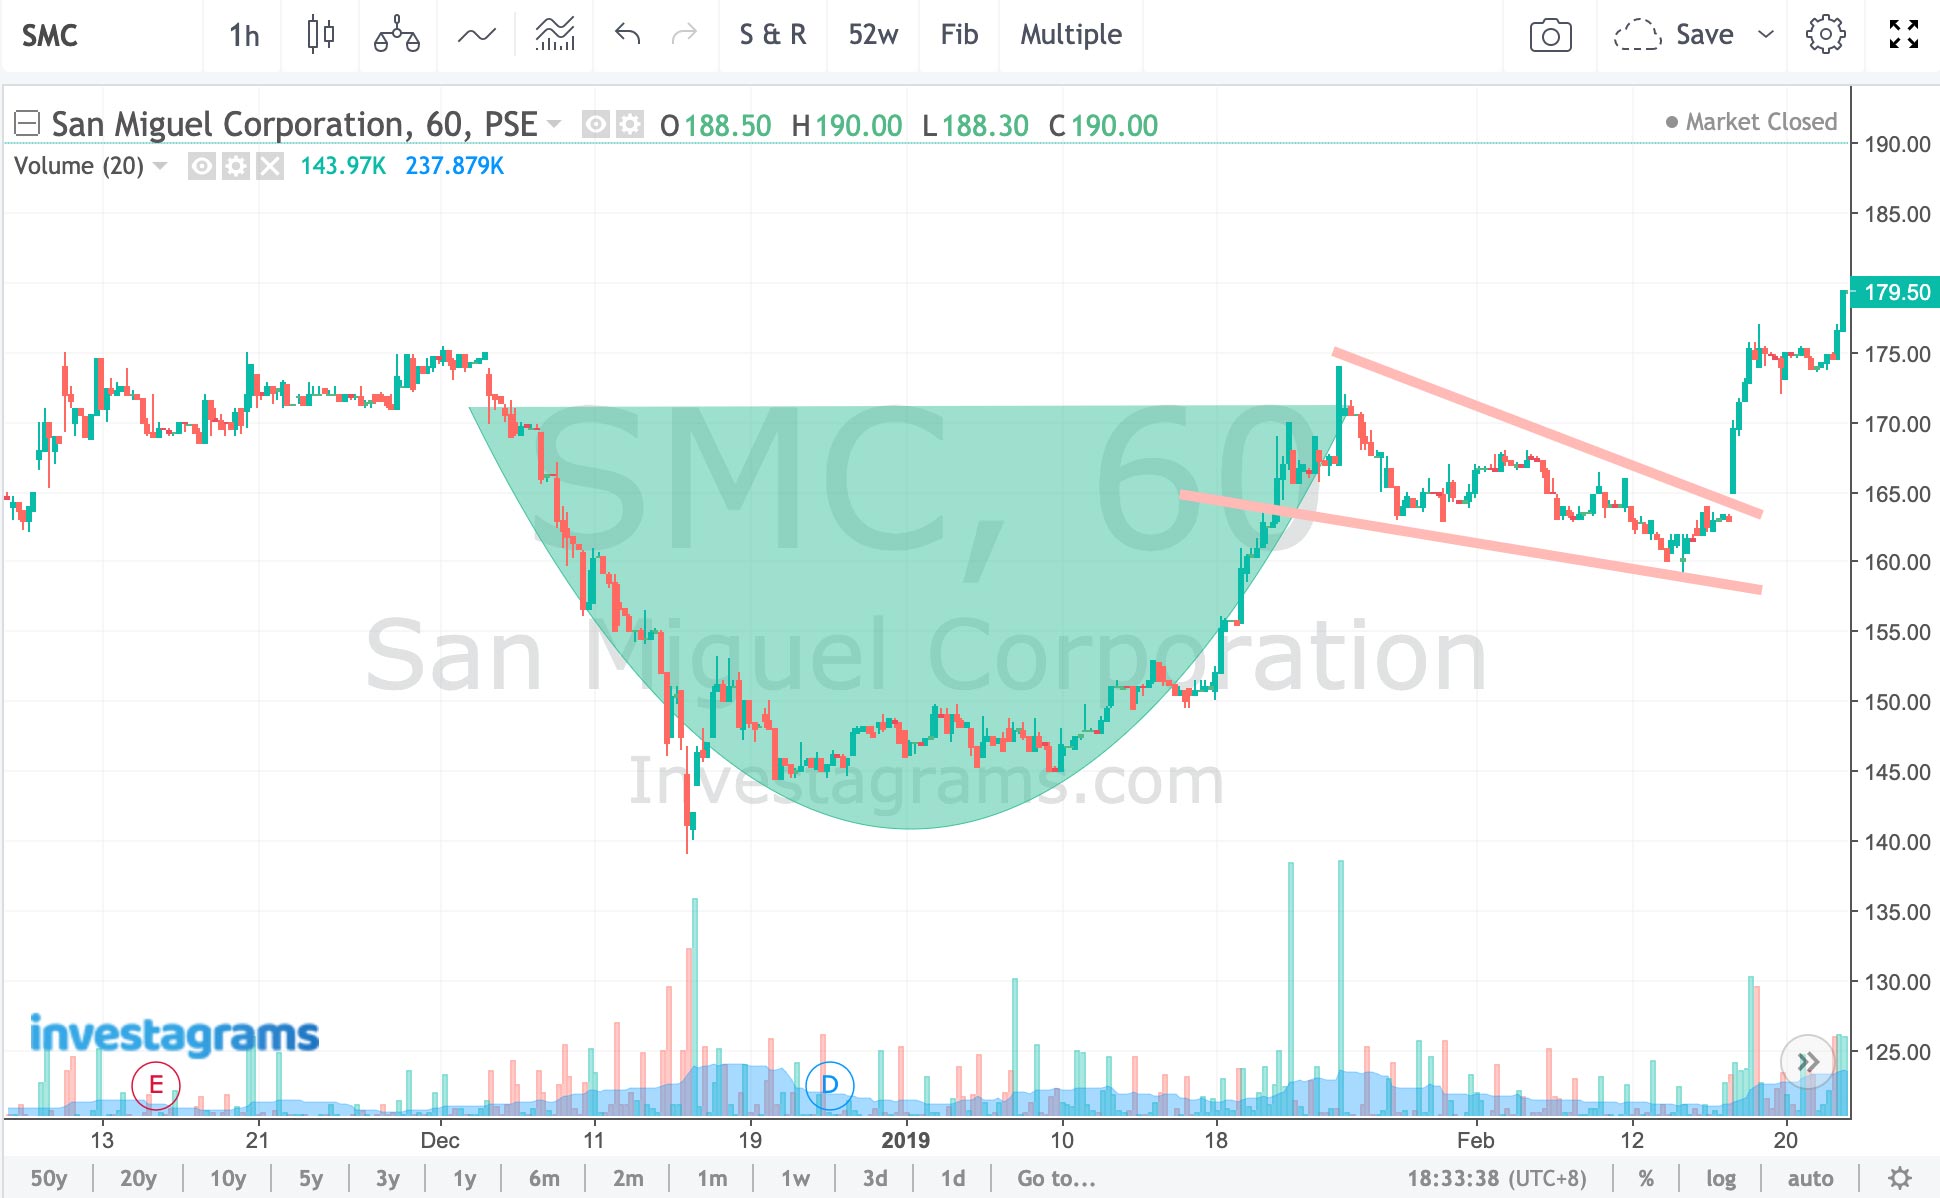
As the name implies, the pattern should resemble a cup and a handle. It is characterized by the “U” shape formed after a stock declines aggressively followed by a short consolidation and an equal rally of the same size as the decline, as well as a handle after the pullback of the high formed on the right part of the cup as shown in the above $SMC (San Miguel Corporation) chart.
When this pattern is found during an uptrend, it could sometimes serve as a continuation pattern. When seen on downtrends, this pattern could signal a possible bullish reversal.
4. Double Bottom
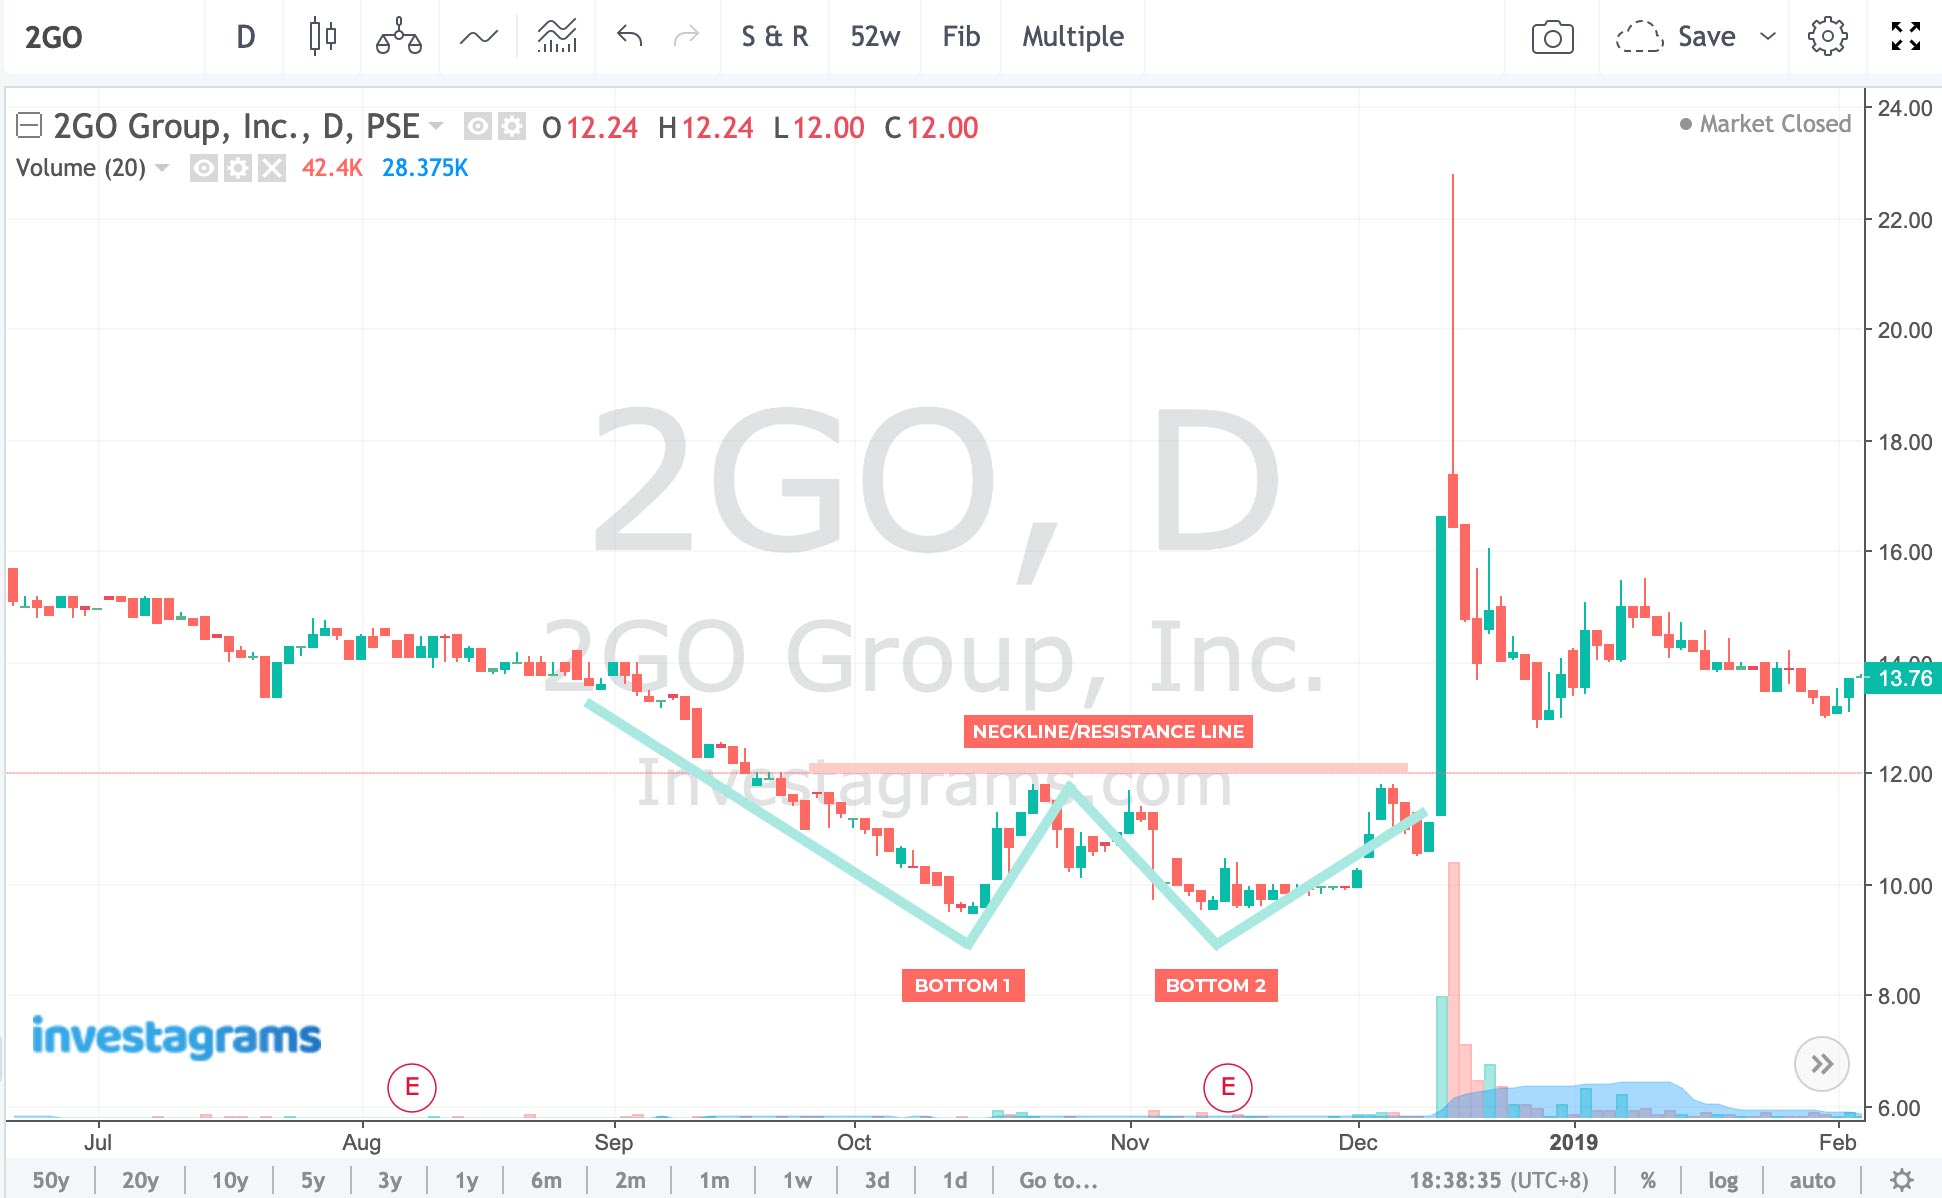
The double bottom pattern serves as a predictor for a bullish reversal pattern and an existing downtrend to reverse from. Bottom one should serve as the lowest swing low of the current downtrend and bottom two should test the first bottom as support. If bottom two does not break the low of bottom one, it should test the highest swing high between the two bottoms and breakout of it.
We can see $2GO (2GO Group, Inc.) doing a successful bullish reversal using the double bottom pattern. Traders who were able to ride the breakout could’ve gained more than 60% given that they were able to exit in profit.
5. Double Top
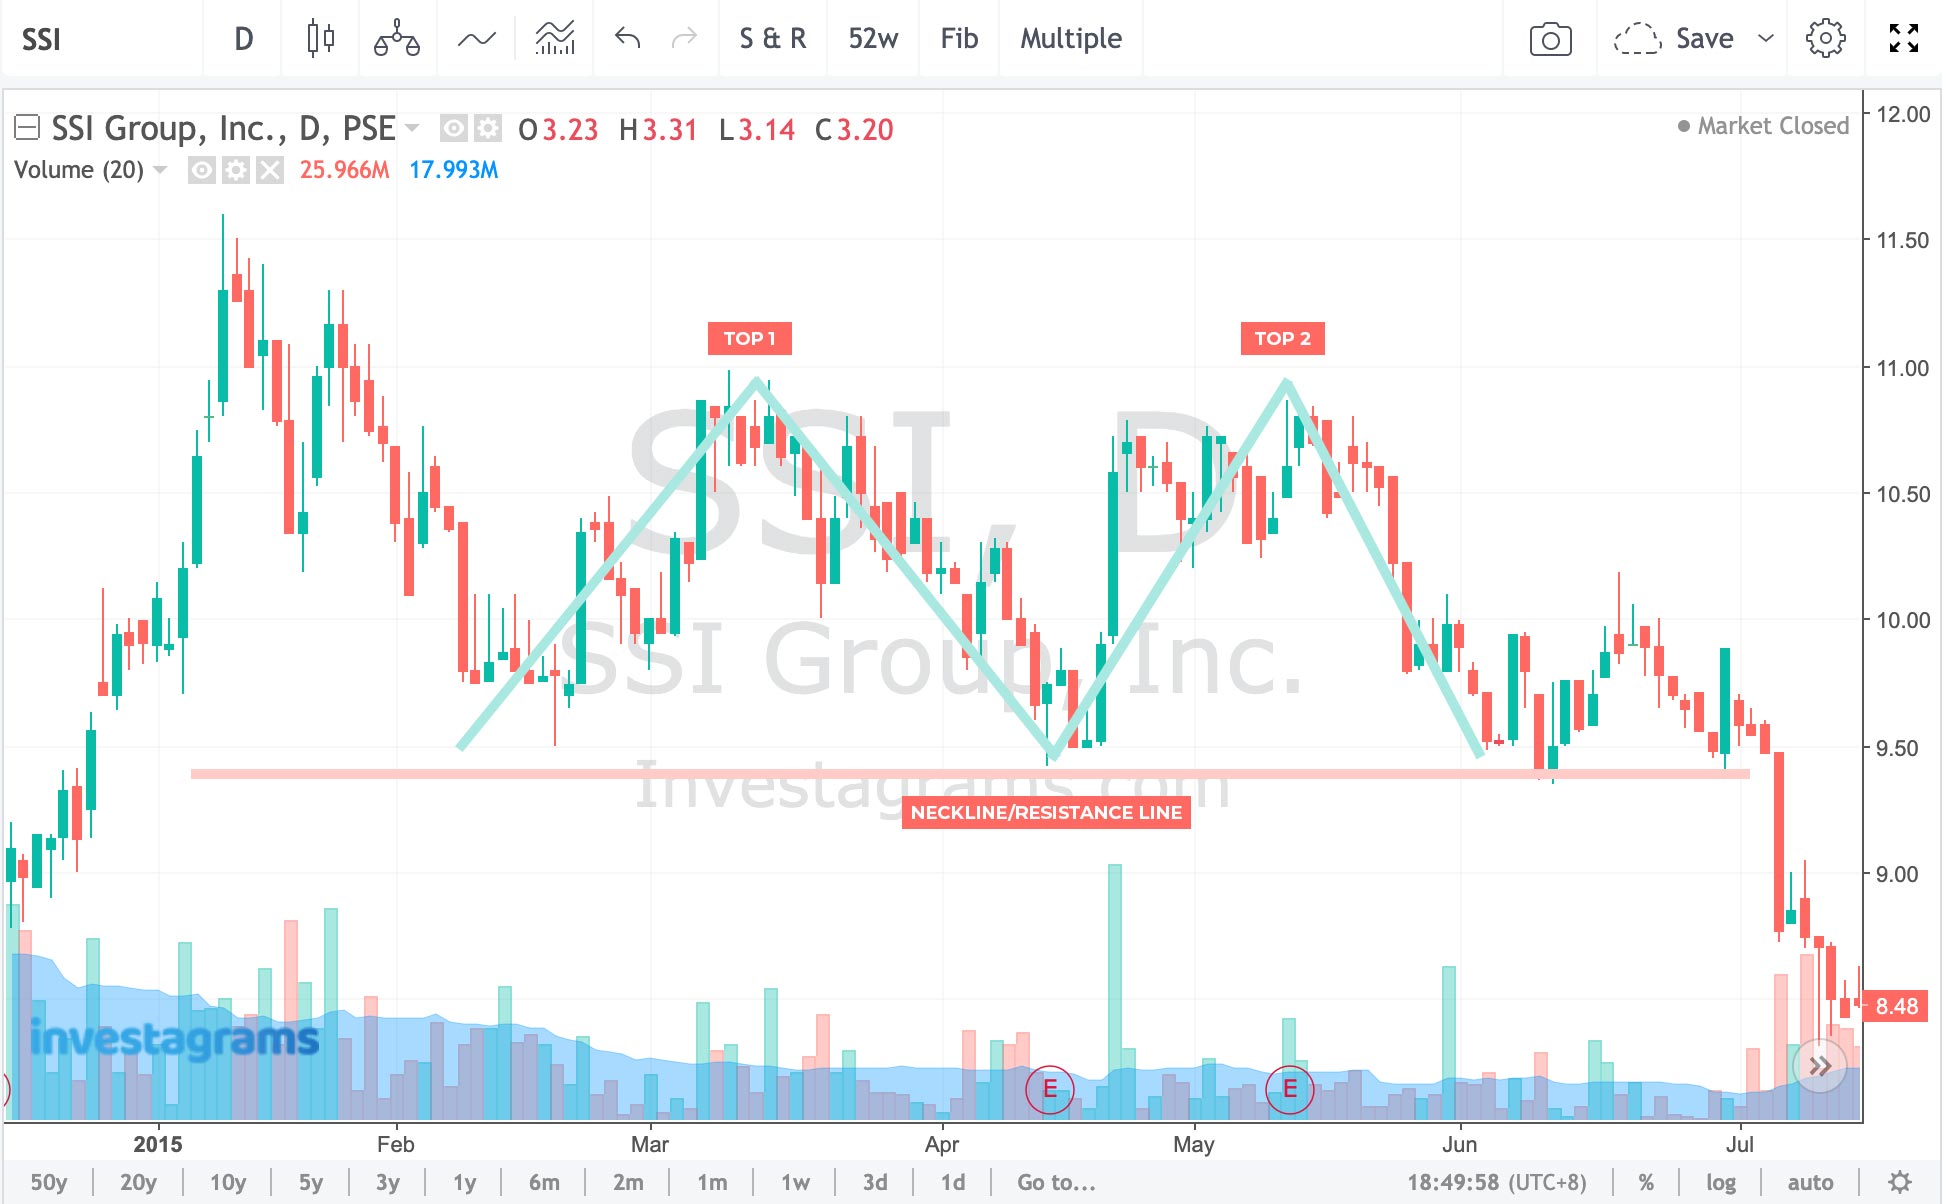
The double top pattern is the bearish equivalent of the double bottom. When seen during uptrends, it signals a possible shift to the downside. It is characterized by two tops and a neckline/support line that confirms the pattern when broken.
In the chart above $SSI (SSI Group, Inc.) failed to breakout the resistance of top one after testing it, causing the stock to retest the previous support as identified by the swing low. After the second retest of the said support, $SSI broke its support with a strong bearish candle, confirming the double top pattern.
6. Pennant
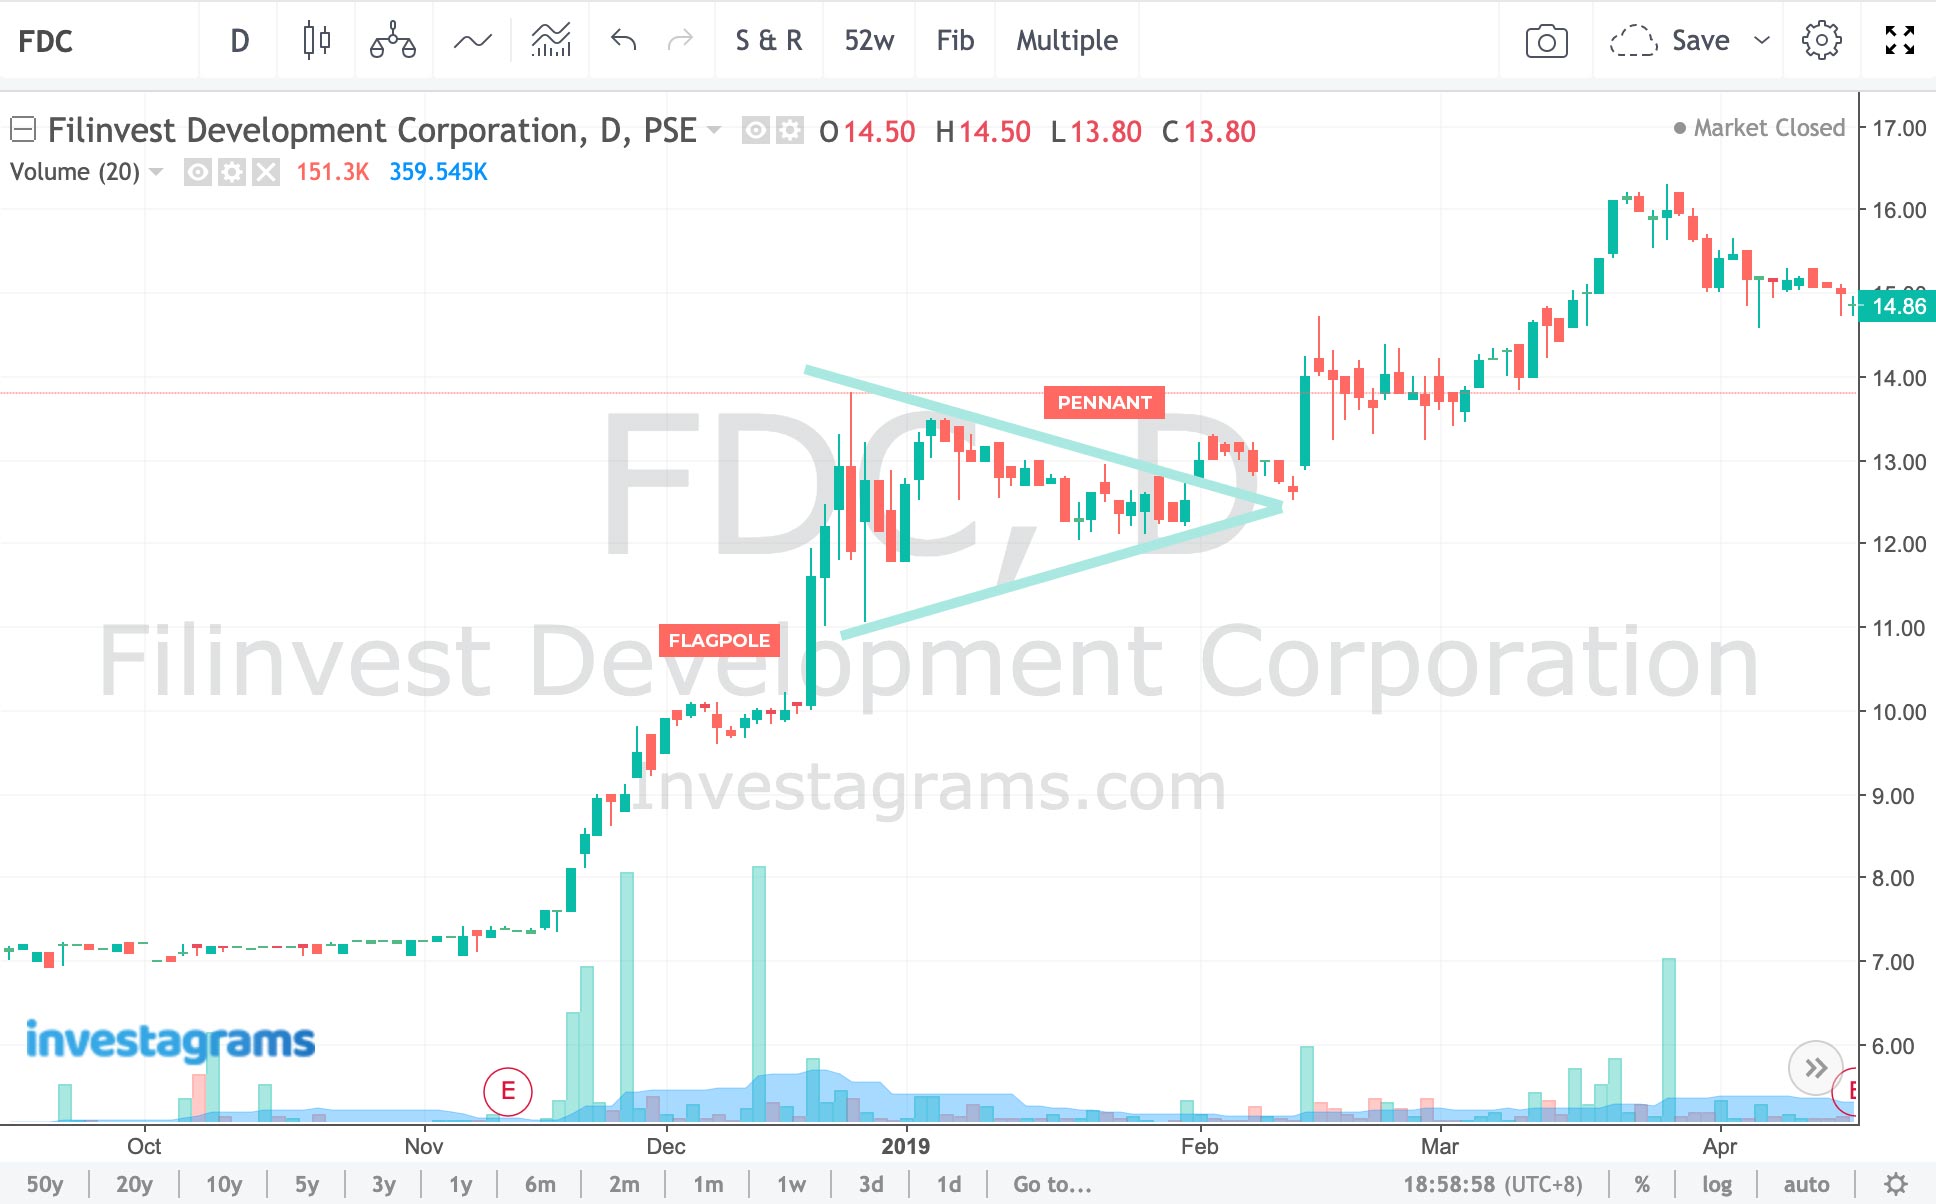
The chart of $FDC (Filinvest Development Corporation) above is an example of a bullish pennant. This pattern serves as a consolidation pattern after a stock trend upward. It has two parts: the flagpole and the pennant itself. The flagpole is the initial rally before the consolidation, an important part of the pennant as its length can serve as a stock’s target price. The pennant, meanwhile, is the period of consolidation. It is defined by two trendlines that converge at one point with one another.
Pennants are good indication of an uptrend as it allows traders to take profit while at the same time allowing other traders to get in, opening an opportunity of a higher move.
There’s also a bearish counterpart called the bearish pennant where the breakout point is the low or the support of the pennant.
Conclusion
Always remember that the psychology of the market on how and why they form these patterns are more important than knowing the names or designs of these patterns. Understanding chart patterns will allow you to confirm your buy and sell signals and not just rely on your gut feels or hunches. Don’t forget to have solid risk management incorporated in your system. Just because a stock breaks out of your entry point doesn’t mean that it won’t retrace back to your entry price and end up becoming a loss.
While one list/article cannot capture every possible chart pattern in the market, these six patterns will allow you to develop your base knowledge in technical analysis that will increase your potential to identify market-changing events that could possibly leads to increased trading success.