
As the financial markets have evolved over the years, market correlations among different assets has become more and more pronounced. To put it in simple terms, it is the measure of how two different assets move depending on the price action of the other.
This concept is widely used by both institutions and even discretionary traders. When used in a quantitative model, correlation is signified through values between -1 and 1. The value -1 signifies a perfectly negative correlation. Here you’d see that the two assets move perfectly away from each other. On the other hand, a value of 1 signifies a perfect correlation. This means that the two assets move in perfect tandem with each other.
How market correlations happen
Market correlations are often established due to the inherent nature of different assets. For example, two chip manufacturers might both experience a strong correlation with each other if there is increased demand for the whole industry. Since they both benefit from higher demand for chips, both might gain attention from investors.
Another cause could be that one asset is a commodity, while the other is the stock of a mining company. For example, if the prices of nickel rise, it would make sense that nickel miners and producers stand to benefit as well.
Real-world examples
While it might seem like market correlations are straightforward, there’s another factor you have to consider. In the real world, assets usually aren’t perfectly synced with each other. The global financial system has many different macro and micro factors that affect the buying and selling of different assets. Usually, you’ll encounter one asset following the path of the other asset, but only after a delay.
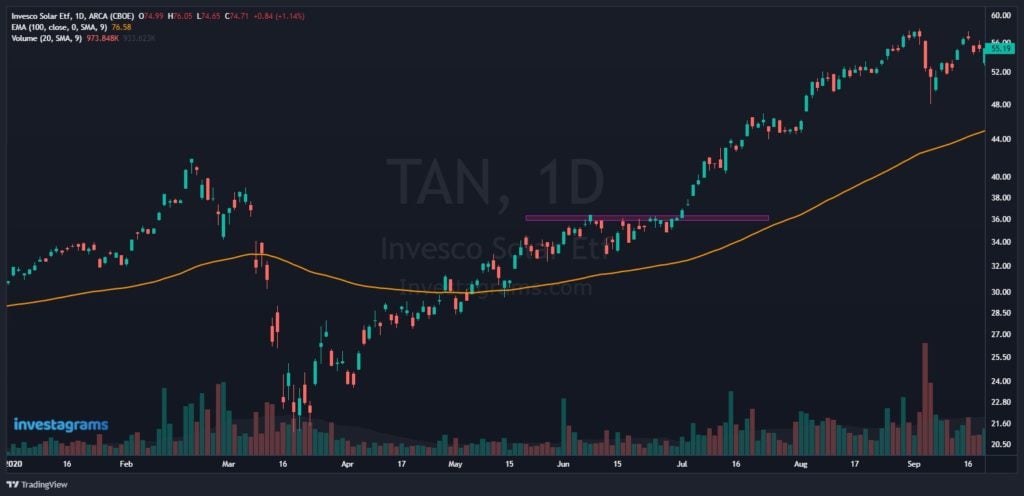
Take $TAN, for instance. During the early days of the lockdown, the U.S. stock market rallied strongly. The solar energy industry was one of the sectors that investors favored. For a period of time, renewable energy across the world became an increasingly talked about topic. As such, investors flocked towards not just solar stocks, but a wide variety of companies that do business in renewable energy.
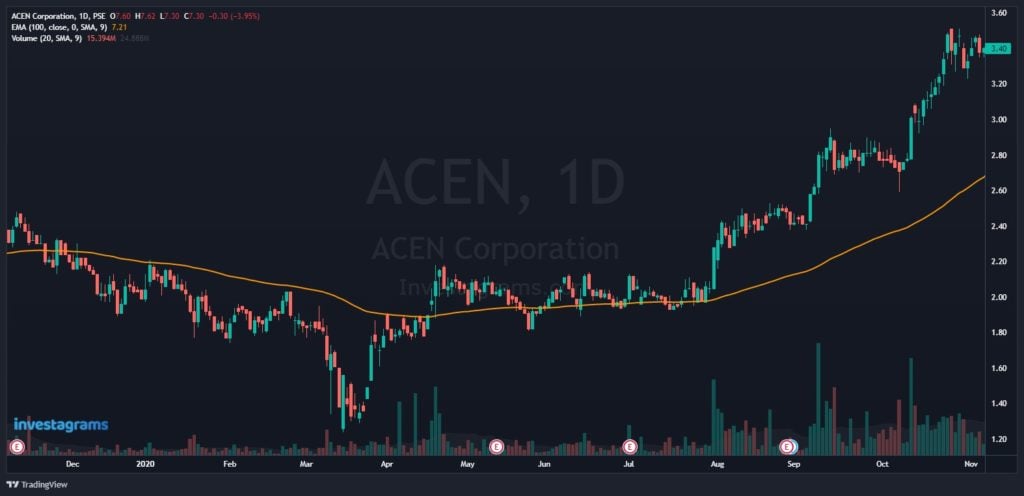
$ACEN is one of the premier renewable energy companies in the Philippines. However, the stock didn’t gain momentum until after a whole month compared to the others. While there was good reason $ACEN would benefit from the trend, there were other factors in play.
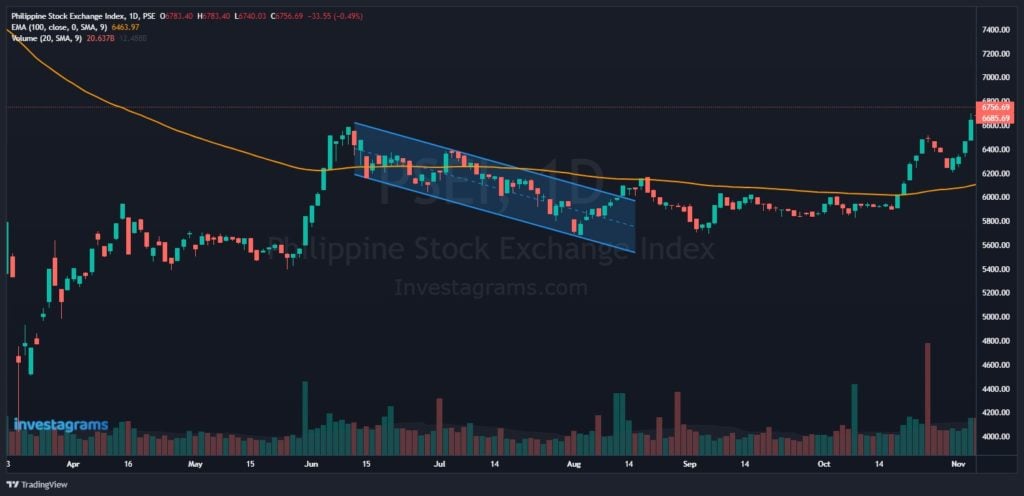
One possible factor could’ve been the weak Philippine market. During this time, the Philippine index was still in a downward channel. $ACEN only started rallying once the $PSEi broke out of the mentioned channel.
This scenario also presents a key insight: stocks often have a good correlation with their respective market indices. Often called the beta of the stock, you’ll notice that even non-blue chip companies can become heavily affected by the swings of the Philippine market index. The reason for this is related to how money flows in the markets. Essentially, the market’s liquidity gets sucked out if investors are bearish overall. This would become a strong headwind that can hinder mid-caps and even third-liners.
How knowing about market correlations helps your trades
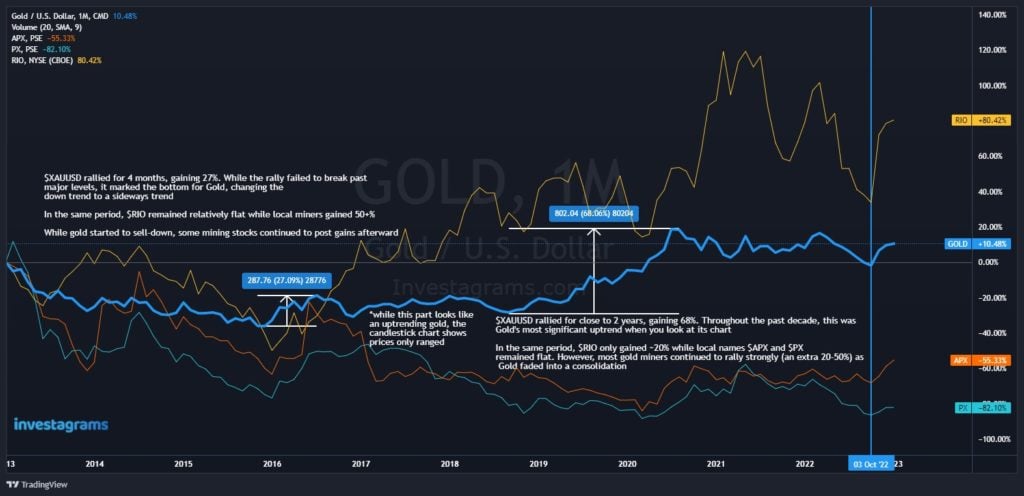
What we’re sharing here is a snippet from our recent research done on gold miners. As the commodity has been strong recently, we wanted to find out who would benefit the most. By just simply looking at how different assets behave in relation to each other, you can find insights that can greatly aid your trading decisions.
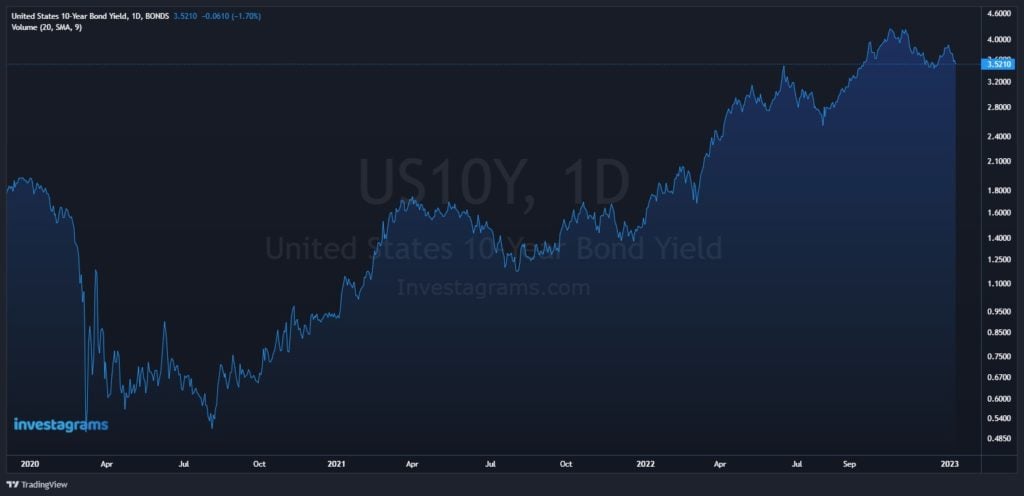
Aside from commodities, this form of market research can be done across a whole range of asset classes. While the start of 2022 has been rough for almost all markets, there was a niche market that sprung to life. Some traders were early to figure out that there were profits to be made in derivatives related to treasuries. It’s widely known that inflation rates and interest rates have a strong correlation with each other. For them, it was as simple as finding which derivatives or instruments to trade in order to benefit from the macroeconomic situation.
Last Remarks
Overall, understanding that the market correlations are becoming more pronounced today can be a good added edge to your trading system. By taking into account what certain scenarios can do to other assets, you can research and find interesting past market behaviors that you can take advantage of. However, just remember that correlation does not always equate to causation. Most of the time old correlations can die down and new ones can form.
In the end, it all boils down to being diligent and keeping up with the forever-changing market dynamics.
Be part of our #InvestorDay 2.2 journey where you can invest and get a chance to win an exclusive Investor Shirt Merch from us!
Simply:
1. Download the Investa app
2. Complete application
3. Invest for as low as Php 1,000.00 to claim your 150 raffle tickets (this will be your entry to win the merch raffle)
Raffle draw on Feb 2, 3 winners will get one shirt merch each!
Open an Investa account for FREE