
In a quote by Arian Adeli, he says “A successful trader must learn to be a good loser before he can start winning.” Losing days are normal, especially when you have just started investing. To avoid more coming, learn from your mistakes and keep learning new things. Only then will you experience winning days or even years.
@patient_investor_ph takes the spotlight for this week’s featured trader as he shares his knowledge with us on stocks from the PSEI. Let’s take a look at how @patient_investor_ph uses this to his advantage.
@patient_investor_ph shared his thoughts on $ABA and the potential course it might go after analyzing its monthly, daily, and weekly charts.
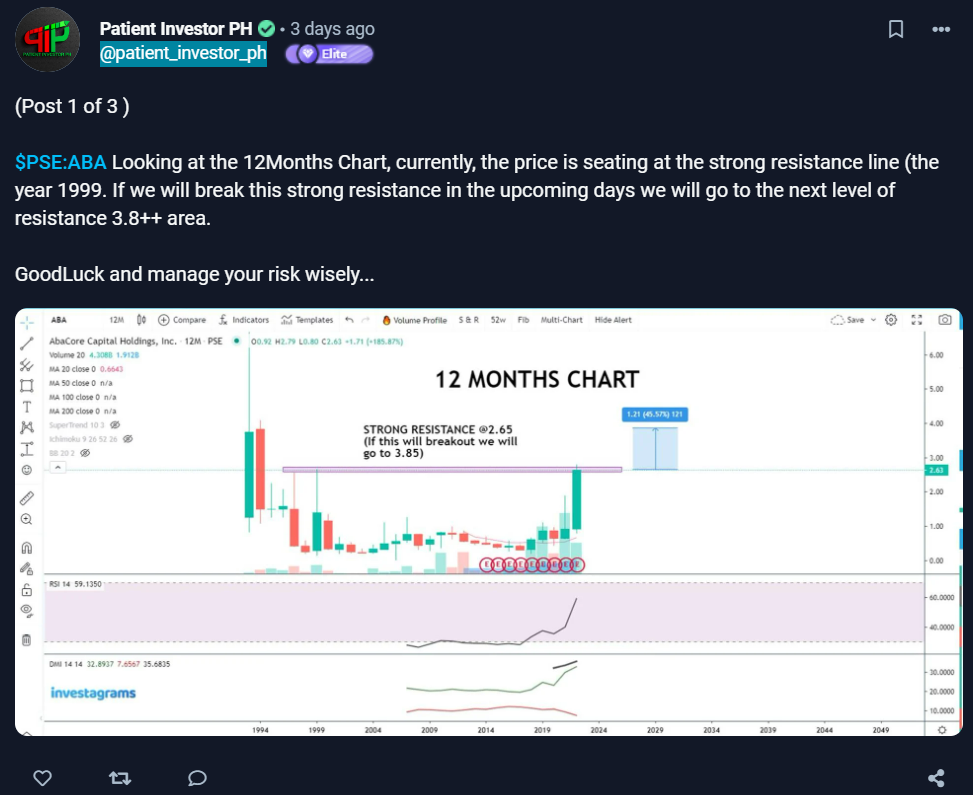
For the first post on his stock analysis, @patient_investor_ph plotted out 4 technical indicators that will help assist in identifying price movement. We can first see a resistance line at 2.65 which is needed to be broken for prices to push upward. We can also see RSI, a momentum indicator, closing into the overbought levels (70 RSI). Volume is also seen, which usually tells us if there are more buyers or sellers. And lastly, the DMI assists in determining if a stock is trending while also attempting to measure the strength of the trend.
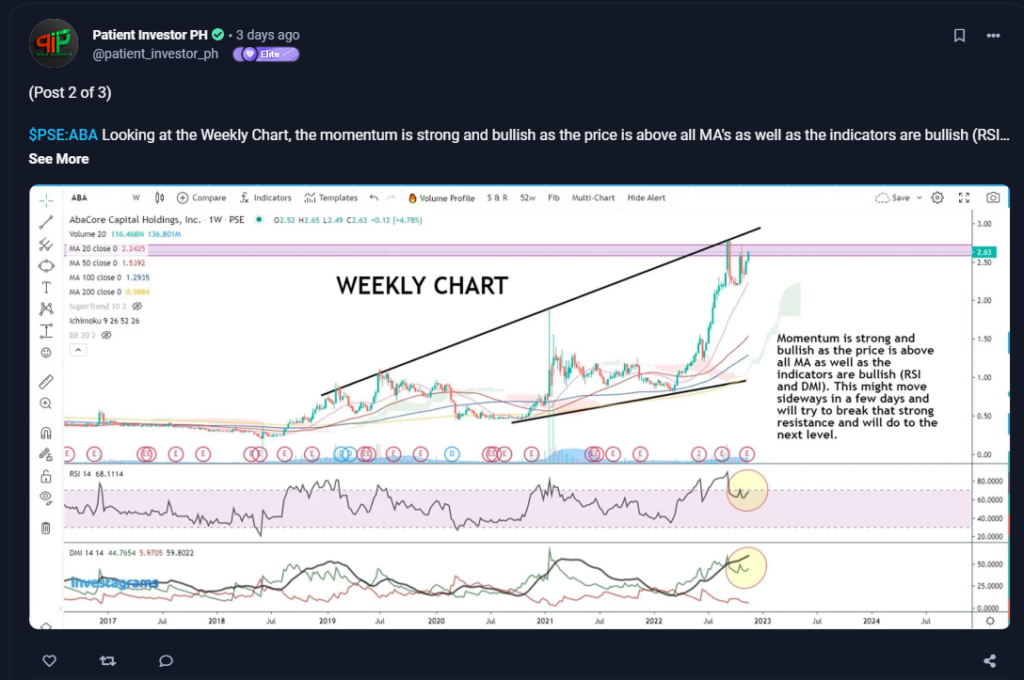
The same goes for the second post, only this time he uses the weekly time period. @patient_investor_ph has also added an Ichimoku indicator which is used to gauge momentum along with future areas of support and resistance.
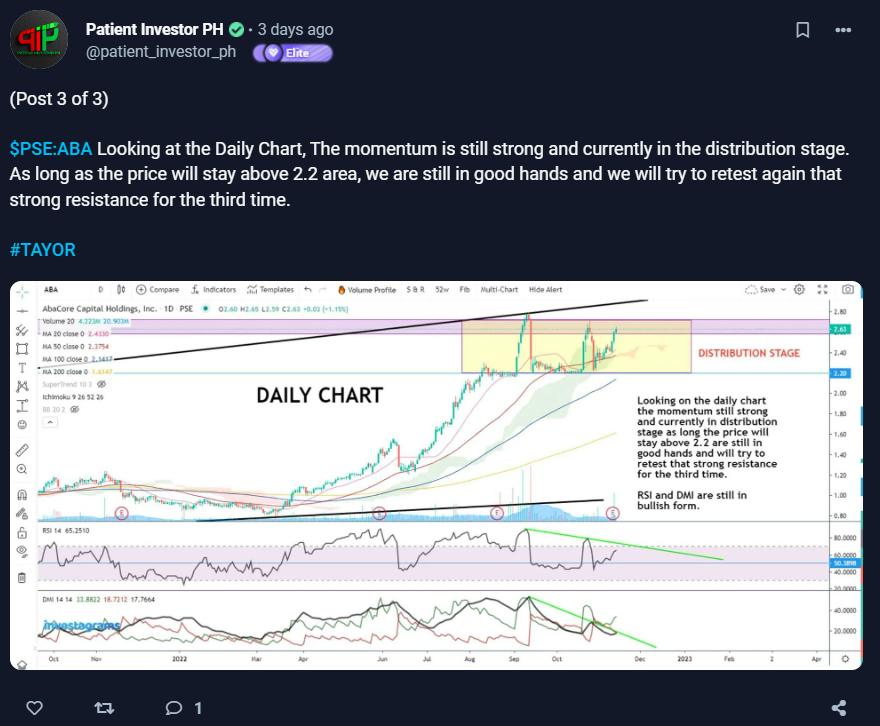
As for his third post, we can see that he has plotted out a distribution stage marked as a yellow rectangle. This phase begins as the markup phase ends and prices enter another range period.
TECHNICALS OF THE TRADE
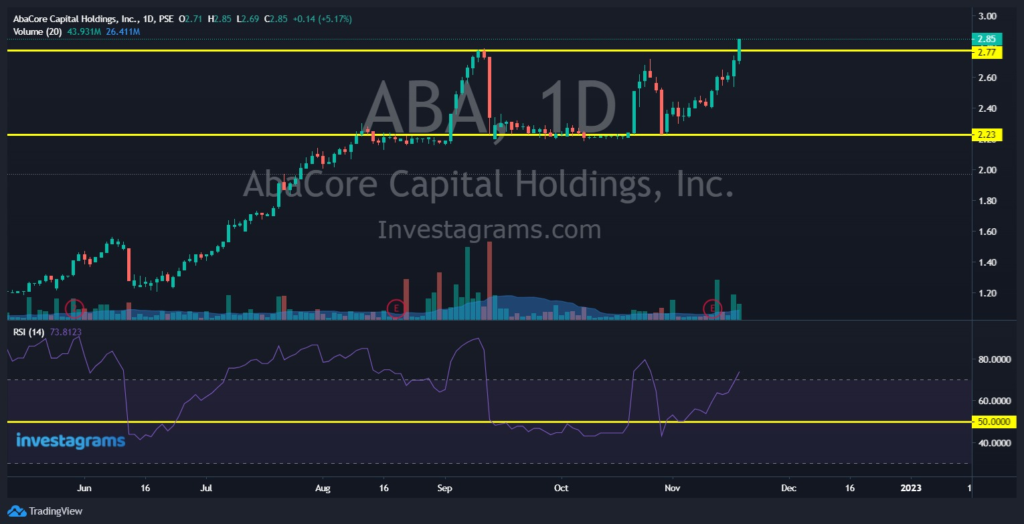
As for the technicals, let us focus on the daily time frame. Technically, $ABA at the time was trading in a range, particularly at the 2.20-2.70 area. RSI traded as low as 40-50 RSI (fair), and up to 90 RSI (overbought). Notice also how volume spiked on certain days followed by fairly low ones afterward. The MACD, a momentum indicator, was mostly bearish during the trading period before showing signs of reversal around the 19th of October.
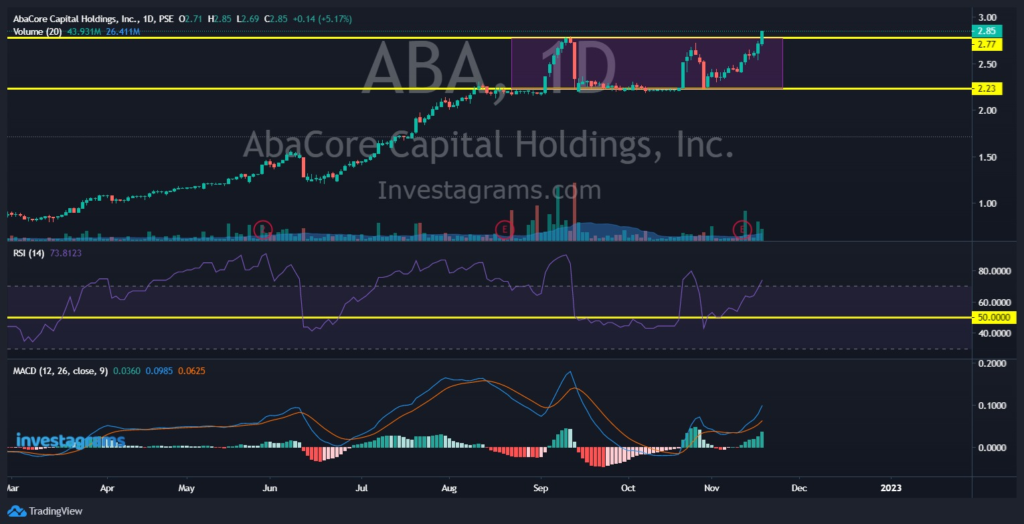
With all the information gathered and collected, @patient_investor_ph was able to stay bullish and was rewarded with gains in his trades.
FUNDAMENTALS OF THE TRADE
In a quarterly report posted by PSE Edge, $ABA reported a gross income of P75.38 million, or 55% lower compared to the gross income of P137.45 million for the comparative period last year. The company’s gross income came from a gain on the sale of investment property amounting to P27.55 million; dividend income amounting to P15.20 million, and other income amounting to P27.84 million.
WHAT SHOULD BE MY NEXT MOVE
As $ABA closes into the PHP3.00 levels, it is best to hold whatever you have on the stock for now and wait for the breakout. The RSI is showing overbought levels which is very risky in trading. As of the moment, wait until a breakout of PHP3.00 is confirmed and start buying from there. If you have positions in $ABA now, you may sell it as there could be a possibility that the price would drop.
Given this, it is preferable not to buy yet and wait until the price breaks the resistance line. Be patient and your returns will be rewarding.
Once again, KUDOS to @patient_investor_ph for being this week’s featured trader! Enjoy your 14-day InvestaPrime Access and continue to be an inspiration to the trading community.
Want to learn more lessons to help you build a crisis-proof system? Check out the Investa Summit 2022: Opportunities in Crisis! Our world-class and industry-leading speakers will be giving you in-depth experiences and lessons on the bear market we’re facing, and how we can find opportunities moving forward.