Your Official Learning Hub on Trading, Investing, and Personal Finance
Author:Investa
Investagrams has helped thousands of Filipinos all over the world on their stock market journey. Now, we're aiming to help thousands more! Follow us on InvestaDaily for investing tips and stock market advice to help you reach your first million.
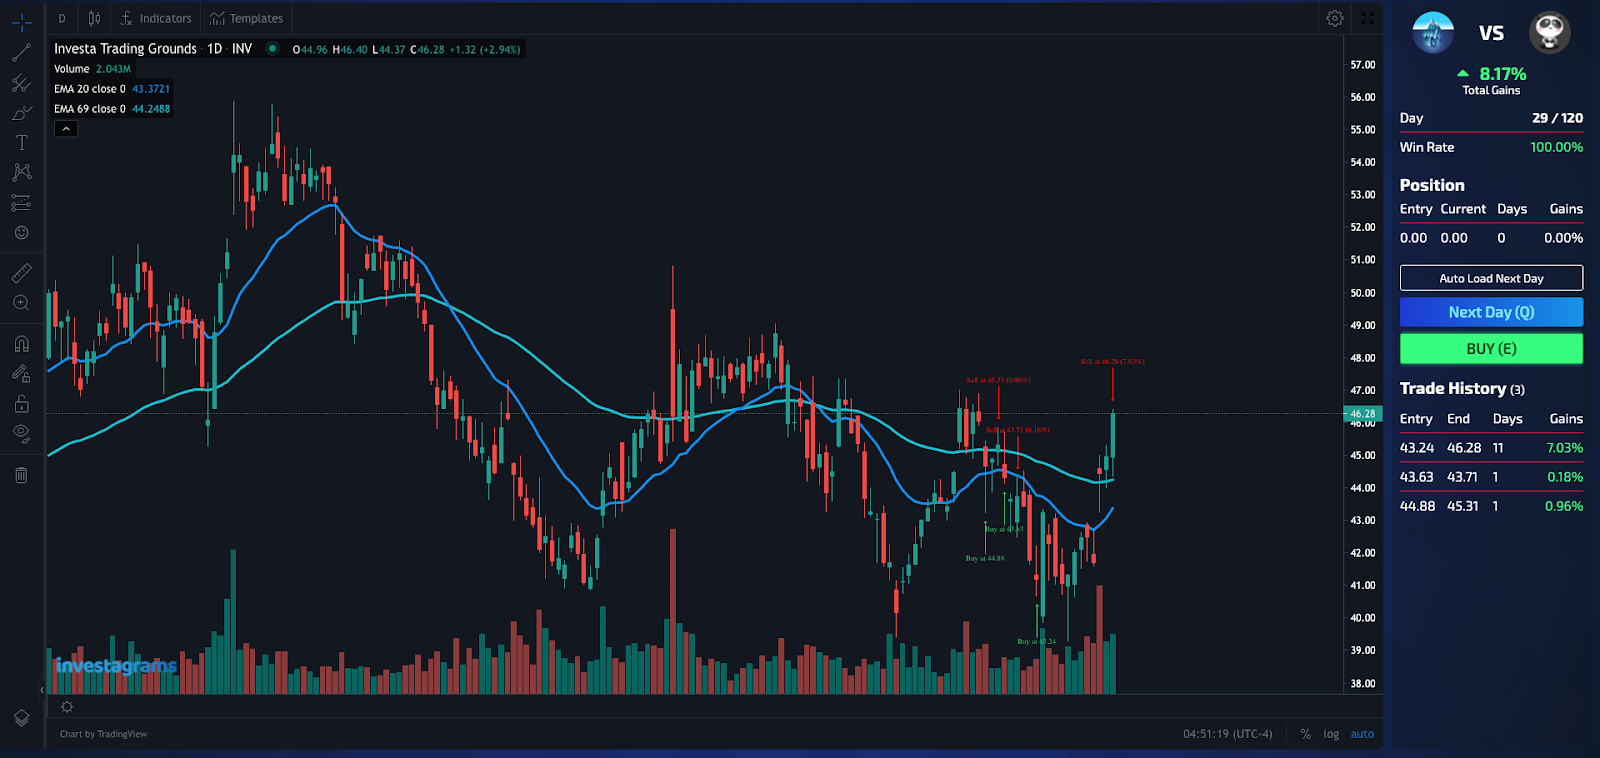
Bored of waiting to execute your trades? Come over and prove yourself in the Investa Trading Grounds, where you can compete with other players to determine how well your charting skills match up against others. The rules of the game are simple: Get as much profit as you can. The player who gets the highest profit by the end of the challenge will win. Below are some of the things you would need to know to get more profits.
Finding a game
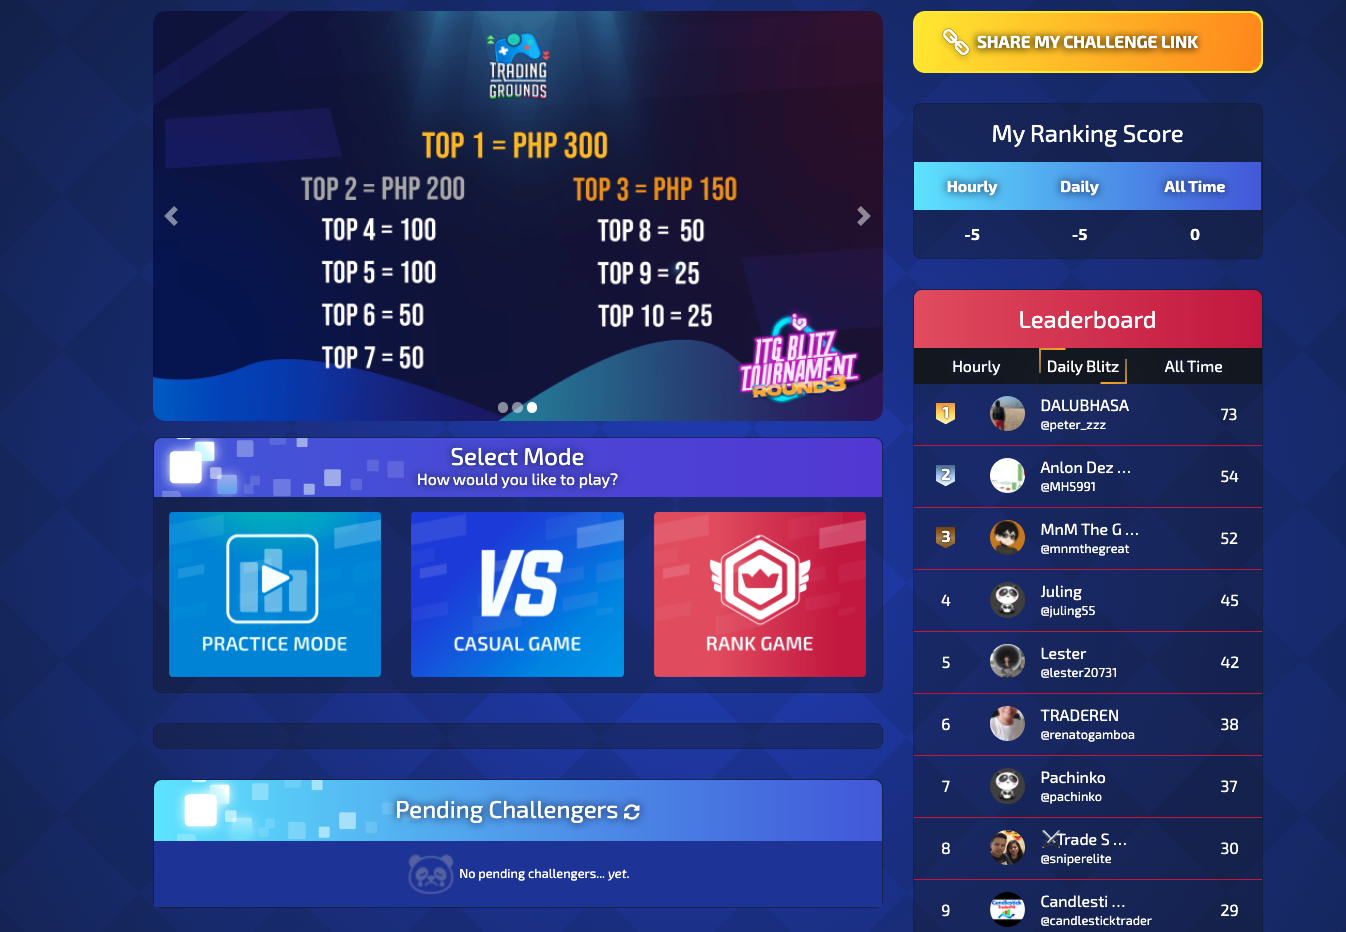
There are three game modes you can choose from: Practice Mode, Casual Game, and Rank Game. In Practice Mode, you would just be playing with yourself if you feel like you need the extra practice. For Casual and Rank, you would need to fight another person by either selecting the mode to find someone random to go against, or by challenging/accepting challenges.
Duration
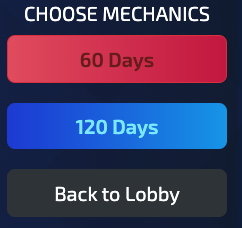
Choose how many days you want the chart to last. Would you rather play through a simulation of 60 or 120 trading days? There will be no bonuses or deductions for this choice – only preference will matter.
Setting up your chart
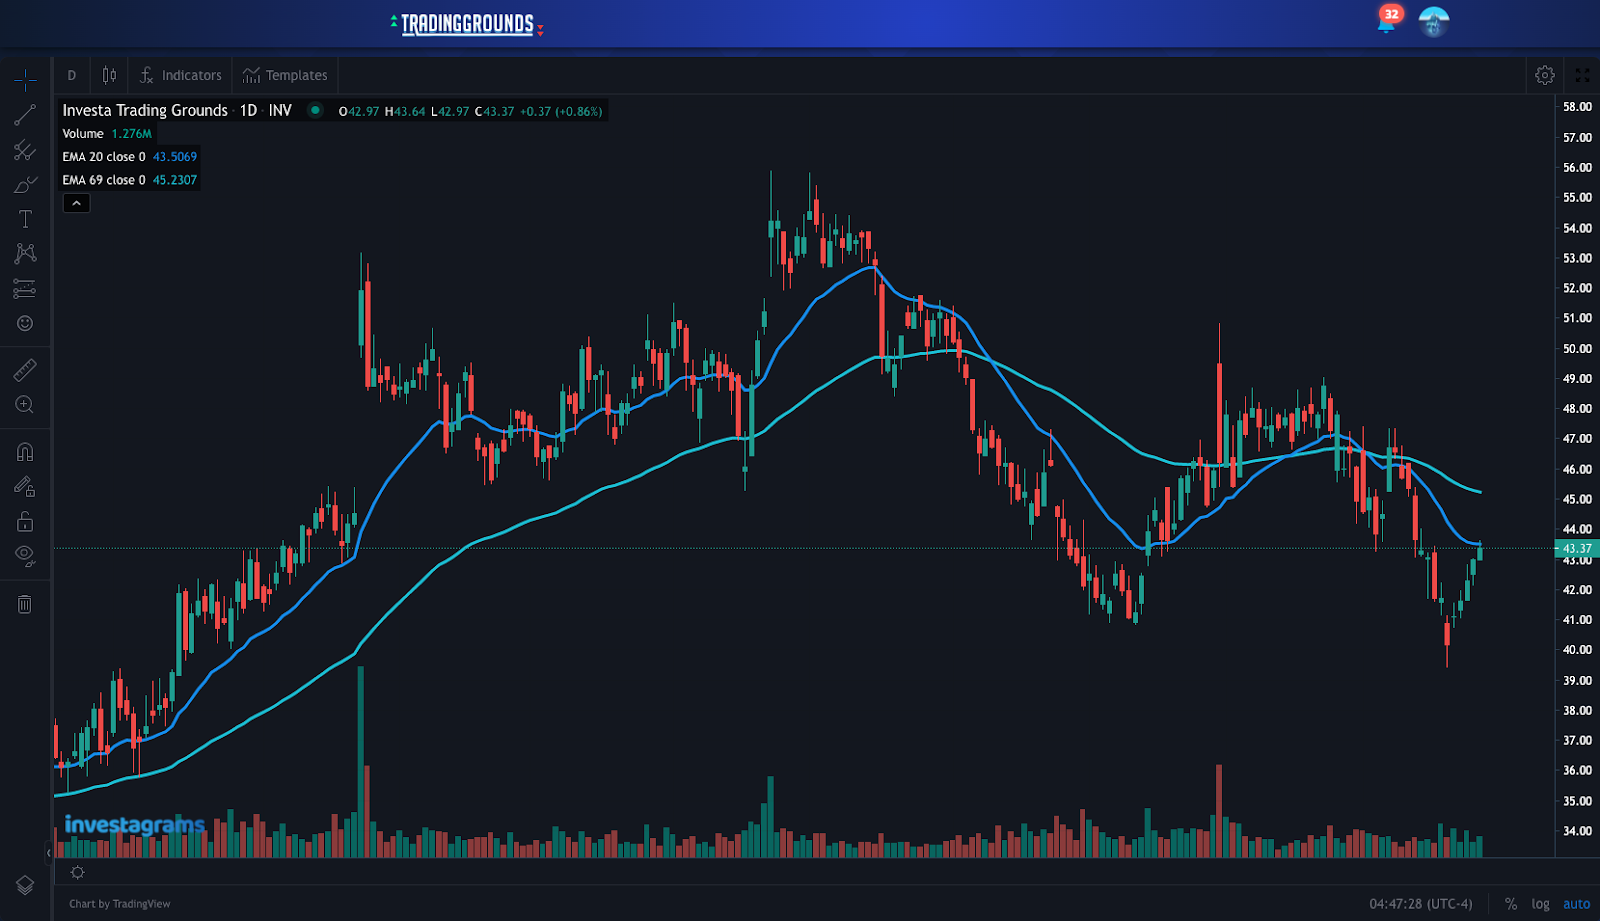
As with actual trading, you can set-up your charts in Trading Grounds to fit your system. From Moving Averages to Trendlines, you can use all of the free tools available. Keep in mind, however, that all charts in Trading Grounds are restricted to only the Daily timeframe.
Buying and Selling
When playing, you have two options – you can either skip to the next day or buy/sell. Everytime you buy and sell, your trade will be recorded under your Trade History where you can see how you have been performing so far. Whenever you buy, you can look over the data under “Position” to see how your trade is doing so far.
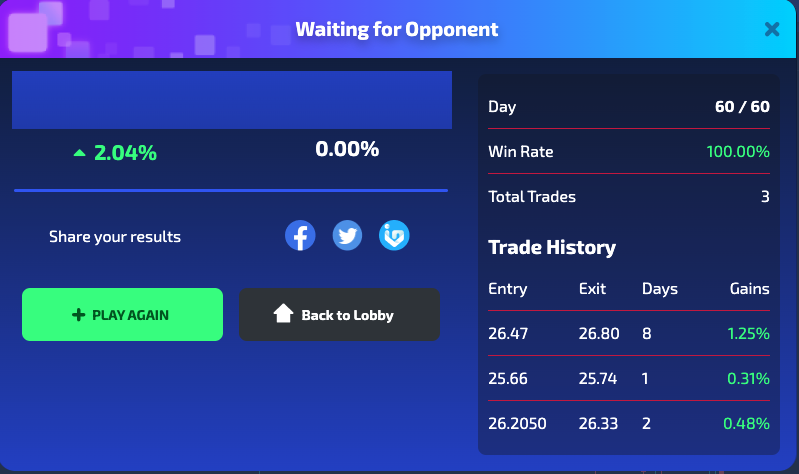
Results
After the duration is up, the total results will automatically pop-up where you can see how well you did for the game. If you challenged an opponent, you would have to wait for him or her to finish the game. Meanwhile, if you were challenged, you would see who won based on your respective profits.
Easy right? Now go and prove yourself in Investa’s Trading Grounds! If you keep on grinding and winning in ranked games, you could get a chance to win PRIZES as we currently have a daily ITG Blitz Tournament. No need to do any extra registrations, just be part of the top 10 for the day and you will qualify for our rewards.
Let’s give a round of applause to AlMar for being this week’s Featured Trader!
AlMar has been a member of the Investagrams community since 2020, and he is consistent poster who shares his thoughts and chart studies to the community. Something unique about what he shares versus other members is that he often shares bigger picture views of stocks. While others tend to share daily timeframe charts, he often shares weekly timeframe charts
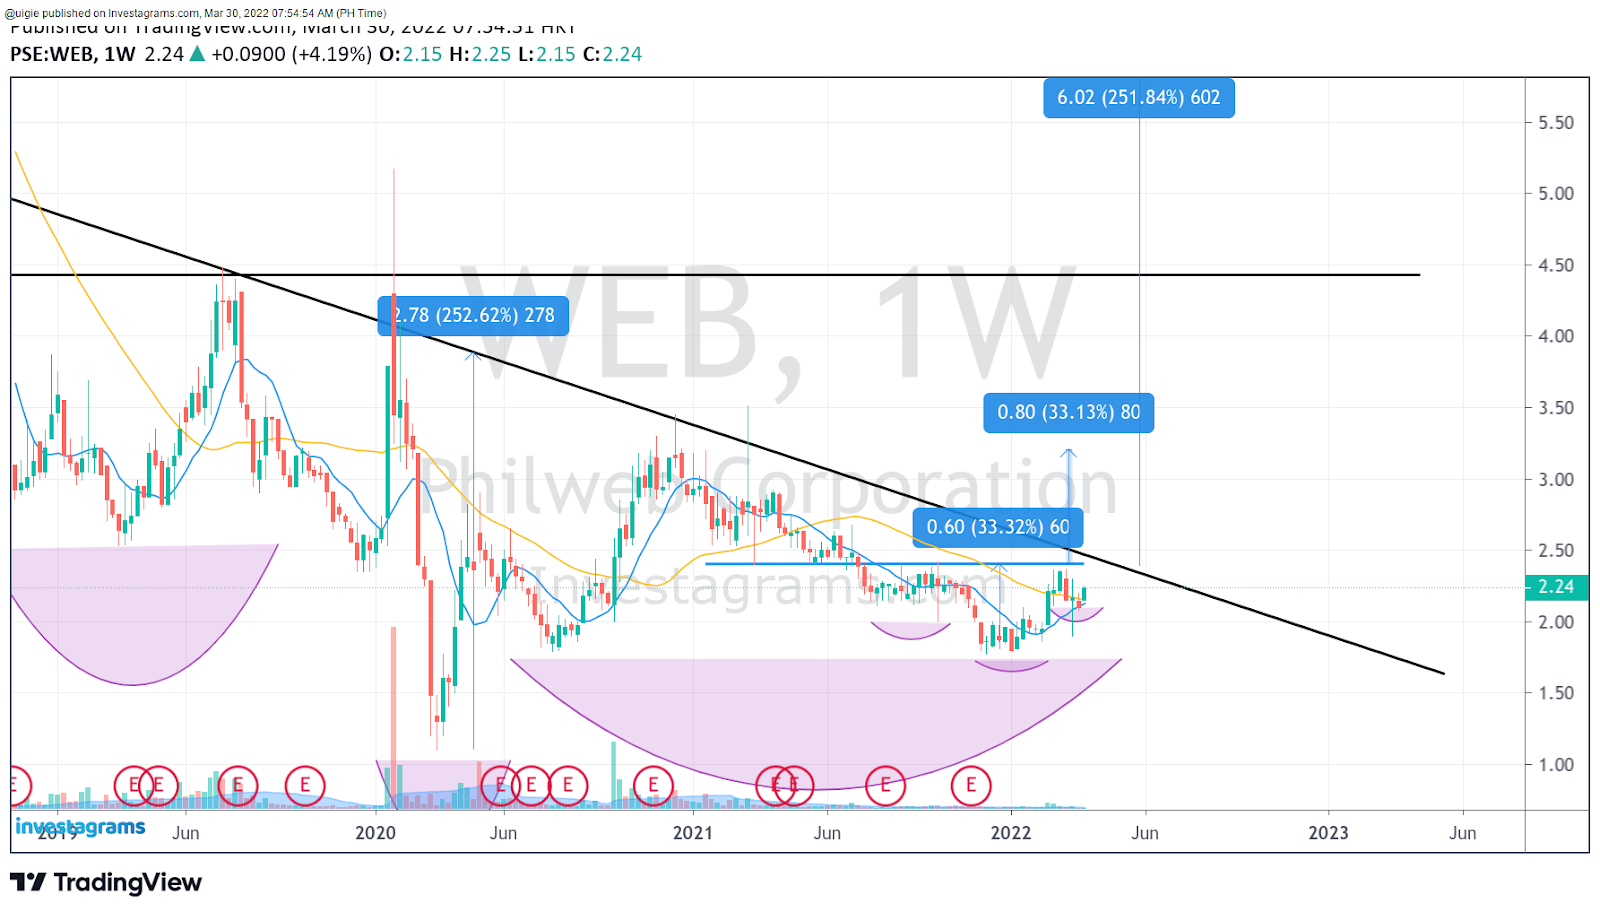
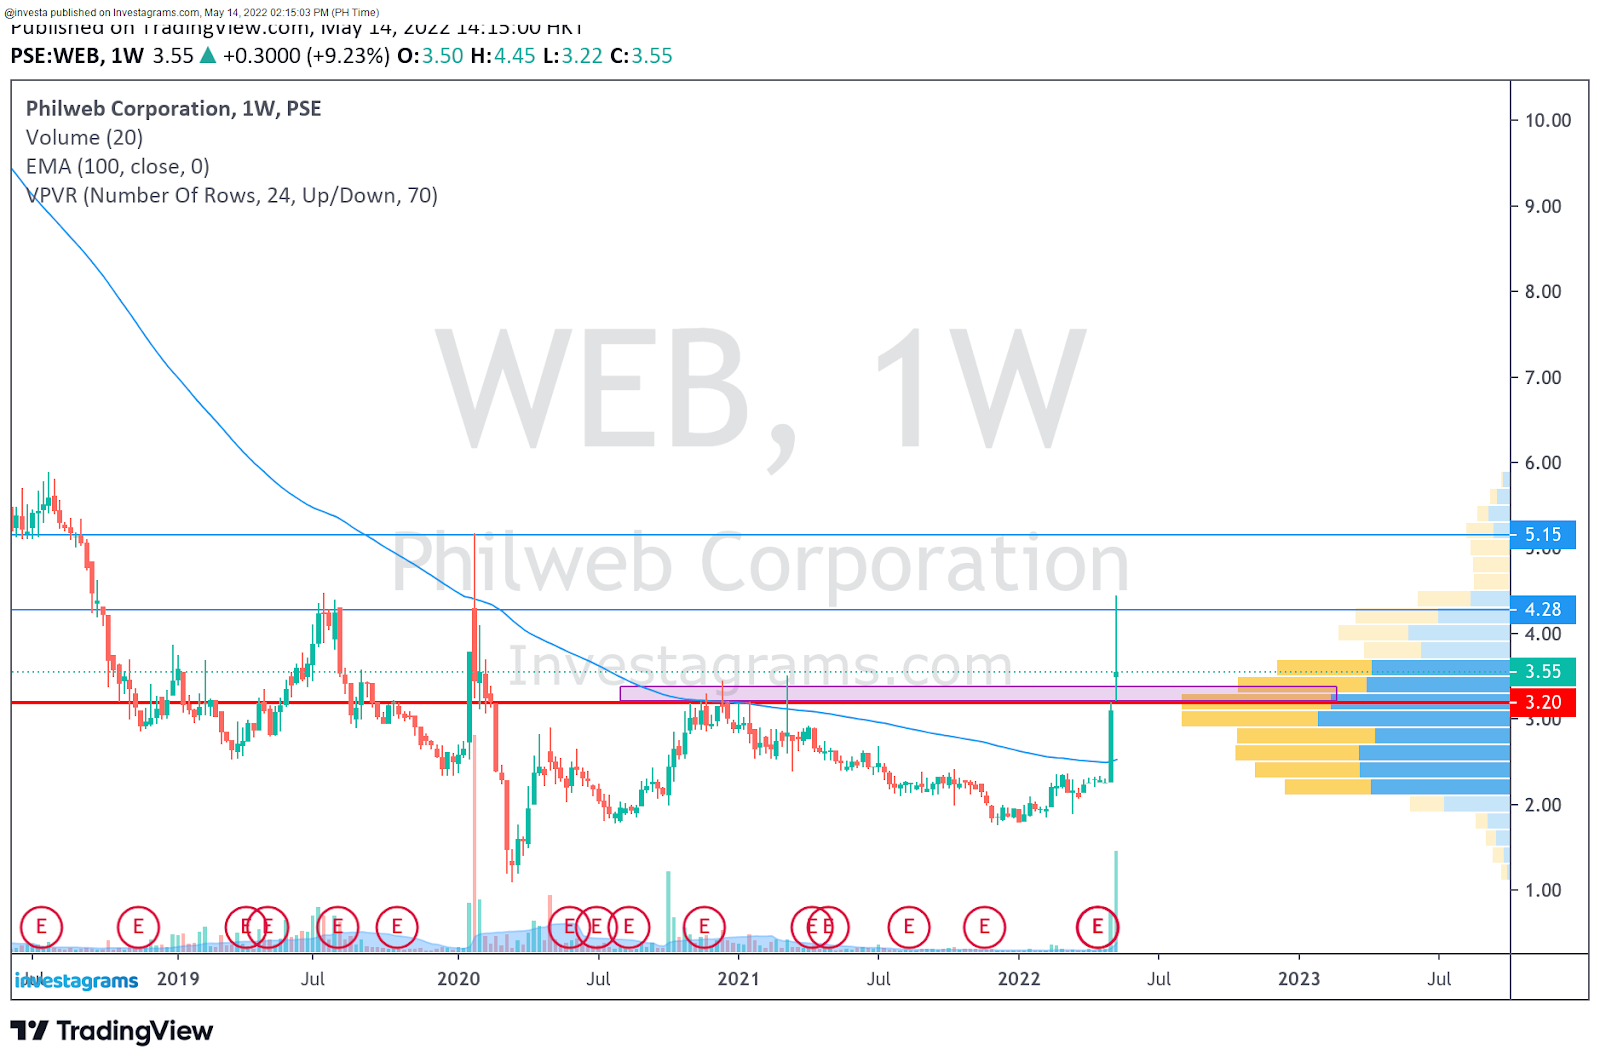
Months ago, our featured trader posted his trade ideas for PSE:WEB. A widely known gaming company, its stock price has been in a downtrend for quite a while.
PSE:WEB has actually fallen by as much as roughly 96% from its peak a few years ago. With a lot of headwinds and sour earnings, a lot of investors have become pessimistic with the stock. After many months of poor returns, it seems that stock may have gotten some life back. In his post, AlMar mentions that the stock could breakout from its long-term downtrend line. As seen in recent trading sessions, PSE:WEB has just taken its first step should it look to perform a reversal.
TECHNICAL STANDPOINT
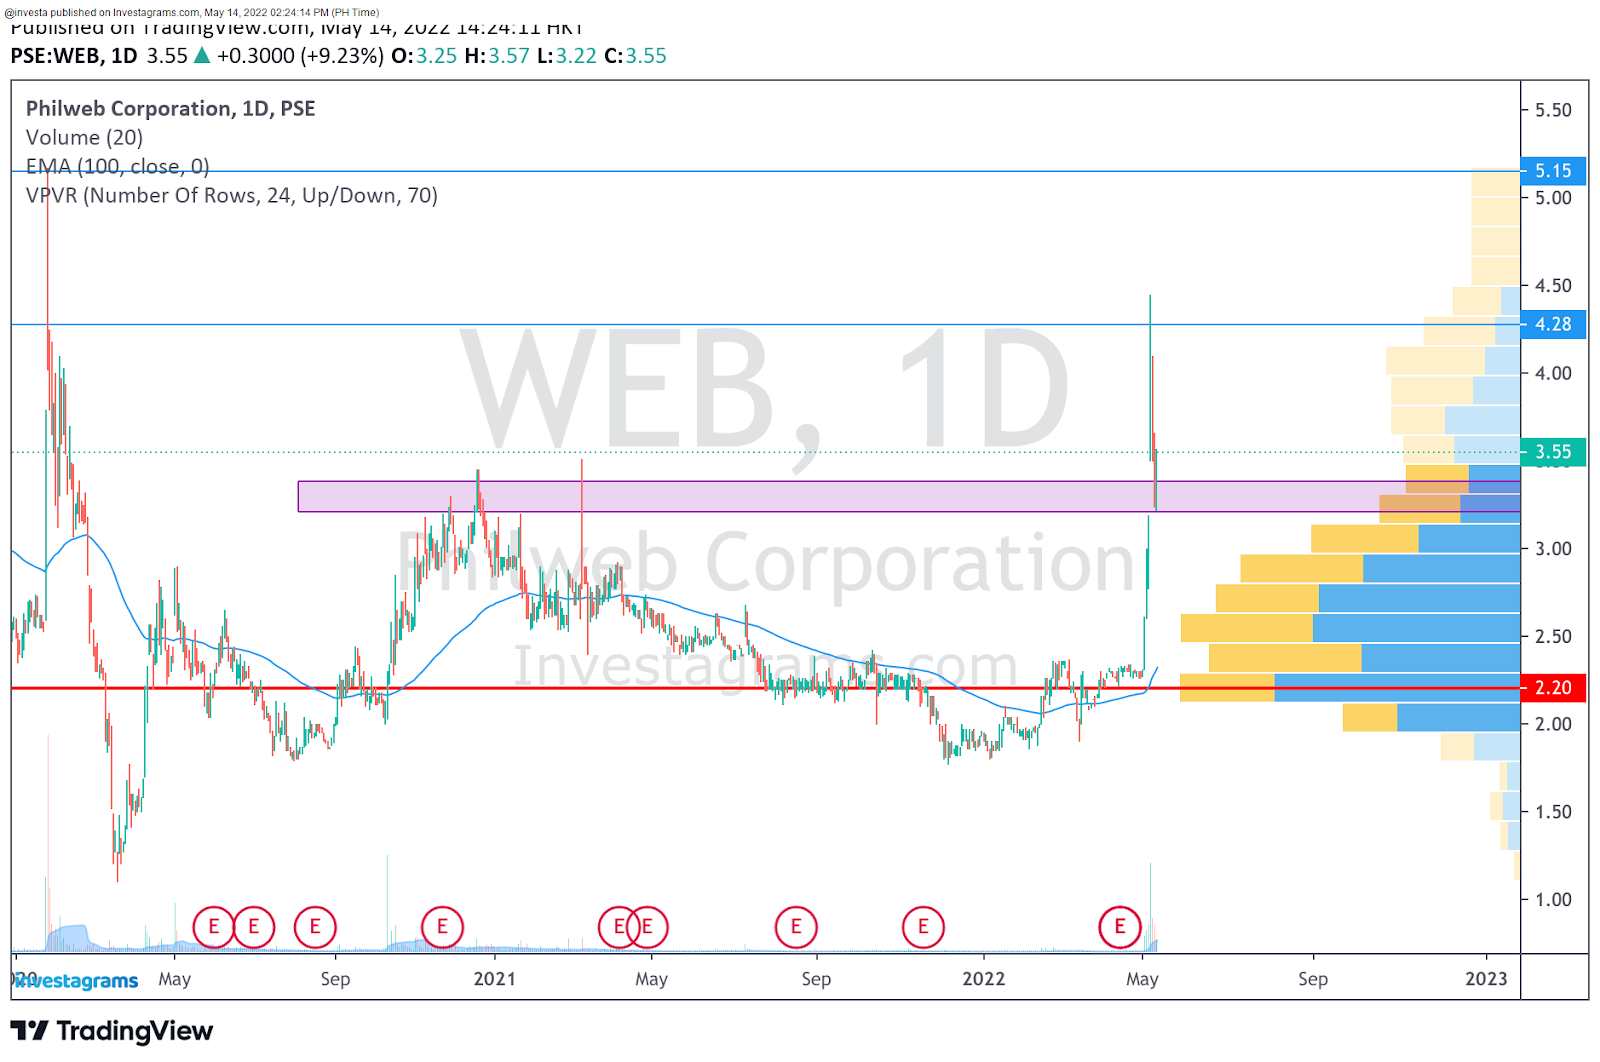
In terms of price action, PSE:WEB came from its lows and formed a pocket near it’s weekly EMA100. Once volatility contracted, a strong breakout was imminent as buyers rushed in on the day of its breakout. The stock’s recent move makes it a prospect for a big picture reversal play. Although high volatility is still present in the markets, strongly breaking out from the EMA100 is a big first step along with breaking out of its long-term downtrend line.
FUNDAMENTAL STANDPOINT
PSE:WEB is a company that mainly revolves around gaming, with it’s primary business being e-Games Stations, or internet cafes exclusively dedicated to casino games. Through the company’s technology, users gain access to hundreds of casino games and even sports betting. Although they are in a lucrative industry, they haven’t had that much success in recent years as they struggle to become profitable.
What should be my next step?
As the stock has just recently broken out strongly from key levels, prices need to at least hold above the 3 to 3.2 area in order to retain its momentum. The next major resistances would be the 4.5 and 5 levels, with volume by price indicating that 4.5 could be the heaviest level it would need to break. Breaking out of 4.5 should cause the stock to experience less selling pressure, but we need to keep in mind that we are currently in a bear market, and even though the set-up looks good, most traders and investors might look to sell earlier than usual to lock in gains in a tough market.
Once again, KUDOS to AlMar for being this week’s Featured Trader! Enjoy your 14-day InvestaPrime Access and continue to be an inspiration to the trading community.
Physicians have x-rays and clinical tests. Sailors have their maps and compasses. Us traders have our charts. Especially for short-term traders, charts are essential as they will be present from planning to execution. As part of our mission to aid everyone in their financial journey, our InvestaCharts have always been a core part of our offerings. Our charts offer everything that a beginner, or even an expert, would need to map their way to profits. However, we don’t want to stop at just helping our users to be profitable. We want to provide users with charts that will help them become phenomenal traders. This is why we came up with a premium version of the InvestaCharts that can be used by our InvestaPrime members.
Want to take a glimpse into what new features you can use to chart out your trades? Scroll down below to see the features and examples of how they can be used
Delay-free experience
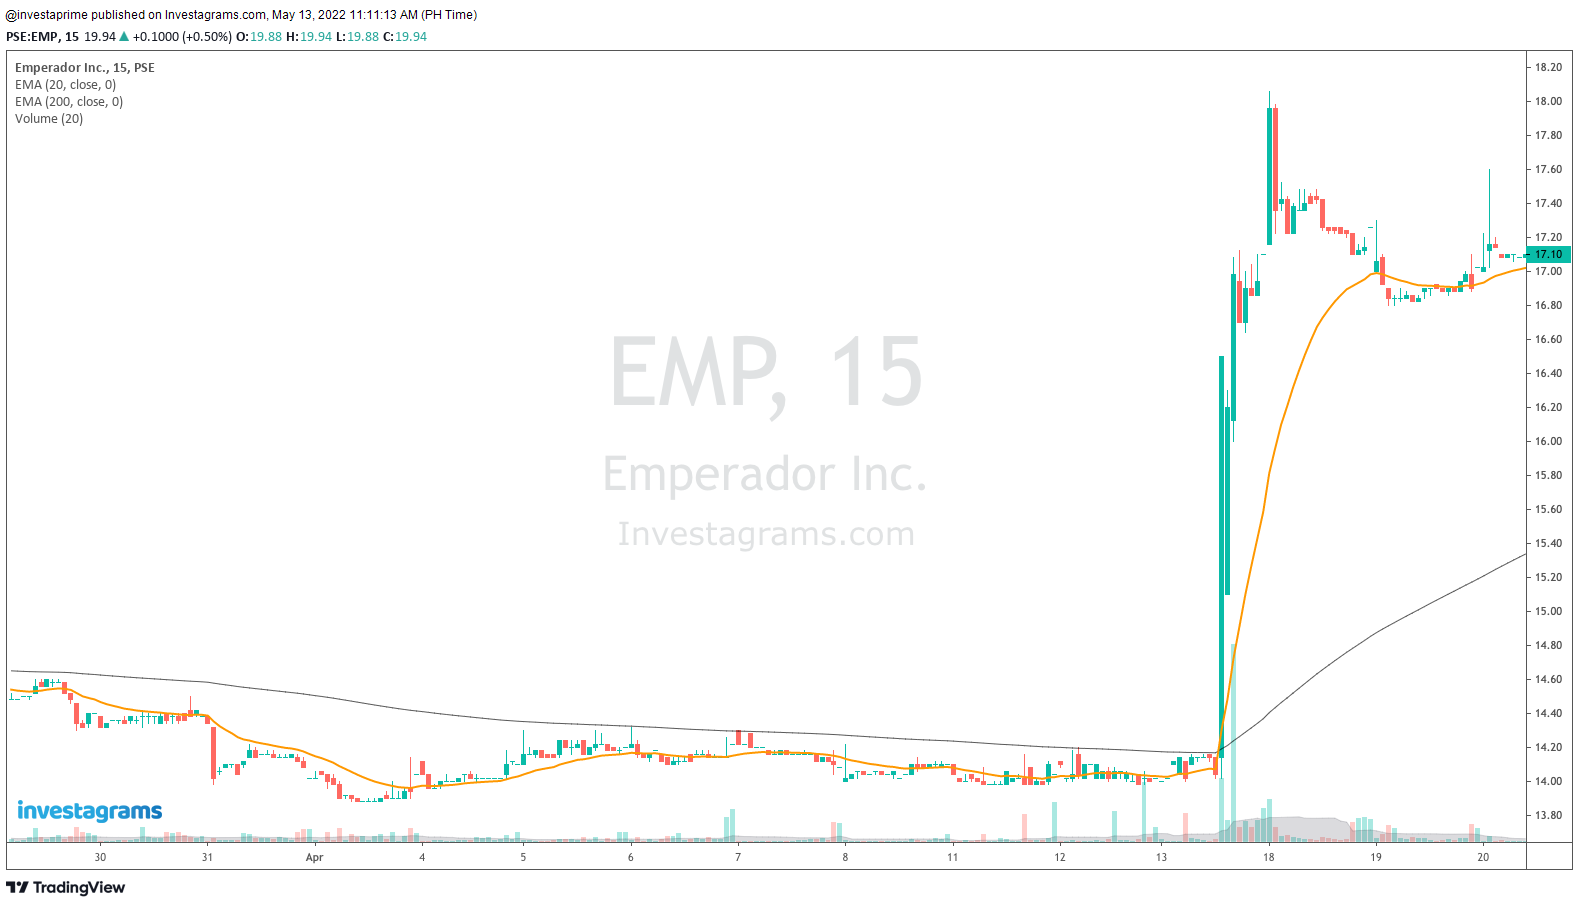
Having delayed data can be a hassle, especially for traders who need to execute quickly. Even a few seconds can become crucial when executing trades during an explosive breakout, what more 15 minutes? Unless you avail of the level 1 PSE data plan or an InvestaPrime subscription, you would be subject to delayed market data by up to 15 minutes.
For example, on the day PSE:EMP rallied, prices quickly soared within a matter of minutes. For Prime users and those who availed of a PSE data package, they wouldn’t have had a problem. However, users with a 15-minute delay, they would see a stock price of 14.04 whereas the price had already risen up to 16.50.
Premium indicators that automate charting for you
As traders grow and gain more experience, simple charting becomes easier. However, who wouldn’t want to have someone else do repetitive tasks for them? As an InvestaPrime member, you will be able to unlock premium features on InvestaCharts that help you automate your charting process.
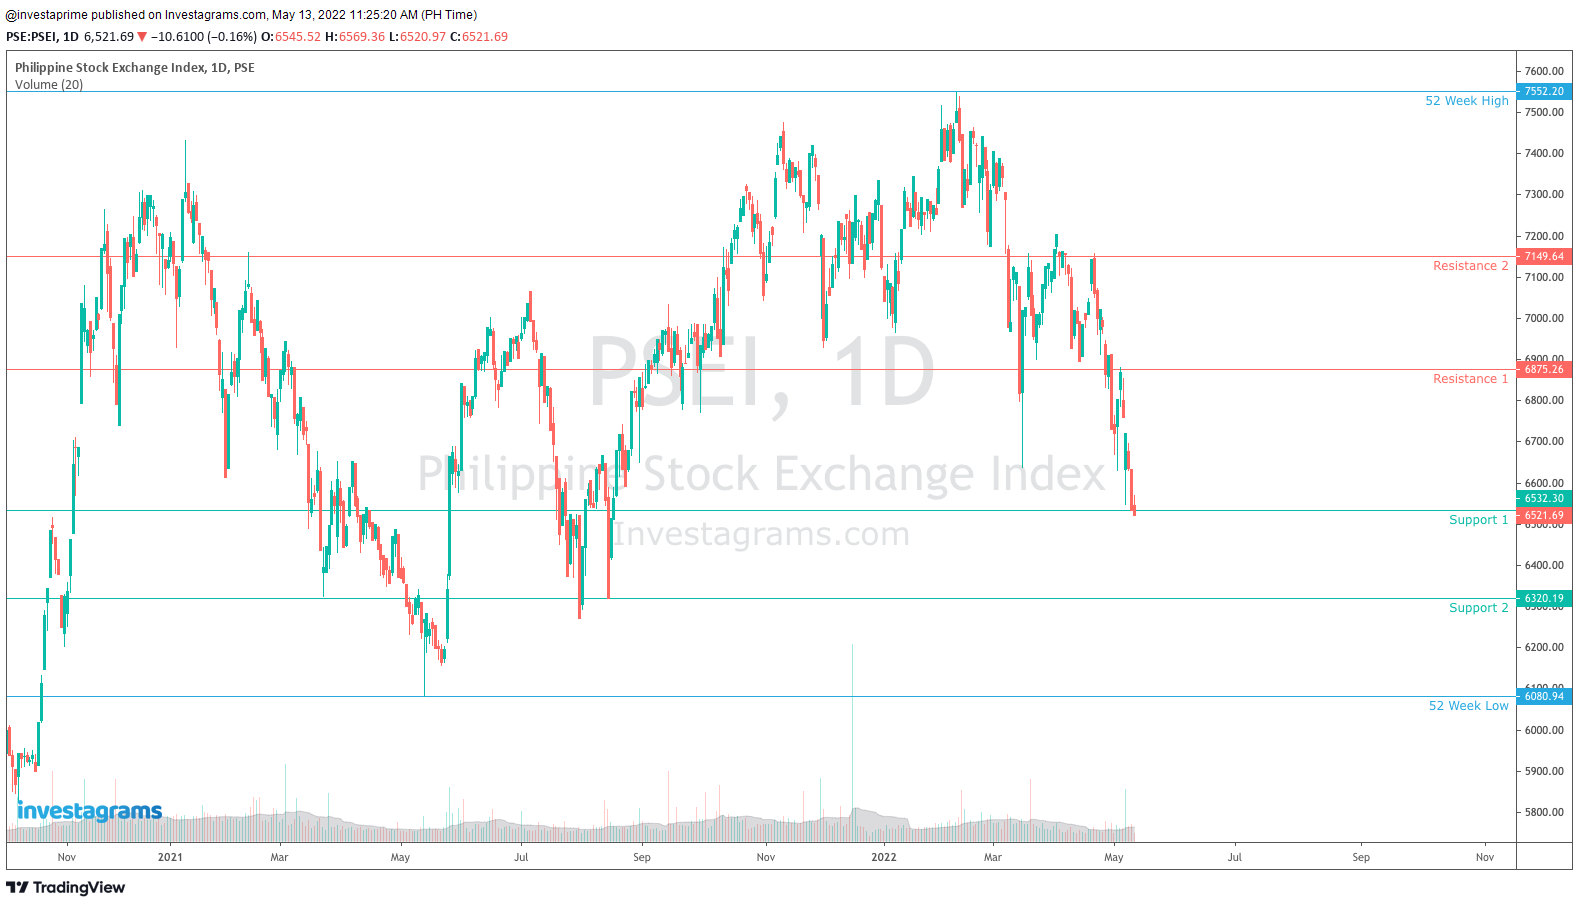
As a premium user of the InvestaCharts, you will have access to Auto 52-Week Highs and Lows as well as an Auto Support and Resistance that will help you plot important price levels faster.
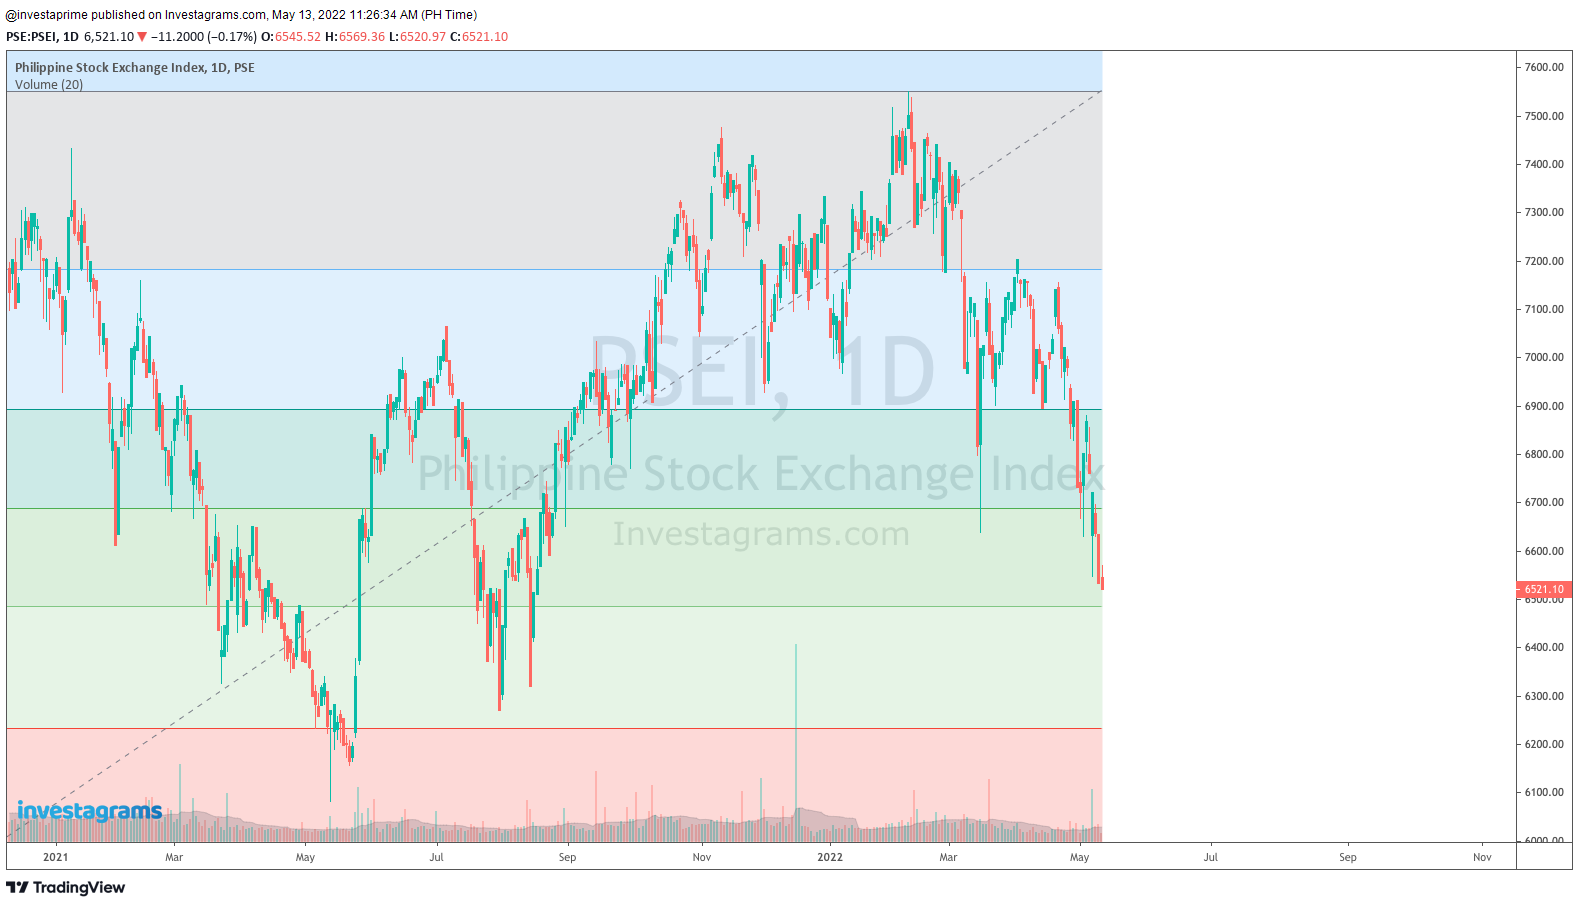
There is even an Auto Fibonacci feature that will help you save time when plotting your Fibonacci Retracement levels.
Premium indicators that give you a strong edge
Saving the best for last, we have developed premium InvestaChart features that will greatly help your trading decisions. Support and resistances are foundational concepts for every trader. Even as we get better, determining which levels hold the most importance will always be the challenge that we will face. Let’s look at how our features can help you with that challenge.
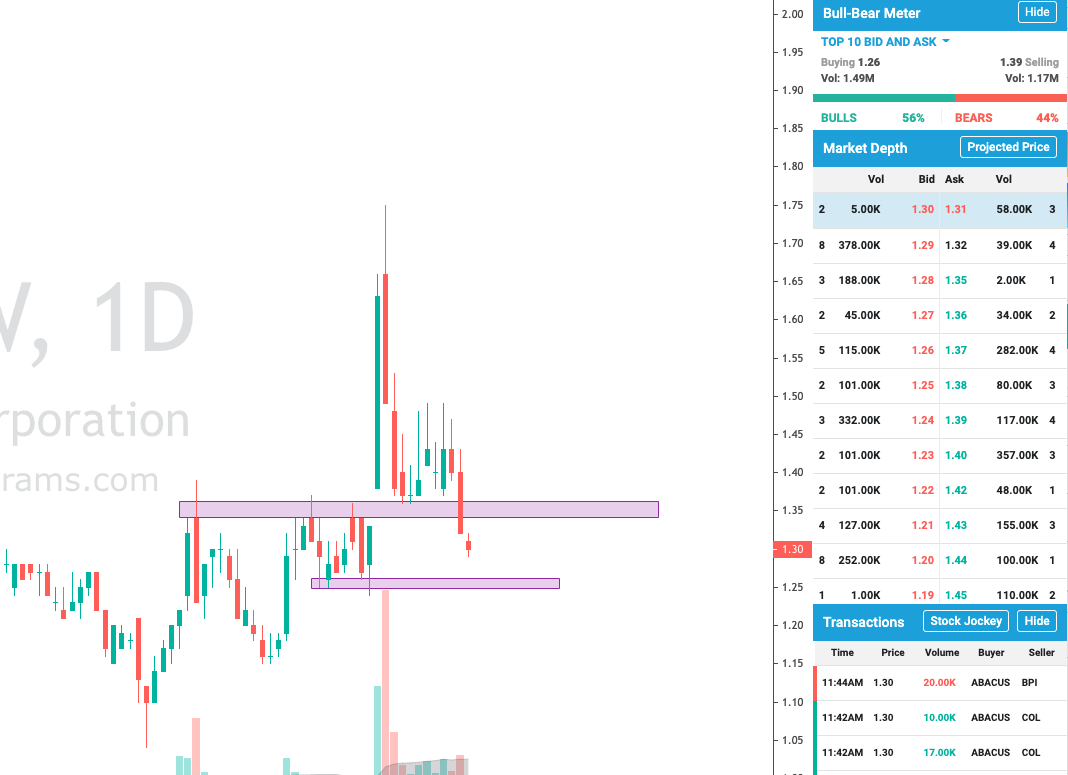
With the Bull-Bear Meter, we can help you determine if the Bid and Ask board is showing signs of demand and supply. A good example of how this can help would be for buy-on support strategies. In essence, buying on support is done because you expect that support area to be an area of demand. It would then make sense that when prices reach near that level, the bids and asks should show more eager buyers. Even if a level looks like a solid support, it wouldn’t mean anything if buyers don’t show up. With the Bull-Bear Meter, you wouldn’t need to check the board manually as the meter will weigh in all the bids and asks for you, telling you if buyers have shown up or not.
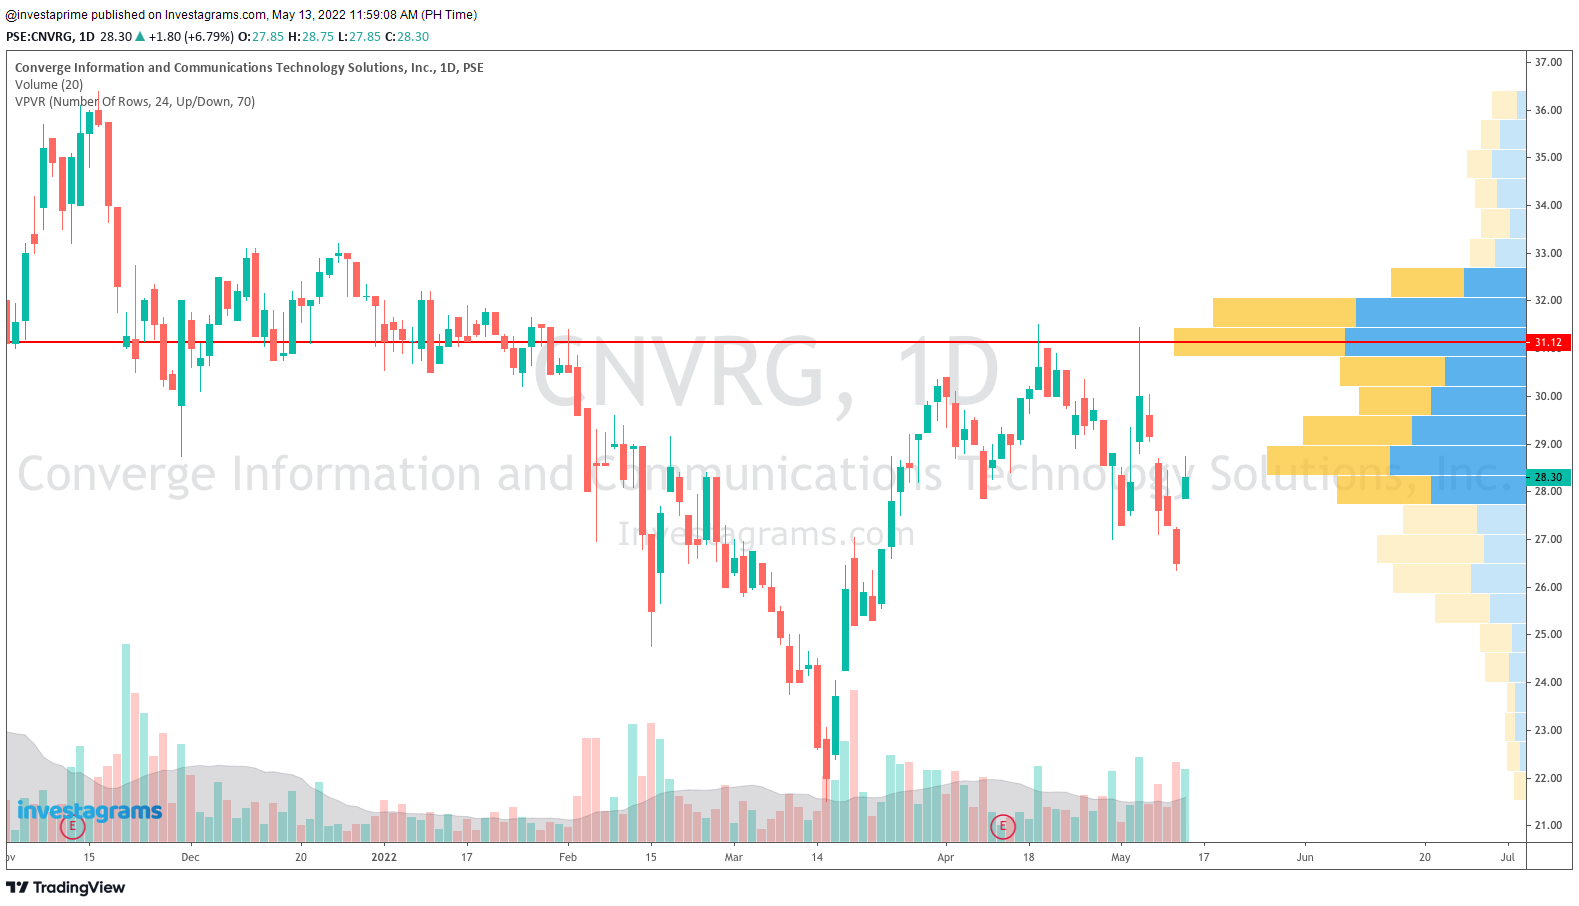
Another very useful premium tool that will help traders is the Volume Profile Visible Range. Basically, this tool plots out how much volume was traded per price point. A deeper understanding of supports and resistances would tell you that more volume on a support level signifies that the market deems that area a very cheap place to buy, whereas more volume on a resistance level would signify that there are participants there who have lost money and would most likely want to break even at the least. Thus, you can use the Volume Profile Visible Range to better understand what price levels hold the most psychological impact on the market and its participants.
They say that the only indicators needed for a trader to be great are price and volume. By being an InvestaPrime subscriber, the premium features of InvestaCharts will no doubt make it easier for you to study price action and will help you take a deeper look into the volume traded behind the prices.
Want to know more about what we offer? Head on over to the InvestaPrime landing page to look at all the features that we provide to our subscribers!
Let’s give a round of applause to GeldReich for being this week’s Featured Trader!
GeldReich has been a member of the Investagrams community since 2020, and he consistently shares his trading plans for his picks. One of the things that caught our attention was the number of details he put into his posts. It is obvious that he really spends time preparing the charts that he shares as he also indicates specific entries and exits along with his convictions for the trades.
A couple of weeks ago, our featured trader posted his trade idea for PSE:PHR. As a company in the tourism industry, investors started to take notice of this stock as hints of an economic re-opening started to pop up. Most are expecting the company to perform better once tourism gets back to 100% hopefully in the next few months.
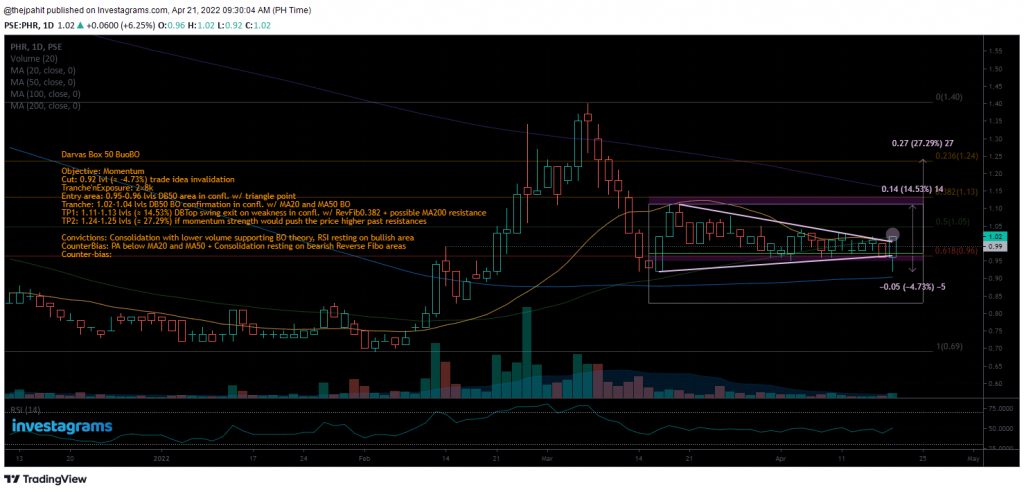
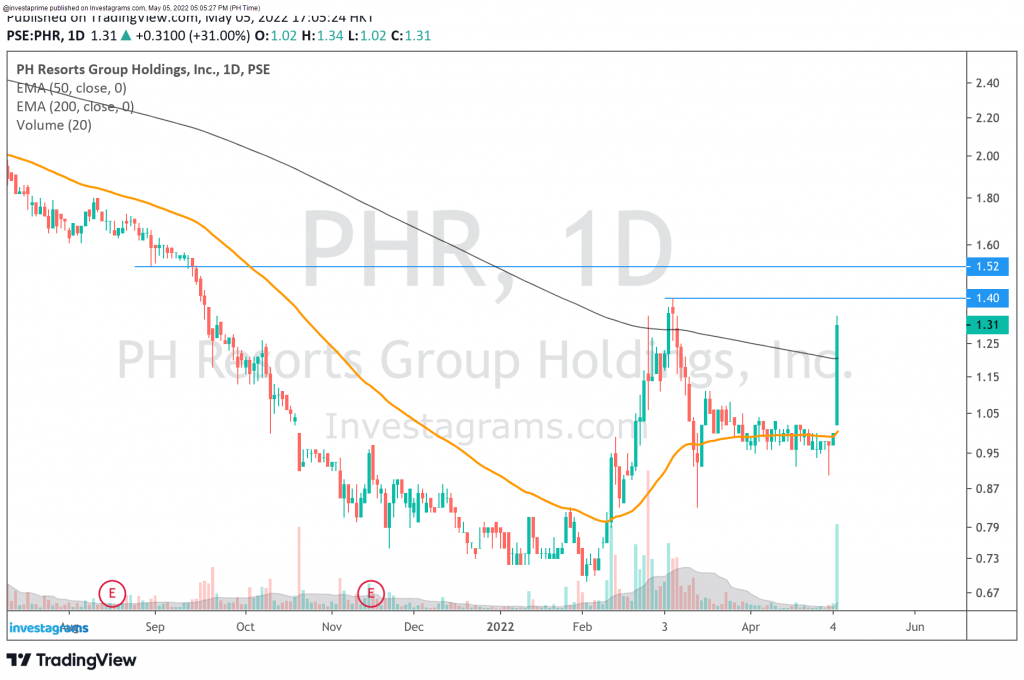
PSE:PHR actually came from a strong rally from its bottom a few months ago. Although the hype died down for the stock, the price found support above the 0.9 level as the stock went into consolidation. As bearish sentiment was prominent in the PSE for the past weeks, only a few really paid attention to PSE:PHR. GeldReich was one of the few who still looked for opportunities in the stock, and he felt that the consolidation was an opportunity for a momentum play.
TECHNICAL STANDPOINT
In terms of price action, PSE:PHR fell by a significant amount from the peak of it’s rally before finding support – a possible reason why not many traders still looked at this stock for trading opportunities. Our featured trader took note of this as well as he mentioned that the price consolidation actually formed at the lower ranges of the market structure’s Fibonacci levels. However, this didn’t mean that a big move is completely impossible. After finding support near the 0.9 – 0.95 area, volatility, as well as volume, quickly receded signaling that a big move could come. GeldReich also notes that the consolidation formed a symmetrical triangle, with different moving averages acting as key levels. Most notable is the 200 day EMA possibly acting as a resistance level.
FUNDAMENTAL STANDPOINT
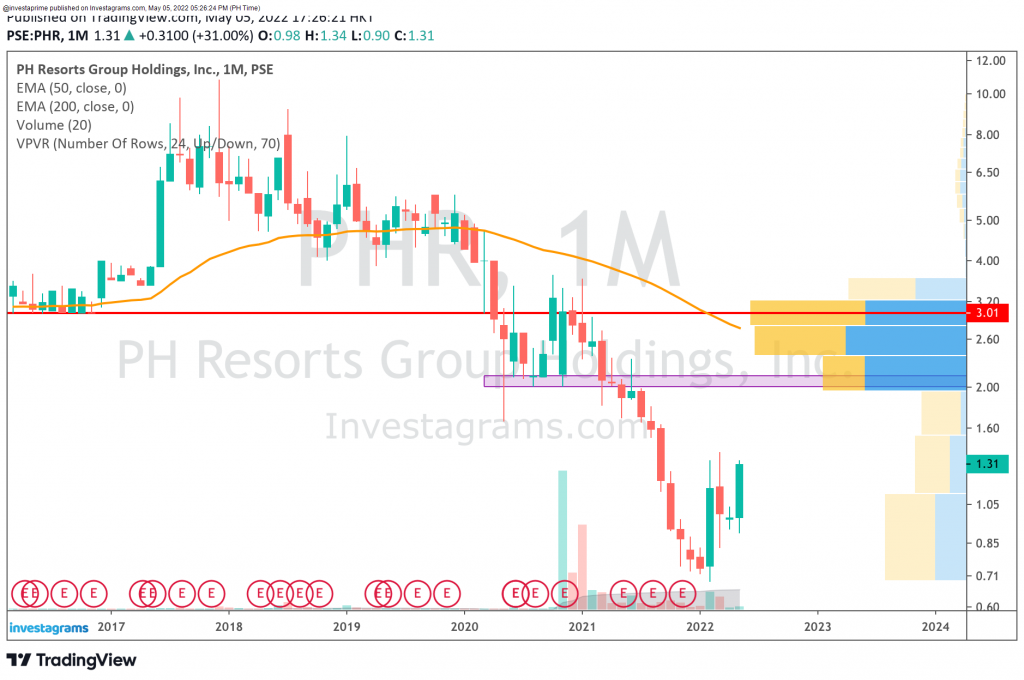
PSE:PHR mainly owns businesses that revolve around gaming, leisure, and tourism. It comes as no surprise that the pandemic caused the stock price to sharply fall and that covid restrictions becoming laxer could serve as a catalyst for a rally. With strong domestic demand along with the prospects of laxer travel restrictions and a resurgence of tourism in the Philippines, investors are starting to pay attention once again to this company. Although the financial numbers aren’t there yet, the market is pricing in rejuvenated cash flows in the coming months.
What should be my next step?
Even though PSE:PHR is showing some signs of strength, given the current market conditions it is still not fully advisable to aggressively trade momentum and continuation set-ups. However, this doesn’t mean that outliers don’t exist in weak markets. Looking at the bigger picture, it looks like 2.00 will be the next big level to look out for. Should you want to look for a trade, it would be best to wait for consolidation or continuation pattern to give you a proper entry with good risk to reward.
Once again, KUDOS to GeldReich for being this week’s Featured Trader! Enjoy your 14-day InvestaPrime Access and continue to be an inspiration to the trading community.
Practice doesn’t make perfect – perfect practice makes perfect. As traders, we could be charting, analyzing, and trading day in and day out non-stop. But, we could actually be just going within a loop and not improving even though we keep on doing the repetitions. It’s important to work hard, but being sincere in mastering the craft means more than just showing up – we need to look for the bitter pills and painful lessons that help cure our shortcomings and weaknesses. This is where mindfulness comes into action as we need to be aware of how our trades are playing out in order to find out how we can be better the next time. However, It can be overwhelming to do everything on your own – from building your trading logs to going through and creating the analytics for your trades. This can be troublesome. We know the pain, which is why we came up with the InvestaJournal, a tool to help you work on yourself and even bigger trading returns. More than just being an all-in-one solution for trading notes and tracking your portfolio, the InvestaJournal features a wide variety of advanced analytics that can help you level up your trading game.
Let’s see how convenient and powerful the InvestaJournal is in helping us grow as traders.
Creating a journal account
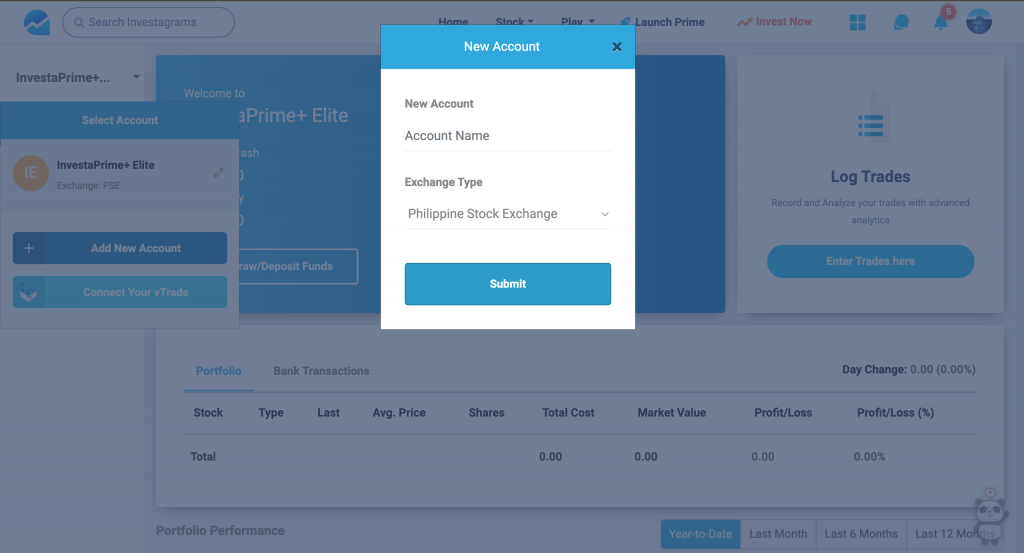
Once you have access to the InvestaJournal, creating journals is as easy as just clicking a few buttons. You just need to click on the add account button on the right to start making a new trading journal.
You are free to make as many trading journals as you’d like should you need to create multiple for organizational purposes.
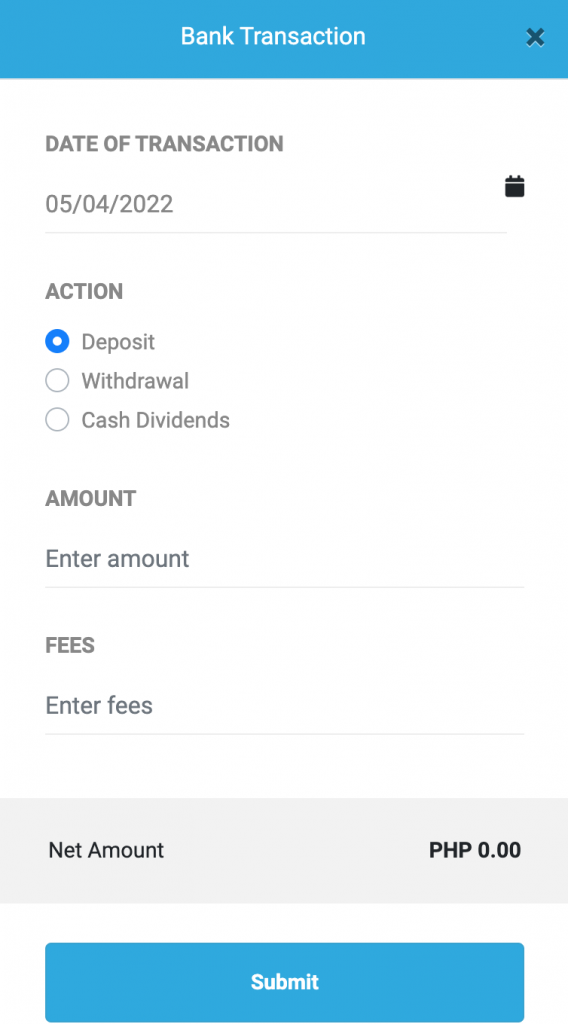
Logging deposits and withdrawals
The next step towards building your own trading journal in the InvestaJournal is to input how much capital you’ve put into your trading account. Again, this will be as simple as just clicking a few buttons. Simply go to the portfolio tab, and you’ll find the option to add deposit and withdrawal transactions.
Adding these transactions shouldn’t take long as all you need to do is input how much you withdrew or deposited when you made the transaction, and how much the transaction fees were.
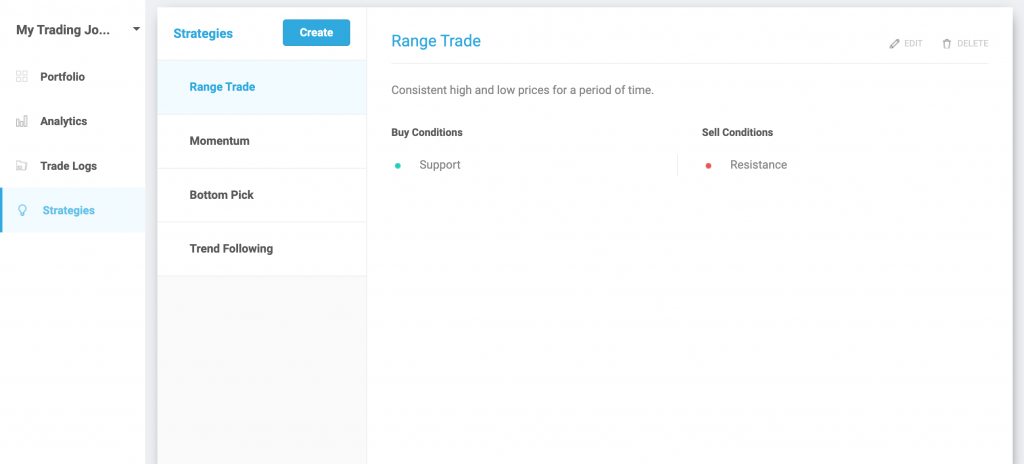
Setting up strategies
Should you have multiple strategies under your belt, you can list all of them in your journal so that you can tag what strategy was used per trade that you made.
You can even add buy and sell conditions, along with a description of your strategy should you need to review your rules on a later date.
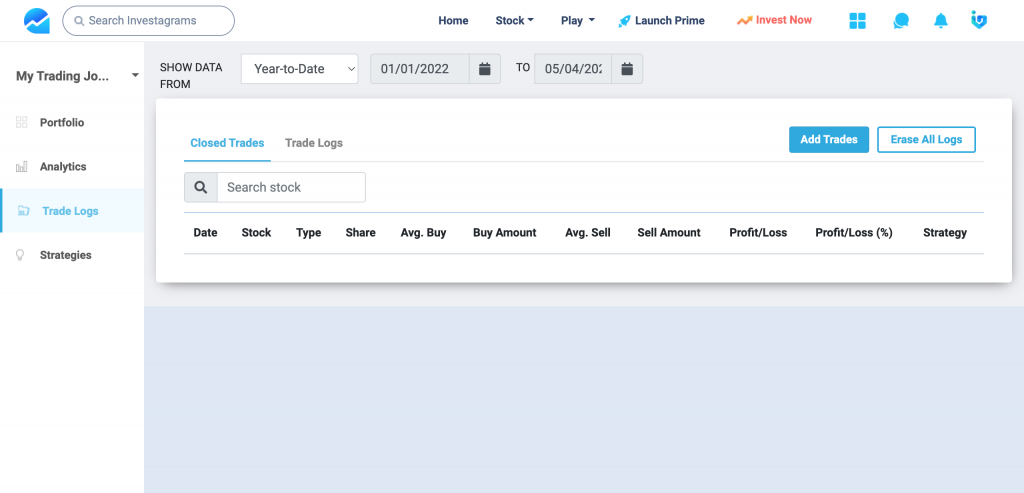
Logging trades
Of course, what’s a trading journal without our trade executions? To start taking note of trades, you can head on over to the Trade Logs section and select the option to Add Trades.
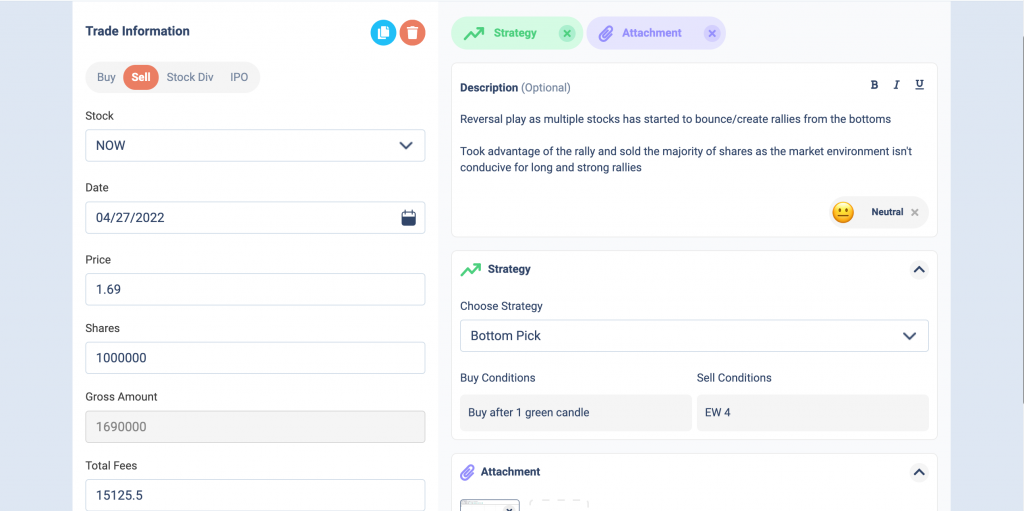
Here’s the fun part: while adding your trades the InvestaJournal will let you do a lot of neat customizations. Aside from adding the trade details (ex. Price and amount of shares), you can also add notes such as what you could have been thinking while executing the trade. In addition, you will also have the capability to add what strategy you used for the trade as well as a screenshot of the chart to further help you when reviewing.
You can even take note of what you felt! You can use the emojis in the description to note if you were happy, neutral, or fearful.
BONUS: Should you need to input a big amount of trades from your brokerage account, the InvestaJournal can save you time by simply importing your ledger to the journal! Just choose the import option and simply follow the instructions for the brokerage that you are importing data from.
Analyze, analyze, analyze!
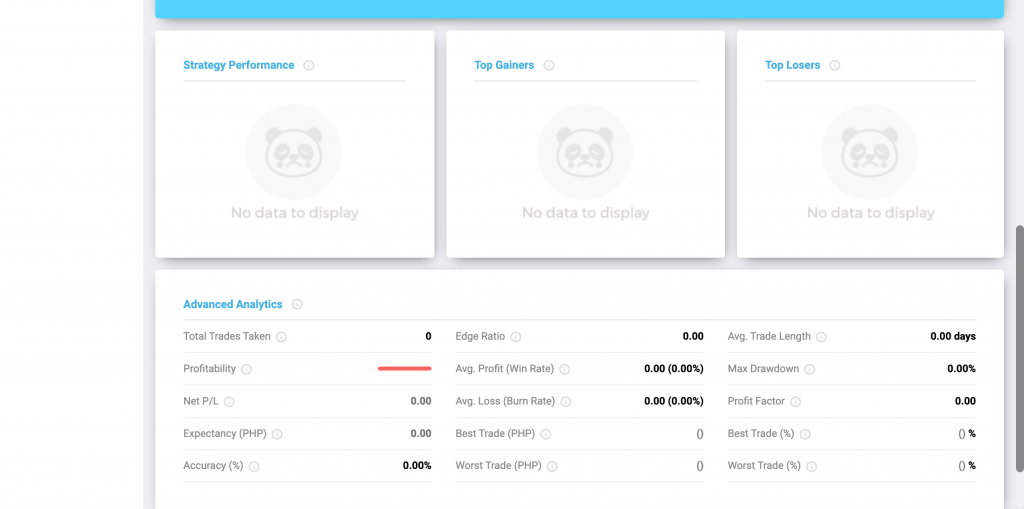
Once all the data is set, you’re good and ready to start analyzing your trades. InvestaJournal still includes basic information such as the current equity value along with realized rofits and losses. However, what sets it apart are the advanced analytics that you can take advantage of in order to find improvements left and right.
For example, statistics such as Avg. Profit can be used to determine if you really make the most out of your trades. If ever you feel like you take profits off the table too soon and want to explore holding on to a bigger portion of moves, this statistic could help you gauge how you’re improving. The InvestaJournal even shows you how strong your different strategies compare with one another, so you can see what strategy really works best for you!
Although the InvestaJournal is really simple and easy to use, it will surely make an impact on your development as a trader. We guarantee you that you will be able to find a lot of insights through the InvestaJournal that will let you take the next step towards mastery.
Want to know more about what we offer? Head on over to the InvestaPrime landing page to look at all the features that we provide to our subscribers!
Let’s give a round of applause to EliasAlon for being this week’s Featured Trader!
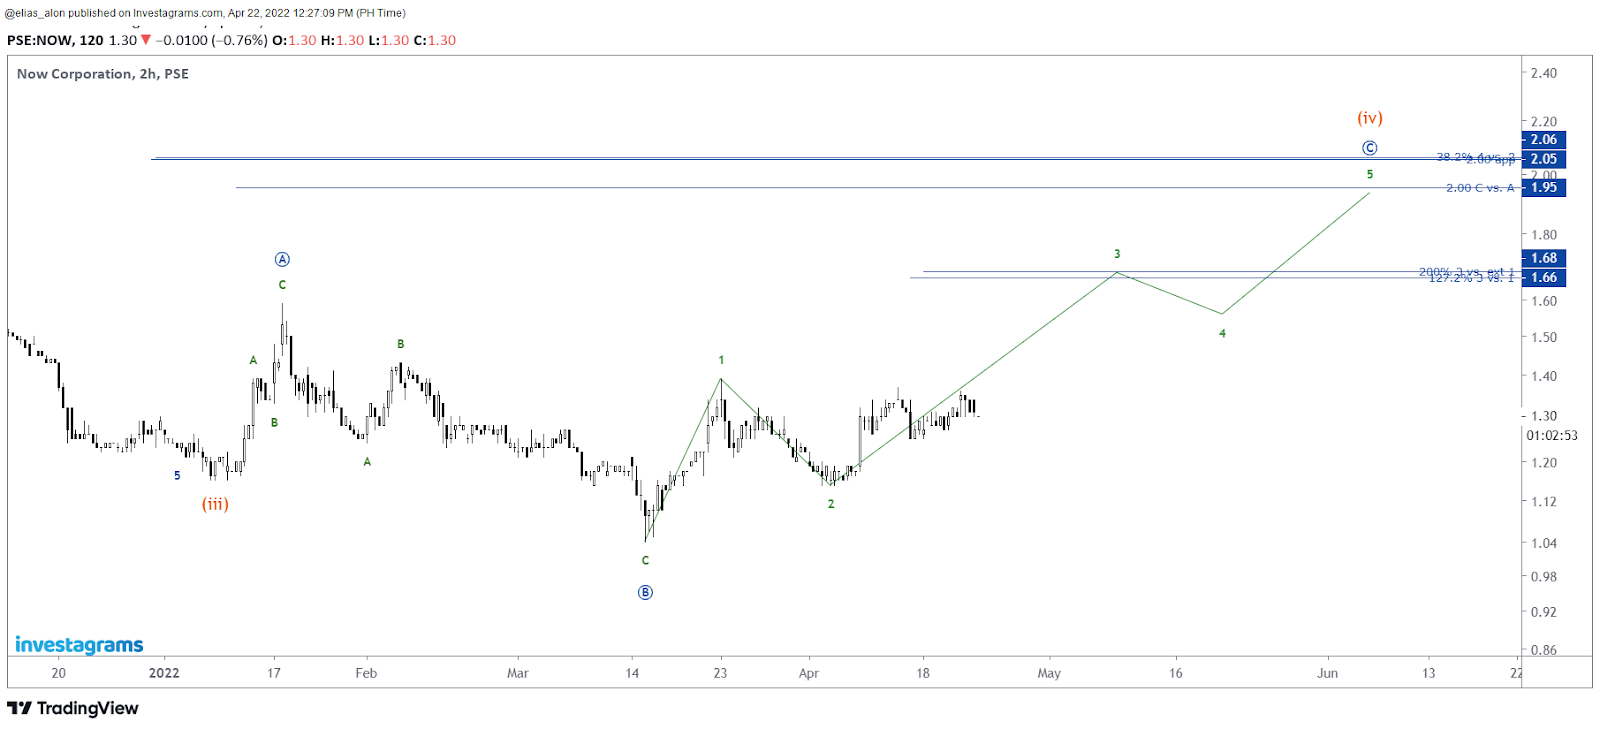
EliasAlon has been a member of the Investagrams community since 2018. Although he was not a frequent poster in his early days, he has recently become more active on our social media platform as he shares his insights on the stock market. It is noticeable that EliasAlon is a trader who relies heavily on Technical Analysis and seems to be fond of using the Elliot Wave Theory to guide his trading decisions.
Just a few days ago, our featured trader posted his views on PSE:NOW. A lot of veteran traders are familiar with Now Corporation as the news back then was that it would become the third telco player in the Philippines. Although the plans did not push through, they are still providing services in areas such as Telecommunications, Media, and Technological spaces.
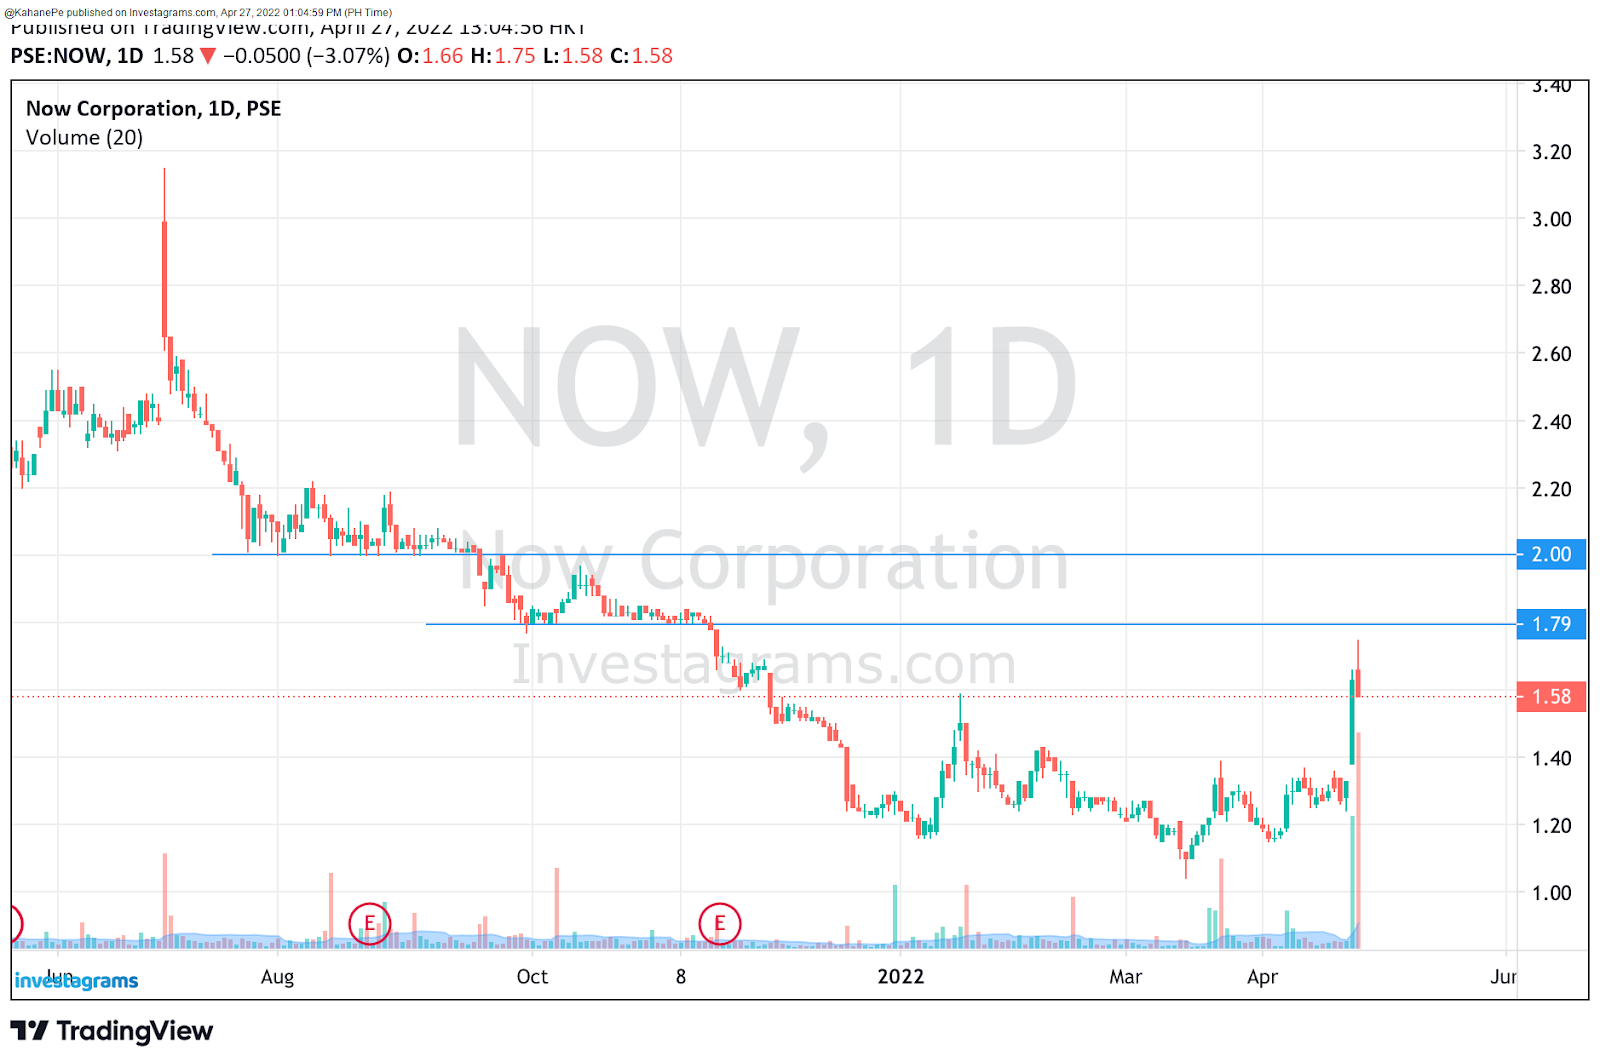
As it has already been a while since the majority of stocks in the local market experienced heavy selling pressure, a lot of select stocks have been recovering and confirming that they have hit their bottoms. PSE: NOW looked to be one of them as it found support near the 1.1 to 1.2 area. What caught EliasAlon’s attention was how PSE:NOW’s big picture market structure was forming. Based on his Elliot Wave Count, he believes that the stock is currently in a motive wave C where the ultimate target price for the medium-term move is at around PHP2.00 per share.
TECHNICAL STANDPOINT
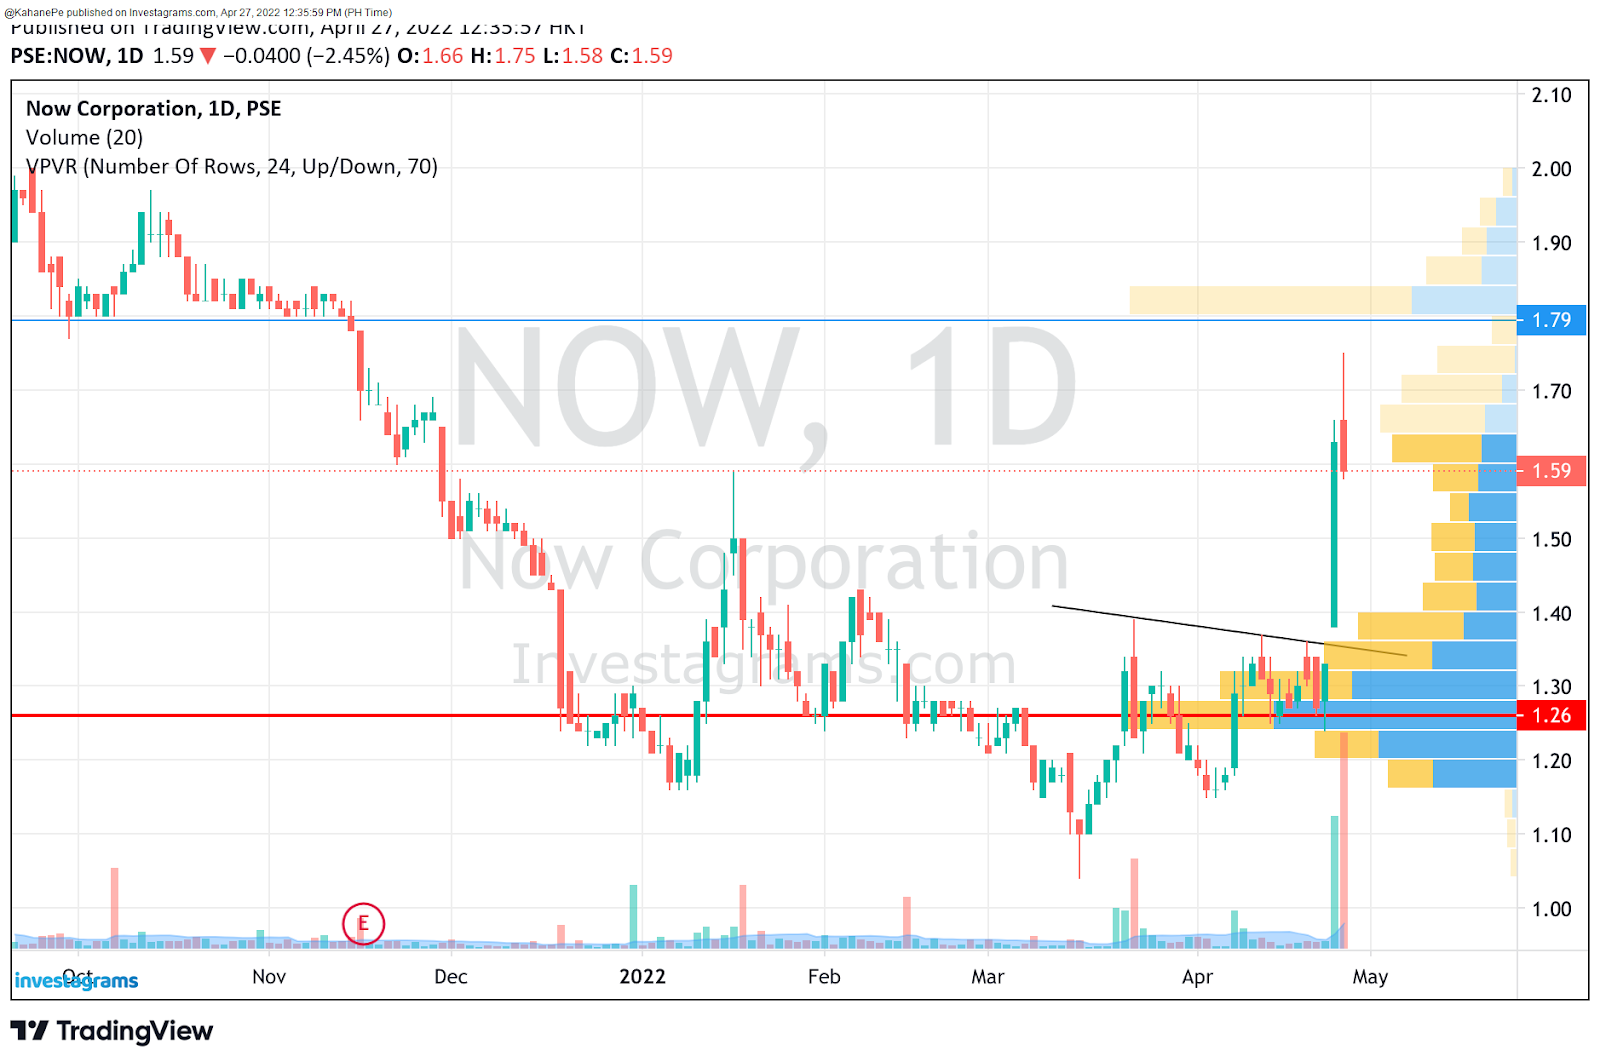
In terms of price action, PSE:NOW came from a strong downward move as did a majority of stocks during the past month. As prices found support near the 1.1 to 1.2 area, volume started to pick up. If you haven’t already known, our charts at www.investagrams.com/Chart already provide traders with a volume profile tool to see what price levels saw the most transactions throughout the timeframe in the chart. As can be seen, the sell-off saw only little selling volume indicating that shareholders don’t believe PSE:NOW should be valued at those low prices. As the bottom was forming, a lot of trading volume came in indicating a bullish bias as investors took the chance to buy at cheap prices. Once the breakout came, the stock pretty much had a runway as there was very little selling pressure.
FUNDAMENTAL STANDPOINT
PSE:NOW is a telecommunications company that provides users with broadband services. As new laws now allow Philippine companies to be fully owned by foreign entities, the company has been making preparations. They have recently appealed for, and have been granted approval, a re-structuring of their organization. Most likely in the hopes of attracting foreign investors, in the hopes of attracting more capital to fuel their growth.
What should be my next step?
Despite the strong move, traders should still be cautious when trading PSE:NOW. Despite some strong moves in select stocks, the broader market still isn’t out of the woods and actually has a low probability of rallying upwards. With all of the macro headwinds hindering the Philippine stock market, traders and investors are advised to stay light when handling trades. On a more micro-level view, PSE:NOW is already at big resistance levels 1.8 and 2. Should you have already profited from this, the next plan of action would most likely be to sell even just a portion, or to atleast put in your trailing stops. It wouldn’t be impossible for PSE:NOW to come out as an outlier, but we shouldn’t bank on the idea as the stock would need to trade above 2 first before we can even start to think if a major uptrend would be in the works.
Once again, KUDOS to EliasAlon for being this week’s Featured Trader! Enjoy your 14-day InvestaPrime Access and continue to be an inspiration to the trading community.
Traders are often compared to athletes. In performance sports like Basketball and Football, competitors need to hone their skills. Intentional practice is needed, and to reach the highest levels, attaining 10,000 hours becomes a necessity. Trading is no different. Being one of the greats entails putting in hard work and dedication to honing one’s craft. Often, an underrated habit in getting better at performance sports is picking the brain of others. It is a necessity in competitive endeavors to learn from others; to study techniques, strategies, habits, and even dialogue on the peculiarities of the game. For athletes, it’s as simple as watching recordings to study and take notes. It’s as simple as walking up to teammates to talk about plays. For traders, research is abundant, but rarely can you see articles that really encapsulate the mindset of a trader – from ideation to the execution details.
We want you to be the BEST trader that you can possibly be, which is why we want to be the best trading teammate you’ll ever have! To make it easier for traders to look into the minds of how successful traders and fund managers work, we came up with InvestaPrime+ Research. More than just providing information on the markets, our InvestaPrime+ Research write ups will provide you with in-depth details on what our in-house traders really think and feel regarding the current state of the markets, along with what they plan to do and why they are making those decisions.
Let’s see examples of how InvestaPrime+ Research will assist you in your development as a trader!
Out of ideas? We got you.
Trading involves a lot of creativity. Especially when times are tough, traders have to be creative and see where is the money flowing into. However, let’s face it – sometimes it’s hard for us to look for which market or sector the smart money is going into when all we see in the usual markets we trade in are downtrends with setup opportunities nowhere near in sight. Even if we already have a solid trading foundation and are able to stand on our own, it’s always helpful to get a hint as to where to look for trades every now and then.
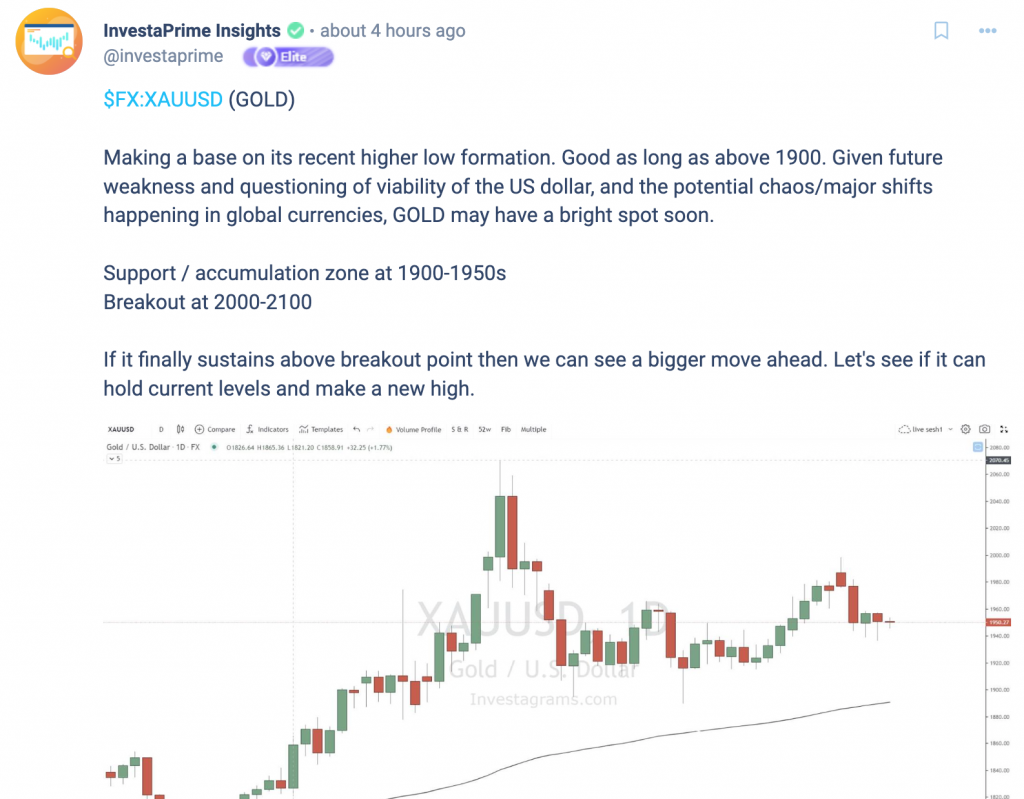
Let’s say you already checked the PH and U.S. stock markets along with the crypto market, it might still be hard for you to look for trades if you purely trade uptrend continuations and momentum patterns. With InvestaPrime+ Research, you will be able to see posts frequently about the different opportunities available across a variety of markets should you run out of ideas.
Want to validate your opinions and look for better ways of analyzing events?
As we develop as traders, we start to learn more and more about what is happening with the general market and how it affects our trading. When we gain more experience, we are able to discern events with a better eye, and it always pays to have better insights as this allows us to adjust our trading plans to the possibilities that have a higher chance of happening.
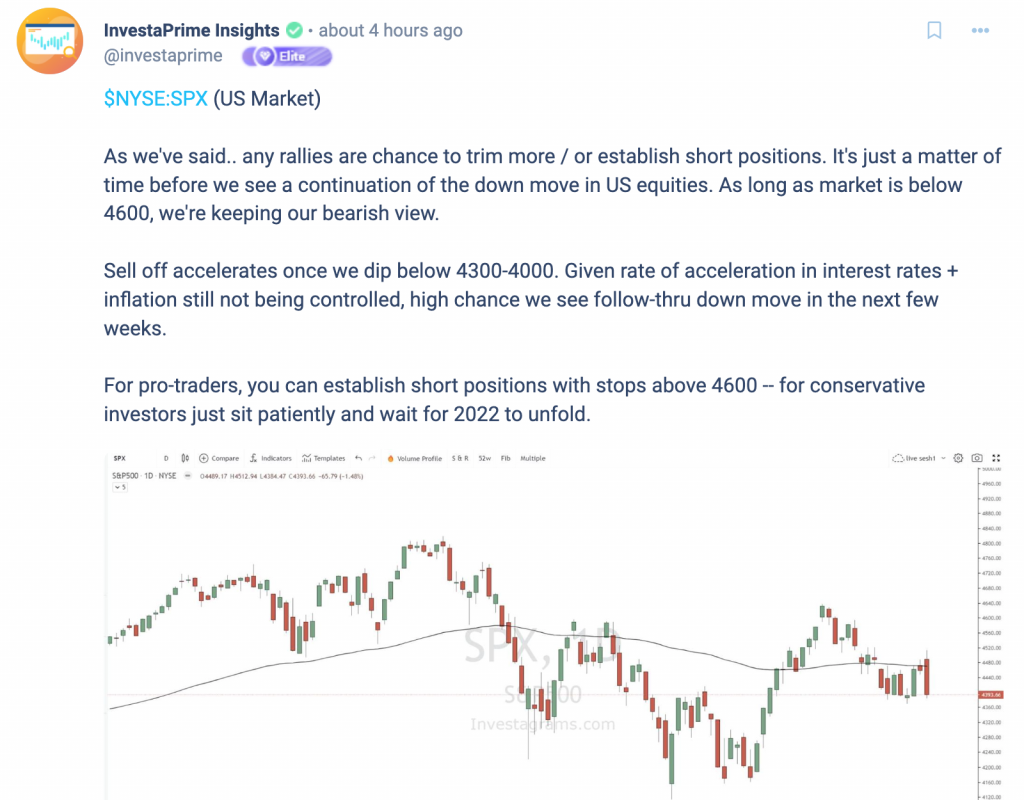
For example, every trader who has had some bit of experience in the markets would probably already know that the US markets are in a tough spot right now. By being a prime subscriber and having access to InvestaPrime+ Research, you would have access to deeper insights coming from traders who not only have a lot of experience, but also walk the talk. More than just knowing that the market is in a downtrend, you will see actionable takes that can be taken and even dissected for your benefit.
Want to know the other side of your trade?
As traders, there will always come a time where opinions differ. Rather than shying away from contrasting opinions and arguments, we should look at them as opportunities to see things from a different perspective. Whether or not someone is right or wrong, we are all students of the markets. It doesn’t matter if you already have 10 years of experience or if you just completed your first year, everyone can always learn something new from another trader.
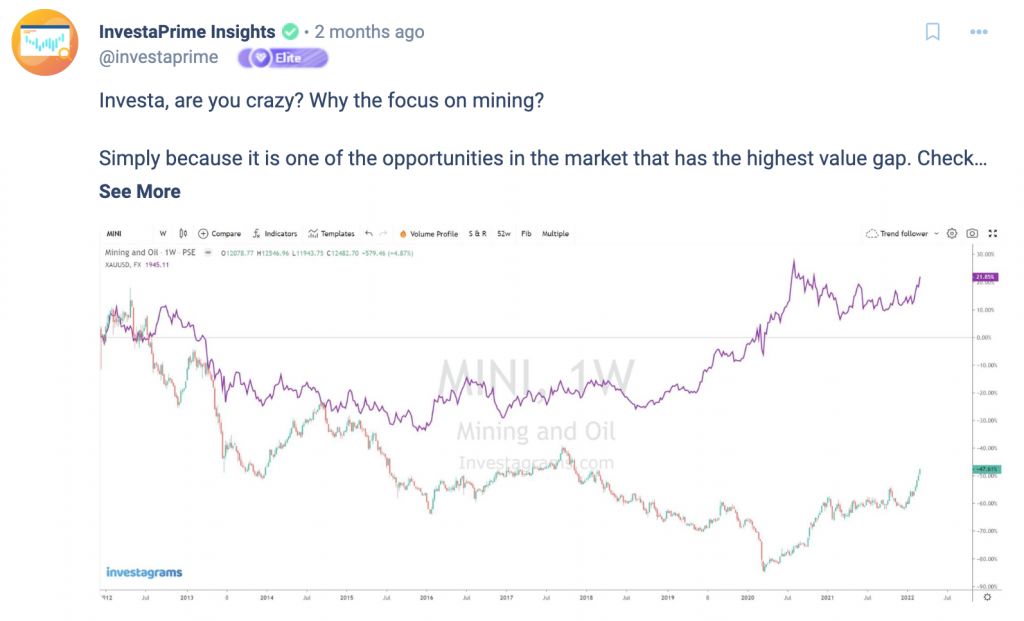
For instance, our take on the mining industry. It might not have been a popular opinion and some people did not see the potential. However, we believed that there was a lot of potential in the industry and the rally manifested. Of course, we could have been also wrong; we will never claim to know how the future will unfold. However, we will aim to give you our BEST analysis so that you can take trades that we believe have potential, compare and contrast the differing opinions to hone your own analytical skills, or even do both.
The snippets shown here are just samples of the multitude of insights that we provide to our Prime+ subscribers through InvestaPrime+ Research. Again, the goal here is to be the best trading teammate you’ve ever had as we aim to provide you with extensive research and analysis.
Want to know more about what we offer? Head on over to the InvestaPrime landing page to look at all the features that we provide to our subscribers!