Let’s give a round of applause to buMalo for being this week’s Featured Trader!
buMalo is an active trader who has been with the Investagrams community since 2018. He is very active in the community and frequently shares his trades.
A few days ago, our featured trader posted his re-entry trade in ABA. A hot stock in the local market recently, ABA has been providing investors handsome returns as it has been making new 52-week highs.

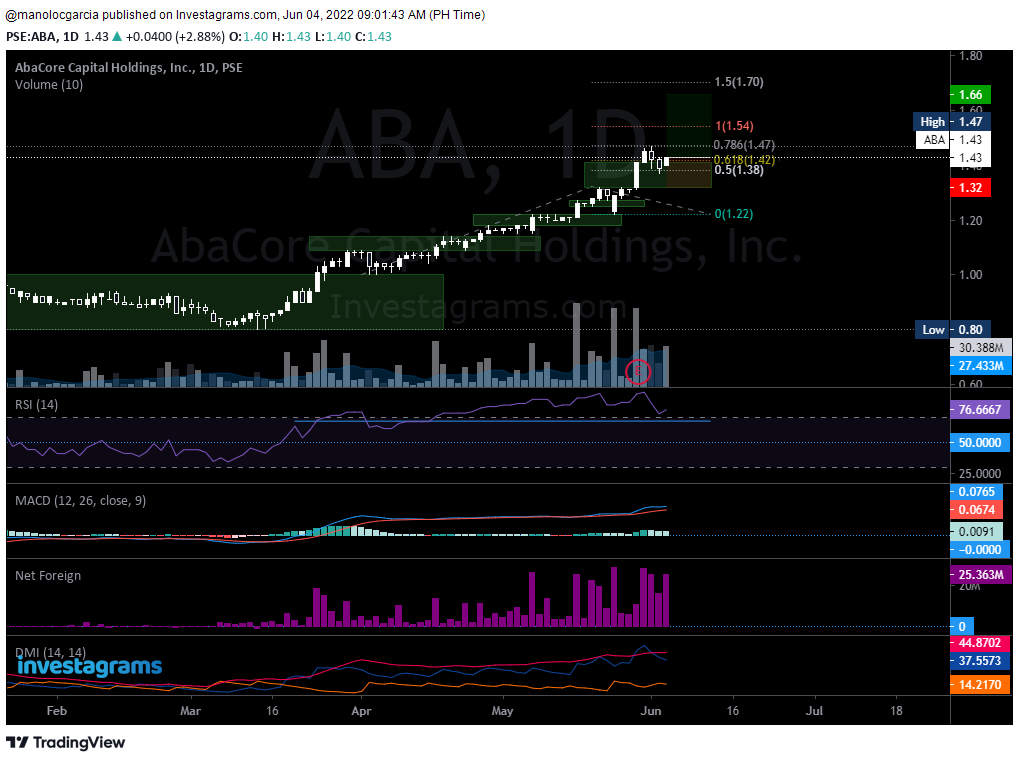
As the stock was going up, buMalo looked for a place to re-enter his position and found a small pocket as a chance to make a momentum play. He re-entered on the break of 1.42 as he felt that momentum was still strong for the stock. With RSI still being above 70, this is a good sign for momentum plays as it means there is still strong demand for the stock.
TECHNICALS OF THE TRADE
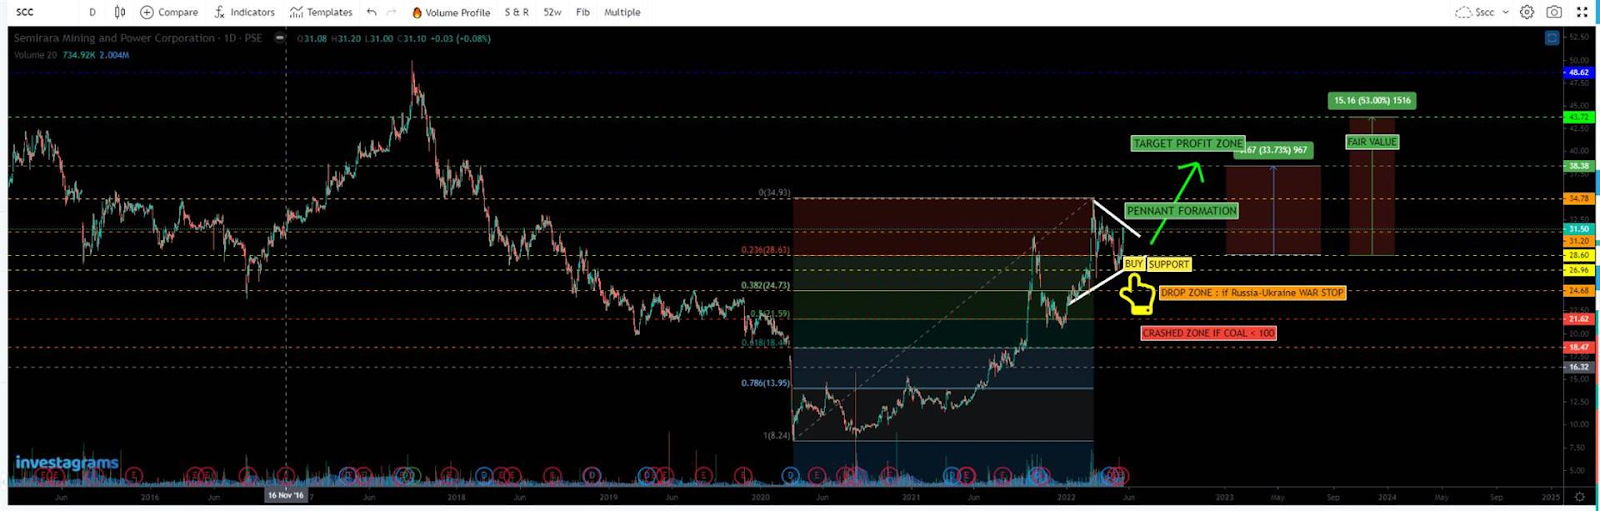
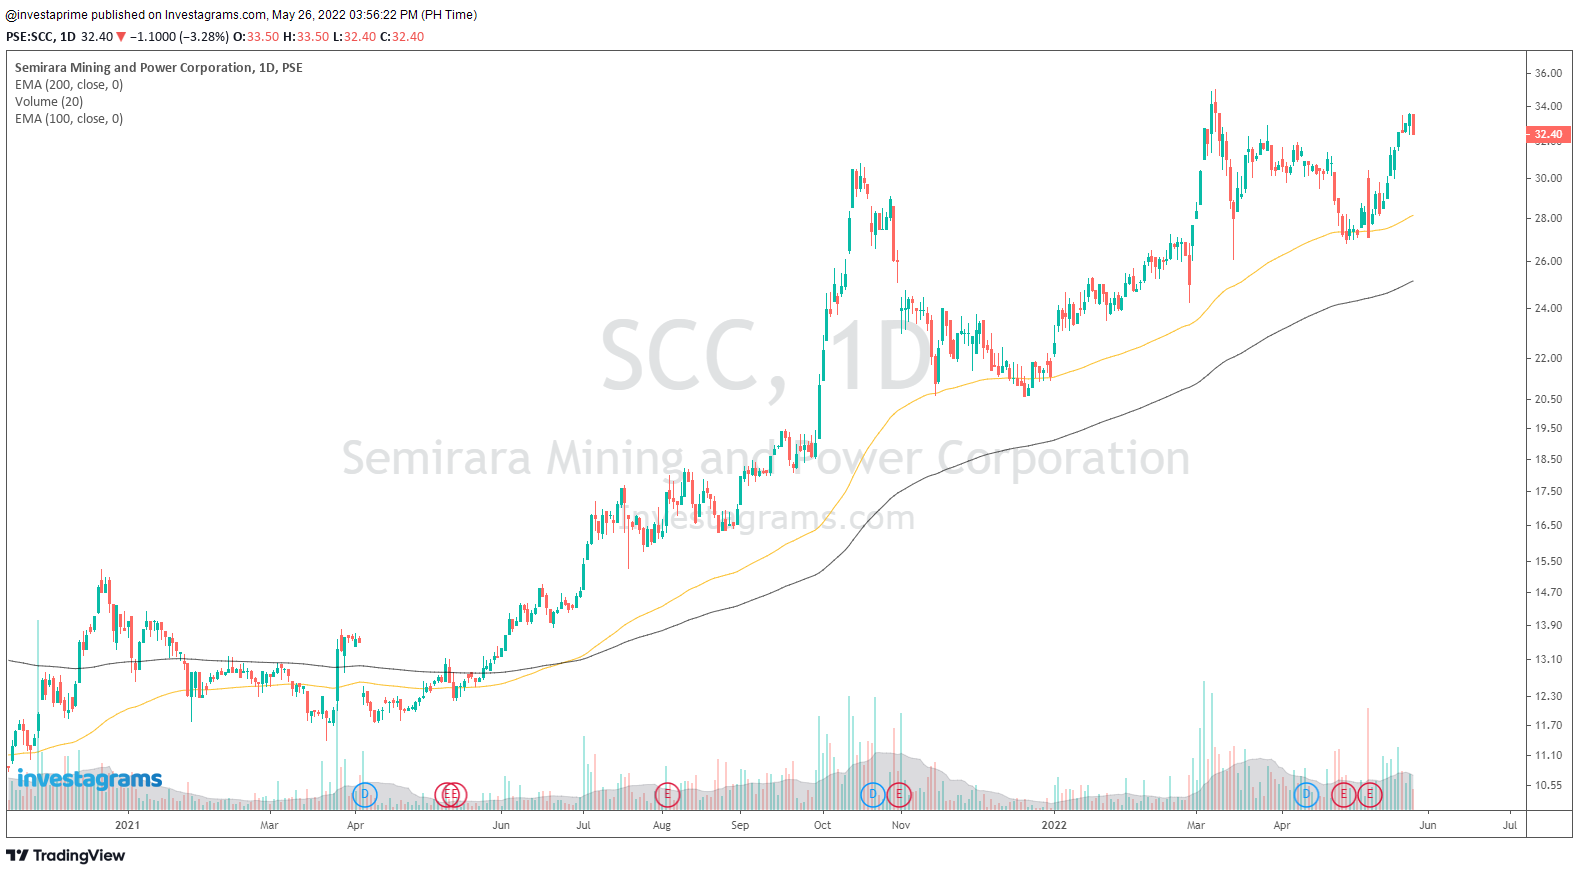
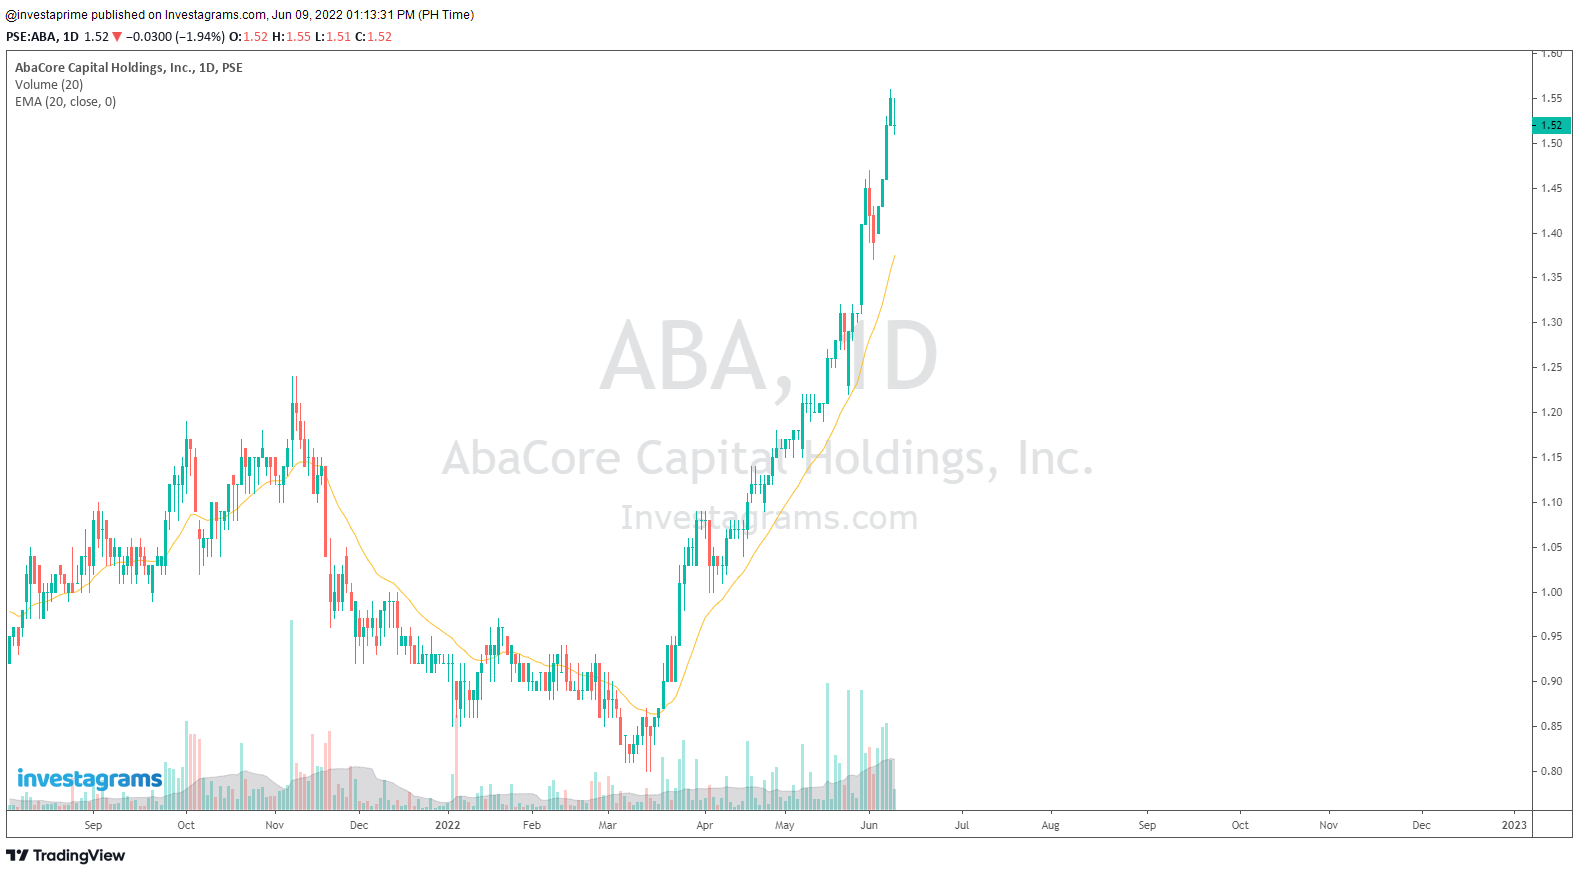
Technically speaking, ABA has proven to be a strong outlier in the Philippine Stock market. While others are falling, it has shown strength as it continues to move upwards strongly. It came from its bottom near the 0.85 area and went into a frenzy once the long-term downtrend line was broken. Most of the consolidations were short-lived and rarely experienced strong downward volatility. The stock is currently looking to break the 1.56 and 1.88 levels, the next major resistances it has to take out in order to reach new all-time highs.
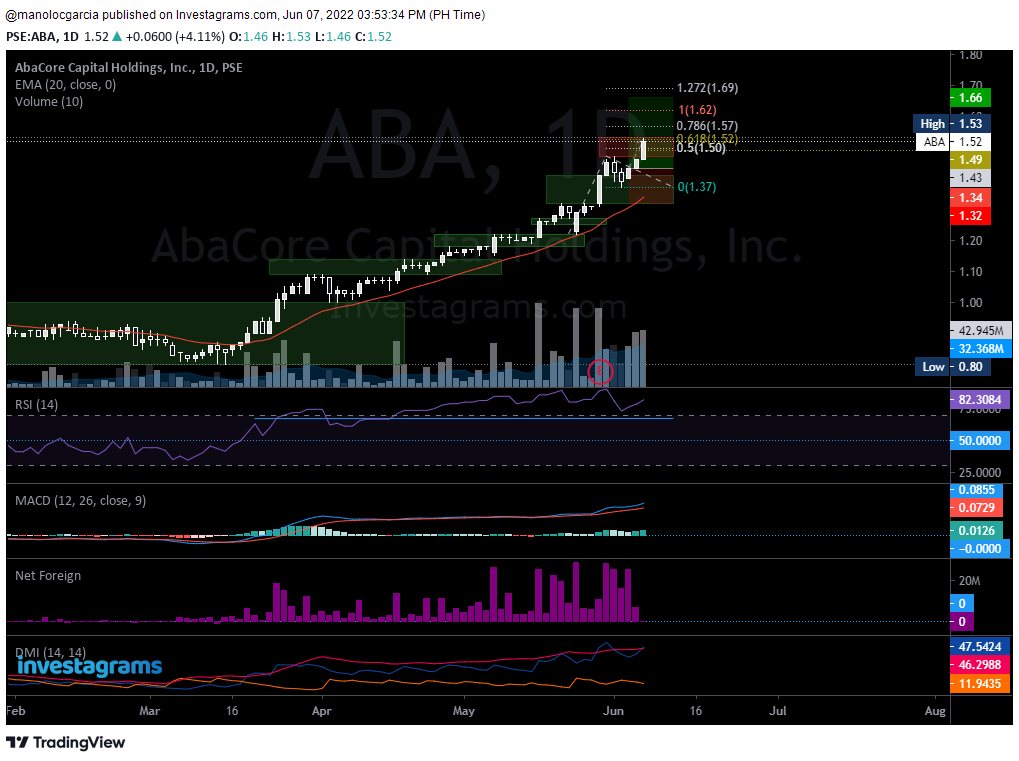
buMalo is confident that prices will continue to rise as different momentum indicators are still pointing upwards, in addition to Net Foreign Buying still going strong.
FUNDAMENTAL CATALYSTS
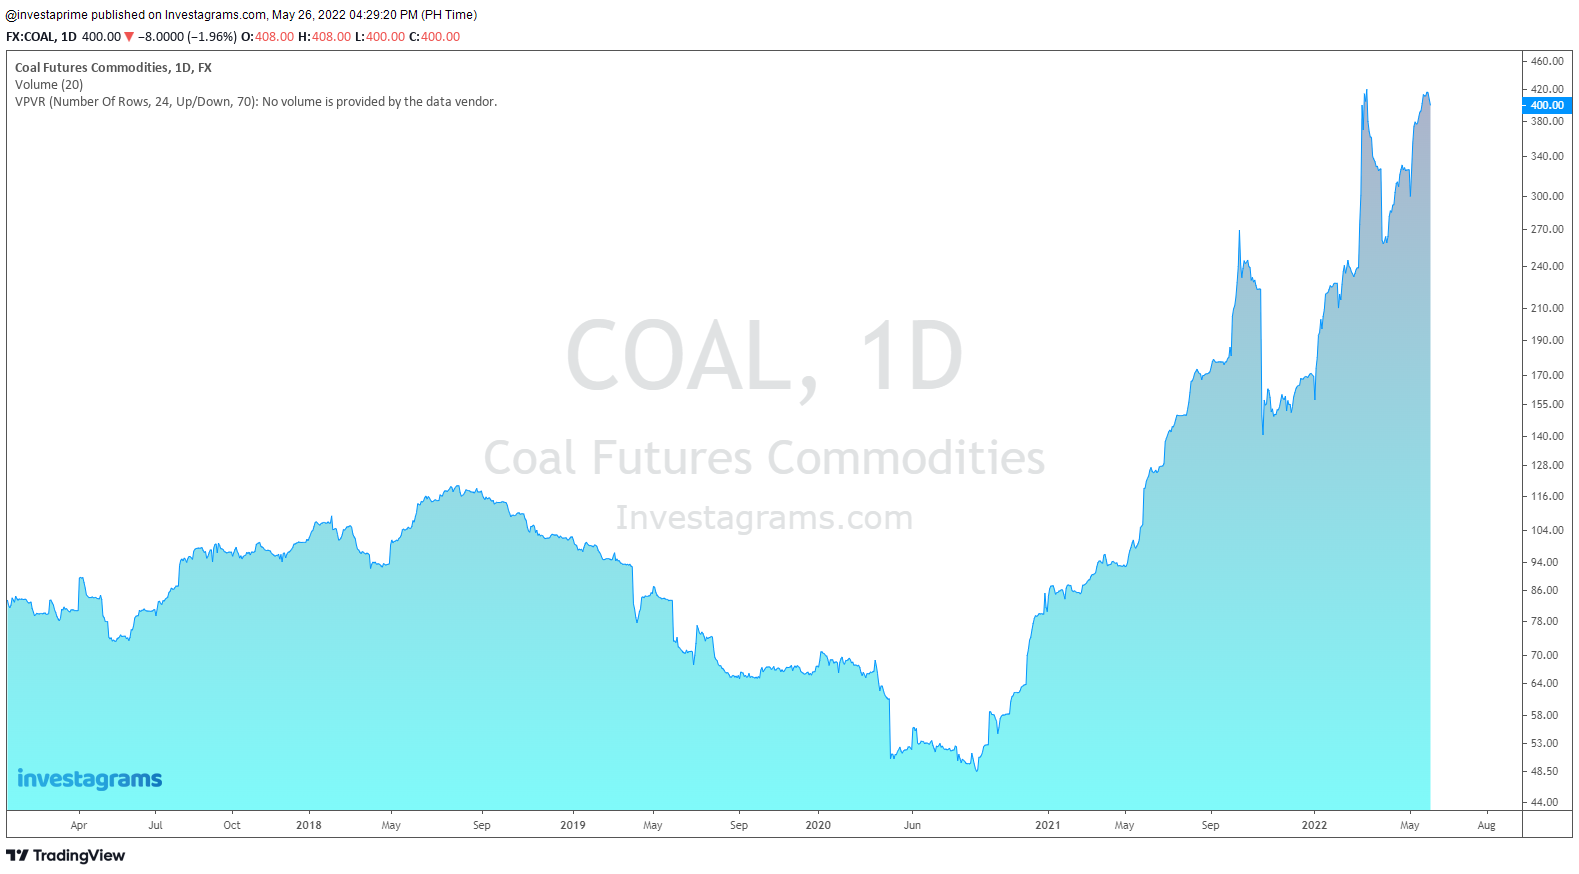
AbaCore is a holdings company that owns subsidiaries involved in Finance, Real Estate, Gold mining operations, and Coal mining operations. Despite earnings still not yet near pre-pandemic levels, investors are eager that the company is going to turn its situation around as the company itself has announced that it will be distributing dividends again, and will even add in shares from one of its subsidiaries – PRIDE. The market has taken this as a good sign, and demand has picked up for the stock pushing it to higher prices.

WHAT SHOULD BE MY NEXT MOVE?
As the move has already happened, it would be wiser to wait for what ABA might do next before buying into the stock. It is still unknown whether the stock will continue to rise to higher levels or not, so it’s best to wait for a consolidation in order to look for a better risk to reward trade. As the local equities market is still facing the same major problems, it would be advisable to trade lightly should you ever want to participate in ABA, especially if you haven’t established a base at lower levels.
Once again, KUDOS to Bibam for being this week’s Featured Trader! Enjoy your 14-day InvestaPrime Access and continue to be an inspiration to the trading community.