Physicians have x-rays and clinical tests. Sailors have their maps and compasses. Us traders have our charts. Especially for short-term traders, charts are essential as they will be present from planning to execution. As part of our mission to aid everyone in their financial journey, our InvestaCharts have always been a core part of our offerings. Our charts offer everything that a beginner, or even an expert, would need to map their way to profits. However, we don’t want to stop at just helping our users to be profitable. We want to provide users with charts that will help them become phenomenal traders. This is why we came up with a premium version of the InvestaCharts that can be used by our InvestaPrime members.
Want to take a glimpse into what new features you can use to chart out your trades? Scroll down below to see the features and examples of how they can be used
- Delay-free experience
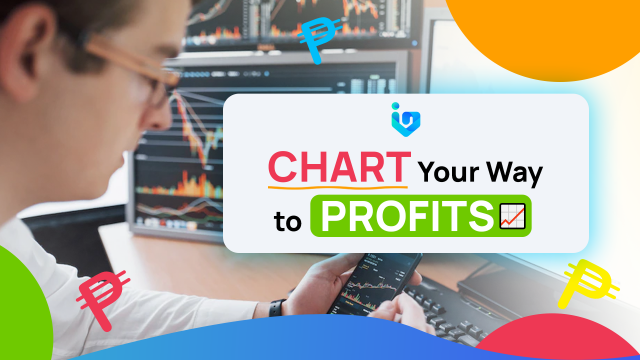
Having delayed data can be a hassle, especially for traders who need to execute quickly. Even a few seconds can become crucial when executing trades during an explosive breakout, what more 15 minutes? Unless you avail of the level 1 PSE data plan or an InvestaPrime subscription, you would be subject to delayed market data by up to 15 minutes.
For example, on the day PSE:EMP rallied, prices quickly soared within a matter of minutes. For Prime users and those who availed of a PSE data package, they wouldn’t have had a problem. However, users with a 15-minute delay, they would see a stock price of 14.04 whereas the price had already risen up to 16.50.
- Premium indicators that automate charting for you
As traders grow and gain more experience, simple charting becomes easier. However, who wouldn’t want to have someone else do repetitive tasks for them? As an InvestaPrime member, you will be able to unlock premium features on InvestaCharts that help you automate your charting process.
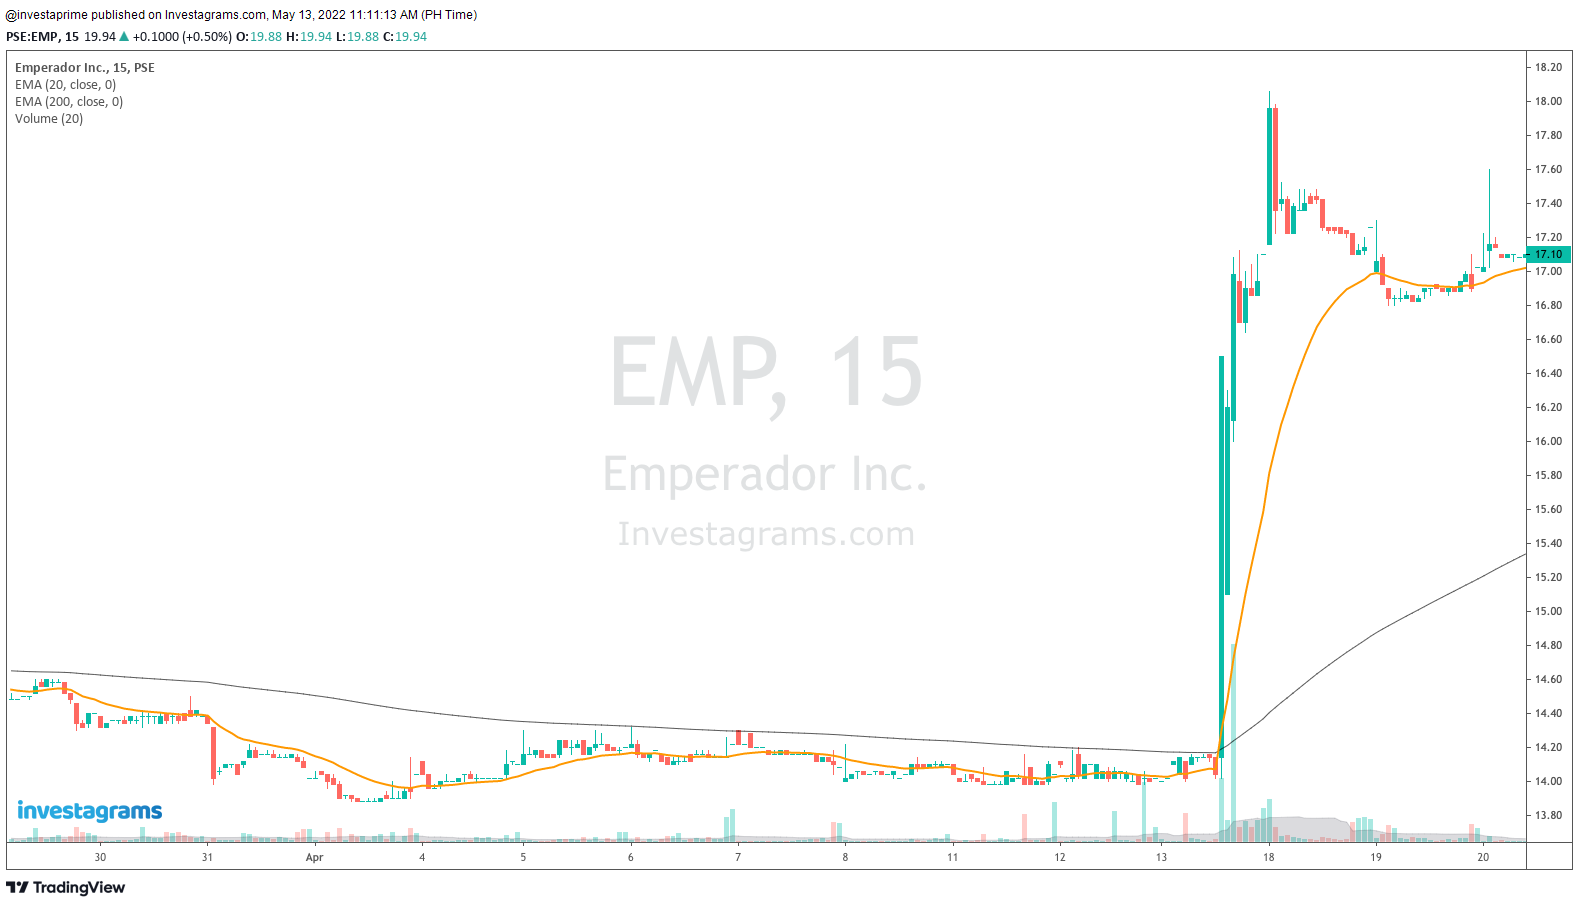
As a premium user of the InvestaCharts, you will have access to Auto 52-Week Highs and Lows as well as an Auto Support and Resistance that will help you plot important price levels faster.
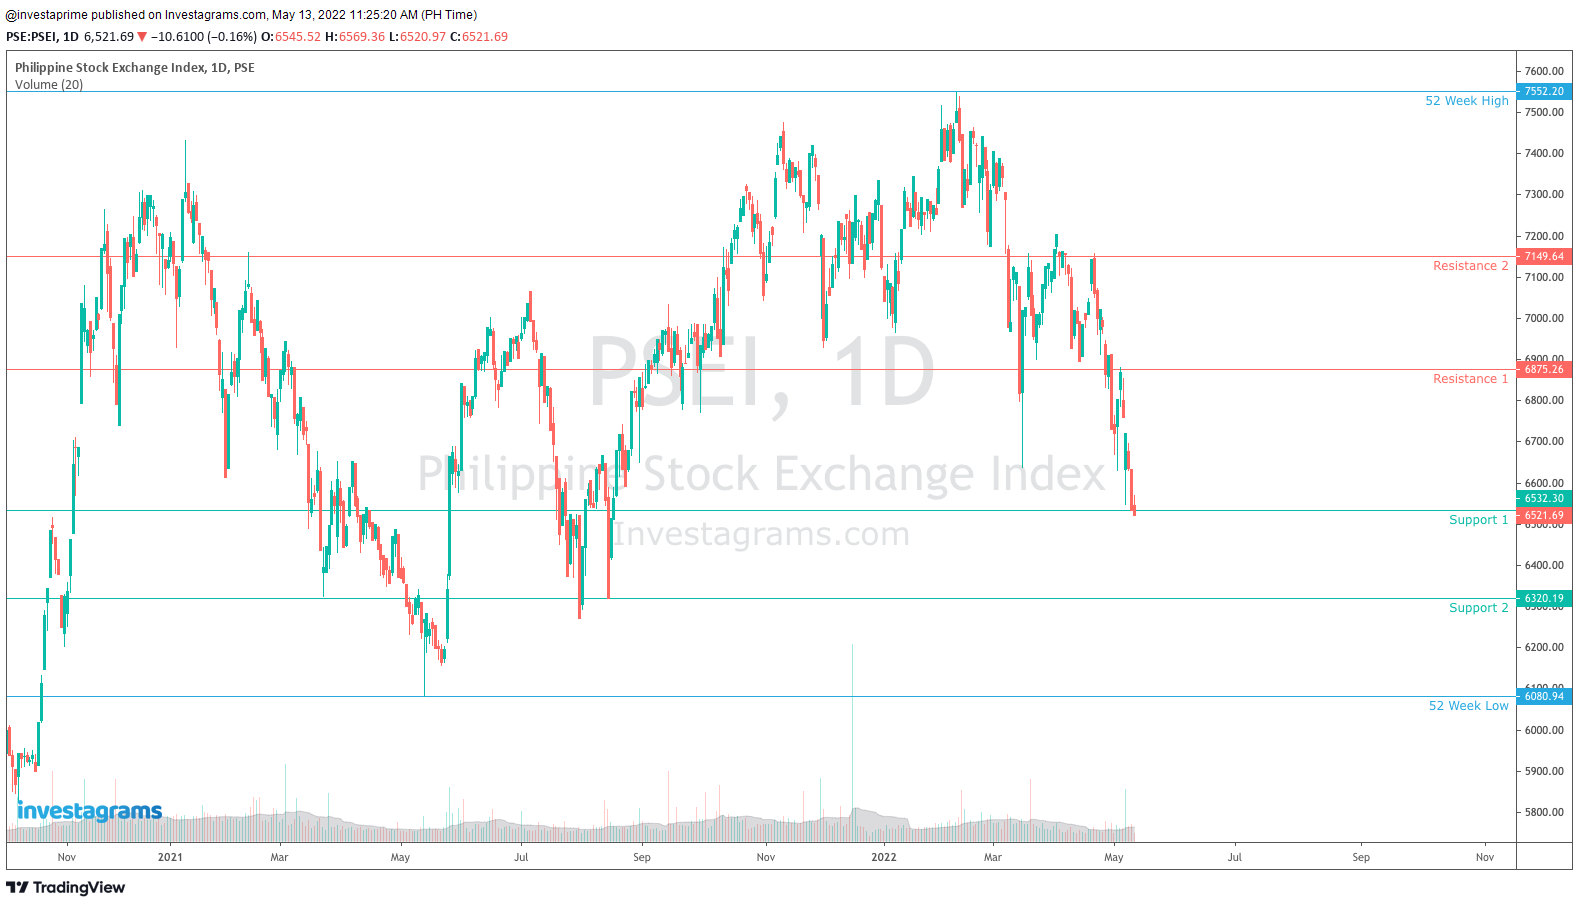
There is even an Auto Fibonacci feature that will help you save time when plotting your Fibonacci Retracement levels.
- Premium indicators that give you a strong edge
Saving the best for last, we have developed premium InvestaChart features that will greatly help your trading decisions. Support and resistances are foundational concepts for every trader. Even as we get better, determining which levels hold the most importance will always be the challenge that we will face. Let’s look at how our features can help you with that challenge.
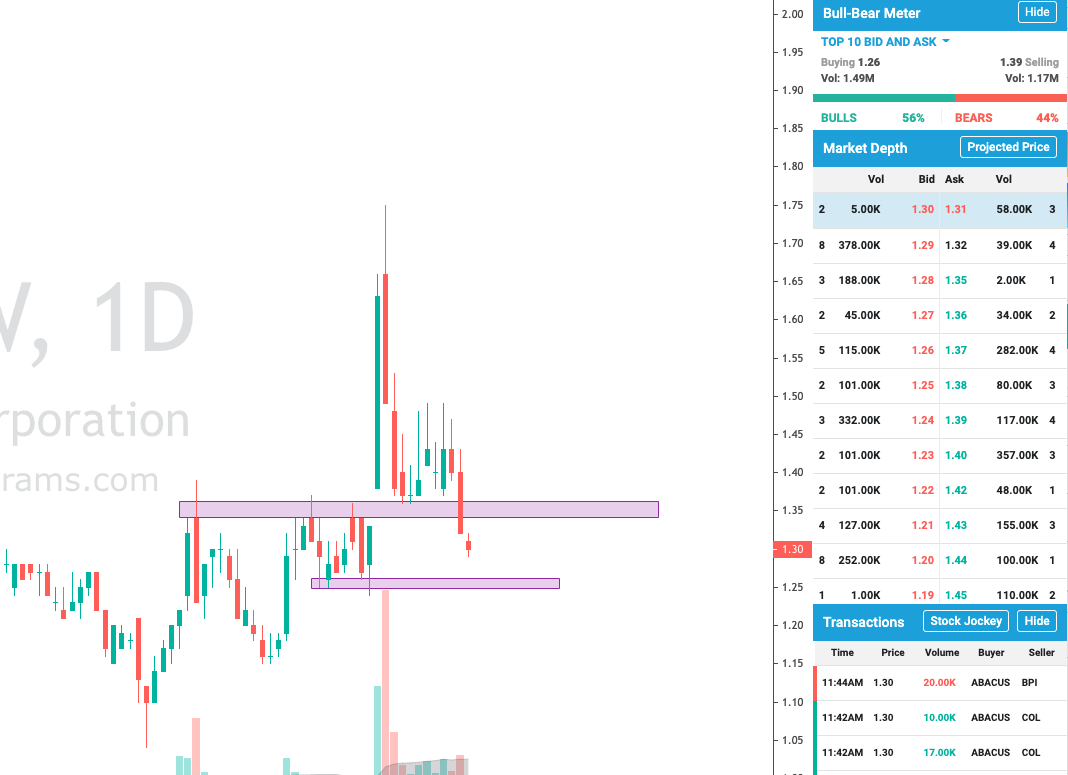
With the Bull-Bear Meter, we can help you determine if the Bid and Ask board is showing signs of demand and supply. A good example of how this can help would be for buy-on support strategies. In essence, buying on support is done because you expect that support area to be an area of demand. It would then make sense that when prices reach near that level, the bids and asks should show more eager buyers. Even if a level looks like a solid support, it wouldn’t mean anything if buyers don’t show up. With the Bull-Bear Meter, you wouldn’t need to check the board manually as the meter will weigh in all the bids and asks for you, telling you if buyers have shown up or not.
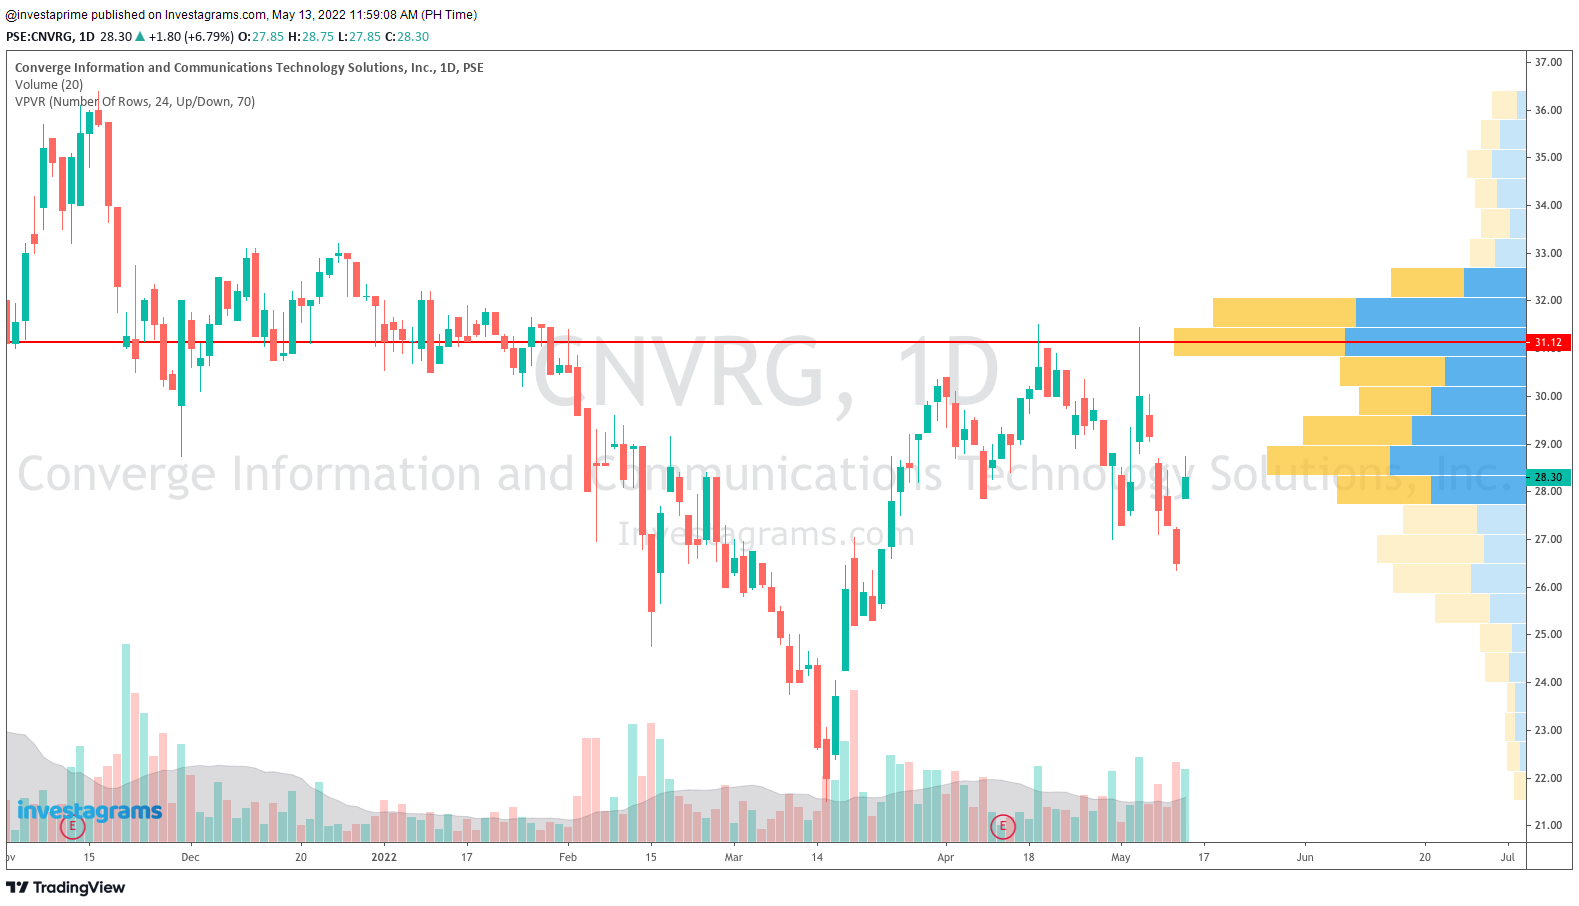
Another very useful premium tool that will help traders is the Volume Profile Visible Range. Basically, this tool plots out how much volume was traded per price point. A deeper understanding of supports and resistances would tell you that more volume on a support level signifies that the market deems that area a very cheap place to buy, whereas more volume on a resistance level would signify that there are participants there who have lost money and would most likely want to break even at the least. Thus, you can use the Volume Profile Visible Range to better understand what price levels hold the most psychological impact on the market and its participants.
They say that the only indicators needed for a trader to be great are price and volume. By being an InvestaPrime subscriber, the premium features of InvestaCharts will no doubt make it easier for you to study price action and will help you take a deeper look into the volume traded behind the prices.
Want to know more about what we offer? Head on over to the InvestaPrime landing page to look at all the features that we provide to our subscribers!