
This week’s featured trader is Jef, also known as @zat0ichi, who is highlighted for using Support and Resistance (S/R) to create a clean and well-organized setup on $MER.
As stated by Nial Fuller, “Support and Resistance are the foundation of technical analysis.”
Let’s take a look at how @zat0ichi used this indicator to his advantage!
ANALYSIS FROM @ZAT0ICHI
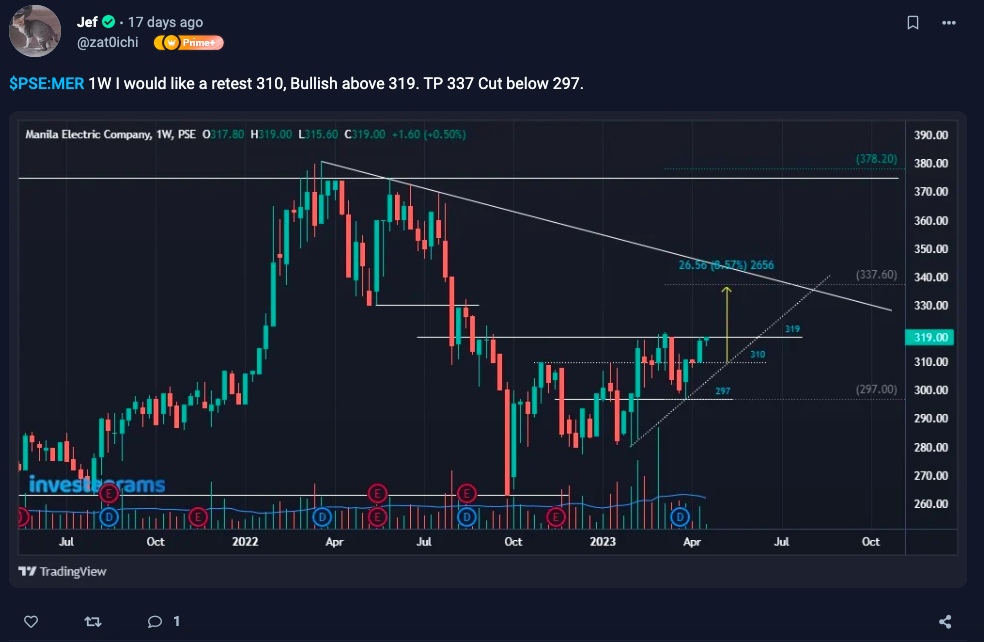
What can be seen from the chart is that $MER is currently ranging from the 297 and 319 levels. @zat0ichi utilizes $MER’s local support and resistance to establish clean entry and exit zones for his trade setup. He has a stop loss set under the 297 level, as it indicates that the price might continue going down. He also states that he is bullish at the 319 level, as a breakthrough through this resistance may connotate a surge in price. Lastly, he has a take-profit level established at the 337 level, the nearest most established resistance.
At the time of his post, $MER is at the 319 level. The stock rallied subsequent days later and hit its take profit at the 337 level 10 days later for a profit of around 5.5%. The stock also continued to rally until finally peaking at 339, which would have increased by about 6%.
However, the price is currently witnessing a pullback after its recent surge, meaning that @zat0ichi’s disciplined profit-taking at the 337 level not only secures profit but also allows him to reposition his setup after $MER’s most recent movements.
TECHNICALS OF THE TRADE
Thanks to @zat0ichi’s brilliant usage of support and resistance levels, he was able to execute a clean entry and exit on $MER.
In trading, support and resistance are price levels at which a stock or other asset will likely face buying or selling pressure.
Support is a price level at which demand for a stock is strong enough to keep it from falling lower. It is the price at which buyers are most likely to join the market and acquire the asset, causing the price to stop declining and reverse direction. Support levels are frequently determined by reviewing historical price charts and looking for price levels where the asset has previously rallied back up.
In contrast, resistance is a price level at which the supply for an item is strong enough to prevent the price from increasing. It is the price at which sellers are most likely to enter the market and sell the asset, causing the price to stall and reverse direction. Resistance levels may also be determined by looking at past price charts and searching for price levels the asset previously failed to break through.
Traders frequently use support and resistance levels to identify probable entry and exit positions for trades and construct stop-loss and profit goal orders. When the price of an asset approaches a support or resistance level, traders may look for confirmation signals, such as candlestick patterns or indicators that indicate a potential breakout or reversal, to enter or exit trades.
FUNDAMENTALS OF THE TRADE
Meralco, the Manila Electric Company, has reported a 40% increase in consolidated core net income to P9 billion in the first quarter of 2023, up from P6.4 billion in the same period last year. This growth was primarily driven by a significant increase in power generation contribution, which tripled compared to the same period last year.
Meanwhile, consolidated reported net income increased by 26% to P8.1 billion in the first quarter of 2023, up from P6.4 billion in the same quarter of 2022. Meralco President and CEO Ray C. Espinosa attributes the growth in energy sales volume to the strong performance of the commercial segment, indicating that public confidence has returned and power demand will continue to increase.
Meralco Chairman, Manuel V. Pangilinan, commented that the company’s operational and financial performance in the first quarter of 2023 indicates a good start and that they will pursue strategic energy sourcing activities for their medium- and long-term requirements to ensure sufficient and cost-competitive power for their customers.
WHAT SHOULD BE YOUR NEXT MOVE
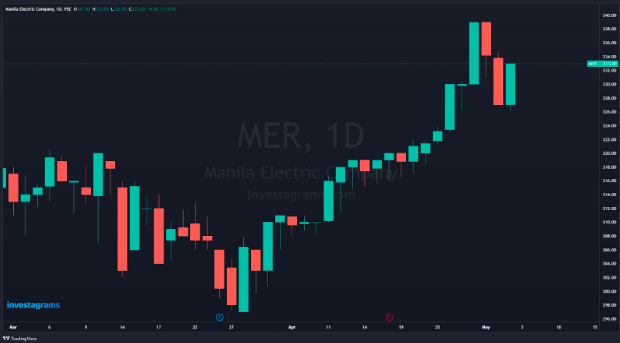
After its recent increase in price, $MER is currently witnessing a pullback. A pullback in a stock’s price could be a sign of weakness or a temporary market correction, which means that traders must be patient and wait for a confirmation signal before making a trade.
One potential strategy traders could use to wait for the stock’s price to stabilize and begin to trend upward before entering a long position. This could involve waiting for the stock’s price to bounce off a support level or for a bullish candlestick pattern to form.
It is advisable to use additional indicators to confirm the direction of the stock after a recent pullback. This enables traders to make informed decisions that are supported by multiple indicators.
Once again, KUDOS to @zat0ichi for being this week’s featured trader! Enjoy your 14-day InvestaPrime Access, and continue to be an inspiration to the trading community.
Easily track your PSE and Crypto portfolio on Investagrams for FREE!
Try it today: https://invs.st/PortfolioDaily