
With a clean setup on $APX using Fibonacci and resistances, Charm, a.k.a. @charm123, takes the spotlight for this week’s featured trader!
When used in conjunction with support and resistance, Fibonacci levels can provide traders with even more valuable insights into potential price movements in financial markets and key levels to look out for.
Let’s take a look at how @charm123 used these technical indicators to her advantage.
ANALYSIS FROM @CHARM123
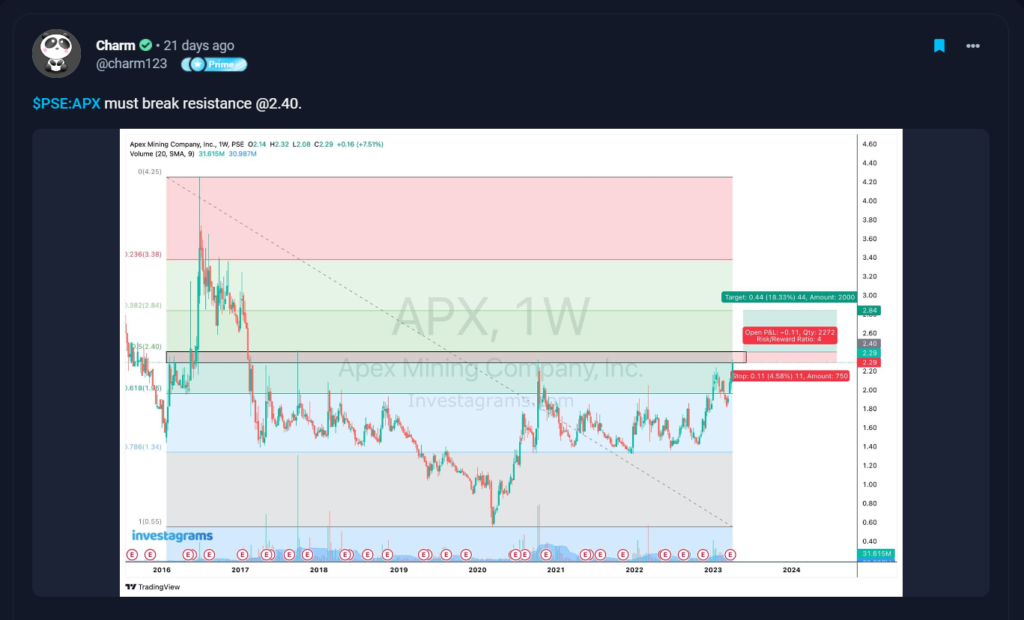
What can be seen in the chart in her post is that $APX is currently contesting a local resistance level at the 2.29 level. Her caption shows how breaking the resistance at the 2.40 level is important to see significant movement for $APX. It is also the level where she plans to enter her trade. Her take profit is at the 2.84 level, concerning the 0.382 level in the Fibonacci. Additionally, @charm123 has her stop loss set around the local level of 2.29 in case the stock fails to break through the 2.40 significantly.
Six days later, $APX successfully broke through the 2.40 level and hit her take profit 16 days after for an increase of 18.25%.
TECHNICALS OF THE TRADE
The Fibonacci and Resistance levels were the indicators @charm123 used to execute her clean trade setup.
Fibonacci levels refer to the specific price points or levels on a chart derived from the Fibonacci sequence. These levels are based on the sequence’s key ratios: 0%, 23.6%, 38.2%, 50%, 61.8%, 76.4%, and 100%.
In technical analysis, traders use Fibonacci levels to identify potential areas of support or resistance in financial markets, including stocks, currencies, and commodities. These levels are often used with other technical indicators to make more informed trading decisions.
In @charm123’s trading setup, she used the 0.382 or 38.2% level. This level may provide a selling opportunity as traders expect the stock to face resistance at this level and reverse its downward trend. In line with this, she used the 38.2% level as her take profit as she expects the price to slow down in this area.
Resistance levels are key levels on a chart where the price of an asset has historically struggled to rise above. When used in conjunction with Fibonacci levels, resistance levels can help traders identify potential areas of interest where a stock’s price may face difficulty breaking through. Traders often look for confluence between Fibonacci levels and resistance levels to increase the likelihood of a successful trading opportunity.
FUNDAMENTALS OF THE TRADE
Apex Mining Co., Inc. has announced a remarkable 408 percent increase in its consolidated net income to an unprecedented P3.34 billion in the year 2022 from the P657.25 million earned in the previous year. The company’s consolidated revenues also surged by 39 percent to a record P10.31 billion in 2022 from the P7.41 billion reported in 2021. Gold contributed P9.85 billion to the total revenue, while silver contributed P0.46 billion. The total volume of gold sold by Apex Mining rose by 28 percent to 101,096 ounces, while silver sales went up by 6 percent to 382,345 ounces. The realized prices were $1,797 per ounce (up 1 percent) for gold and $21.78 per ounce (down 11 percent) for silver.
Apex Mining attributed its success to its expansion plans, which generated the desired efficiencies in 2022. The two operating mines, Maco and Sangilo, increased their milling capacity by 11 percent or 250 tons per day and by 100 percent or 200 tpd, respectively. The Maco mine, which averaged 2,330 tpd, achieved a total tonnage milled of 815,910 tons (higher by 15 percent year-on-year). Coupled with higher feed grades of gold (3.96 grams per ton) by 6 percent, the resulting gold production of 91,072 ounces and silver production of 377,729 ounces was up 23 percent and 5 percent, respectively. ISRI milled a total of 131,481 tons in 2022 and produced 9,270 ounces of gold and 629 ounces of silver.
However, the consolidated cost of production increased by 28 percent to P5.43 billion. Although mill production went up by 15 percent, the cost of materials and supplies accounted for only 12 percent of the increase. Other factors that contributed to the uptick include depreciation and depletion costs (6 percent), personnel costs (3 percent), and repairs and maintenance (2 percent).
WHAT SHOULD BE YOUR NEXT MOVE
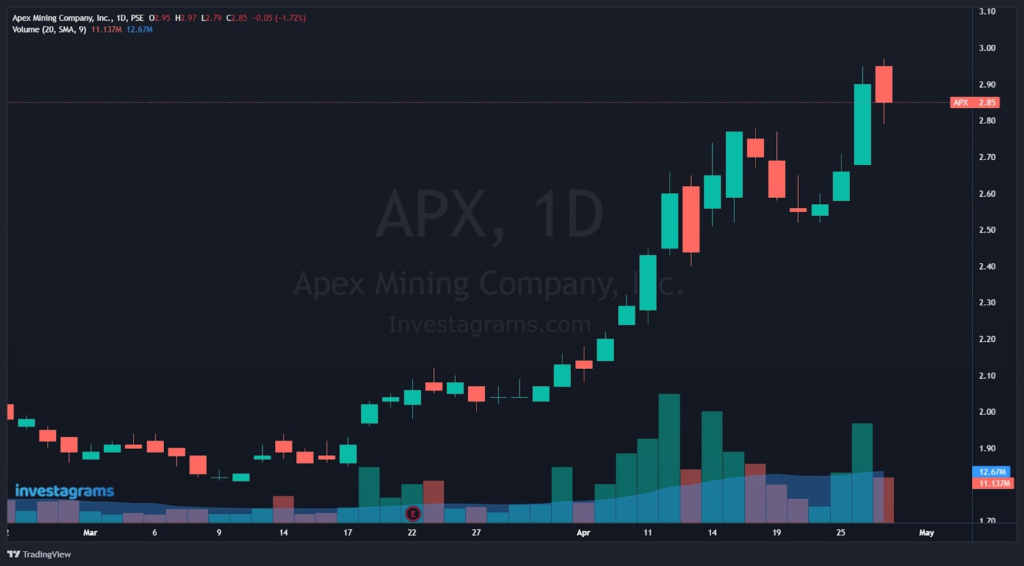
$APX is currently forming new resistance near the 2.80 level. When a stock forms new resistances, the price moves toward a level where it has previously encountered selling pressure. This could indicate that investors are becoming more cautious and are willing to sell their shares at a higher price. Not all resistance levels are created equal; some may be stronger than others, and stock may need to test a resistance level multiple times before breaking through it.
Investors must possess the critical skill of waiting patiently while a stock forms new resistance. This can be achieved by gathering relevant information, avoiding impulsive decisions, and adopting a clear investment strategy, all of which can lead to better investment decisions and a higher probability of success.
Once again, KUDOS to @charm123 for being this week’s featured trader! Enjoy your 14-day InvestaPrime Access and continue to be an inspiration to the trading community.
Easily track your PSE and Crypto portfolio on Investagrams for FREE!
Try it today: https://invs.st/PortfolioDaily