
buMalo a.k.a. @manolocgarcia, takes the spotlight for this week’s featured trader as he executes a clean trade on $FCG while utilizing multiple indicators to support his set-up!
The trade explanation from @manologarcia was specific and substantial as he shares his value at risk (VAR), entry price, cut loss price, take profit price, and the number of shares.
Traders who establish a straightforward trading setup can benefit from increased consistency in their trading approach, more effective risk management, enhanced discipline, and greater trading efficiency. Additionally, a well-defined setup can promote a better understanding of the market and the possible trading opportunities.
Let’s take a look at how @manolocgarcia used his indicators to come up with a well-defined set-up
Analysis from @manologarcia
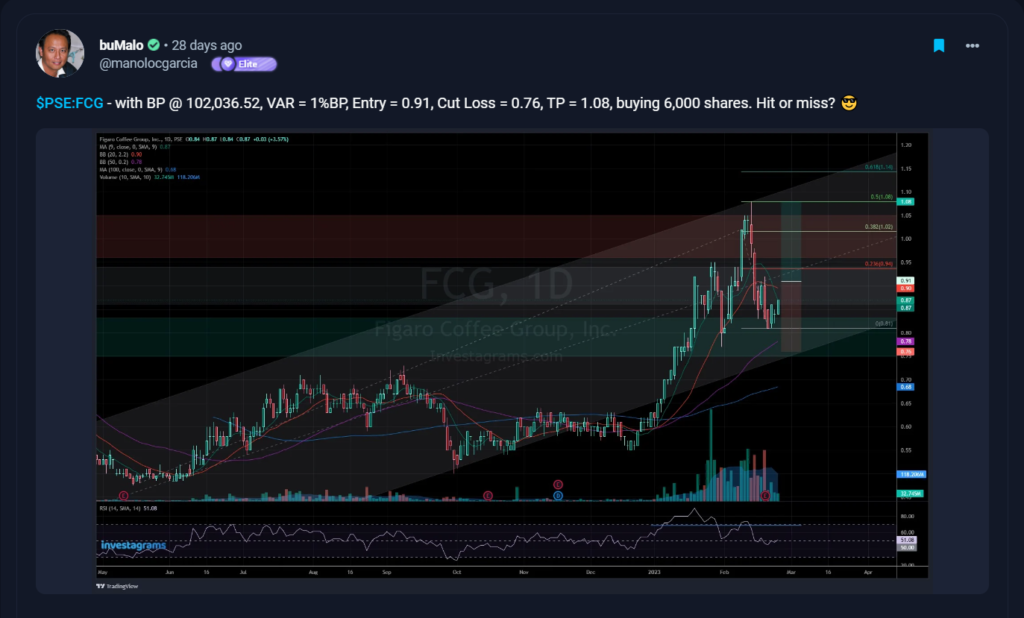
What can be seen in this chart is how $FCG is forming a higher low after a significant pullback. It generally indicates that there is still buying interest in the market and that the overall trend is still bullish. This is further supported by the movement of Moving averages 9 and 100 (or MA9 and MA100, respectively). MA 9 (as indicated by the green line) can be seen previously crossing above the MA100 (as indicated by the blue line). This signal is known as a “golden cross” and is considered a bullish signal for the market or asset being analyzed. As the relative strength index (or RSI) is also not on the overbought levels, this opens the potential for the stock to continue rising if supported by the market’s sentiment.
At the time of his post, $FCG was trading around the 0.87 level. The stock surged in price a few days later and hit the target profit level set by @manolocgarcia of 1.08 for a total increase of 18.69%. The stock then slowed down at the 1.10 level before pulling back and making a new higher low. Indeed, the profitable trade of @manolocgarcia was a result of his insightful decision to adhere to his strategy with precision and discipline.
TECHNICALS OF THE TRADE
What can be observed in from the chart of @manolocgarcia is his use of moving averages. A moving average is a commonly used indicator in technical analysis that smooths out price data over a specified period of time. The MA 9 is a short-term moving average that is often used to identify short-term trends and momentum in the price of an asset; on the other hand, the MA 100 is a long-term moving average that provides traders and investors with a view of the asset’s price trend over the past 100 periods or timeframes.
Using MA9 in confluence with MA100 is a simple and popular trading strategy among technical analysts. The MA 9 represents the short-term trend, while the MA 100 represents the long-term trend. When the MA 9 crosses above the MA 100, it is called a “golden cross,” which is a bullish signal for the market or asset being analyzed. Conversely, when the MA 9 crosses below the MA 100, it is called a “death cross,” which is a bearish signal.
@manolocgarcia also created a channel range to showcase where the stock has been generally trading in. These are created by connecting the stock’s price highs and lows over a period of time. The upper line connects the price highs, while the lower line connects the price lows. The parallel channel pattern is considered to be a continuation pattern, which means that the stock’s price is likely to continue moving in the same direction after the pattern is formed.
FUNDAMENTALS OF THE TRADE
Figaro Coffee Group Inc. reported an increase in income for the second half of 2022. The company, which operates cafes and several restaurants, saw a 47% rise in income from P179.62 million in the previous year to P265.11 million.
During the period of July to December, systemwide sales also showed significant growth, increasing by 79% to P2.05 billion from P1.14 billion in the corresponding period in 2021.
The company stated, “This was brought about by the opening of stores which brought the total number of stores to 150 by the end of December 2022. This resulted to an 88-percent increase in revenues versus same period last year”
The company fully liquidated all its interest-bearing bank loans in September. It also has new availments of P30 million from UnionBank as of end-2022.
WHAT SHOULD BE YOUR NEXT MOVE
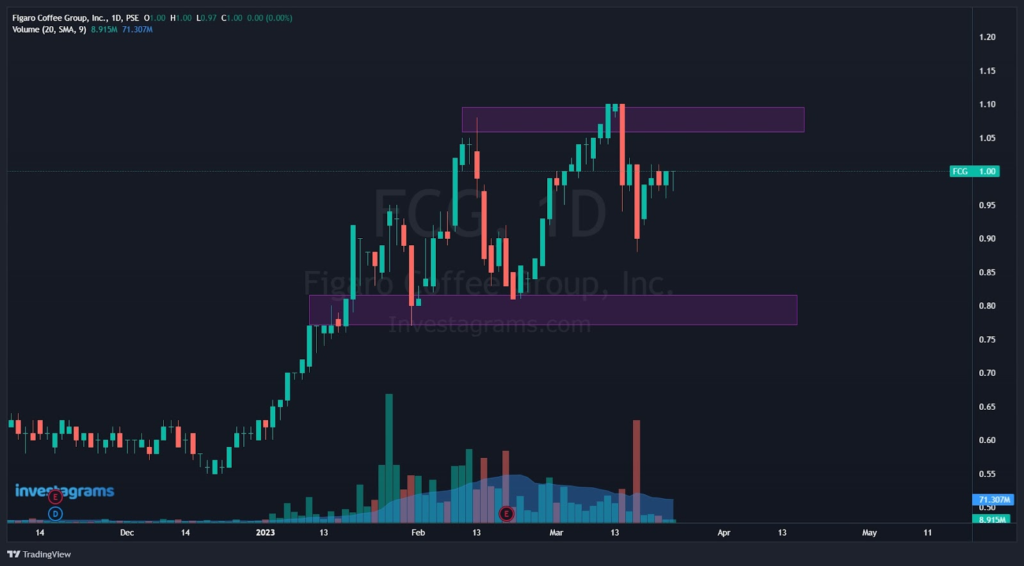
After forming its most recent higher low, $FCG can be seen ranging and consolidating between the resistance level of around 1.01 and the support level of around 0.96. This price action may suggest that the market is still deciding about the stock’s future direction. Traders may be waiting for a breakout above the resistance level or a breakdown below the support level before taking any significant positions.
During a range-bound market, it is advisable to use technical indicators and chart patterns to identify potential trading opportunities, such as buying at the support level and selling at the resistance level. They may also use stop-loss orders to limit potential losses if the stock price breaks below the support level or fails to break above the resistance level.
Once again, KUDOS to @manolocgarcia for being this week’s featured trader! Enjoy your 14-day InvestaPrime Access and continue to be an inspiration to the trading community.