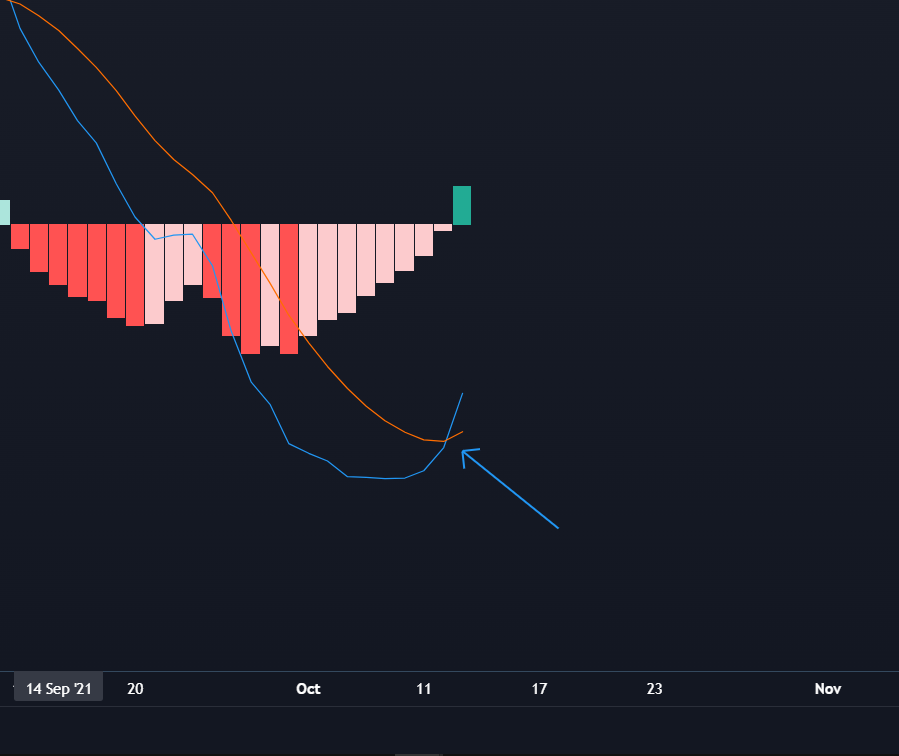
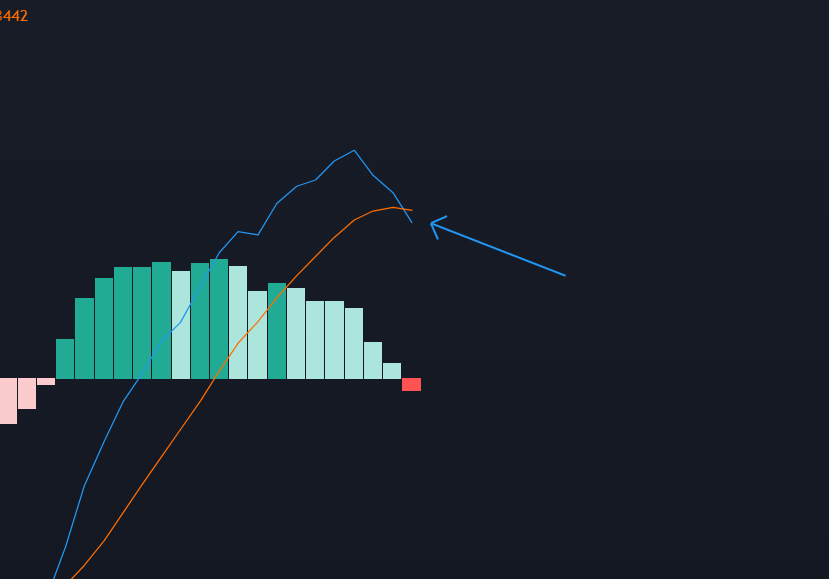
MACD can help gauge whether a stock is overbought or oversold. Traders are alerted to the directional move’s strength and warning of a potential price reversal.
But what is a MACD? How should it be used? When is it best utilized? Let’s find out!
WHAT IS THE MACD
The moving average convergence divergence (also known as the MACD) is one of traders’ most often used indicators. It is simply a trend-following indicator that displays the connection between two moving averages.
Traders use MACD to detect changes in the direction or strength of a stock’s price trend. At first look, MACD may appear sophisticated since it is based on supplementary statistical ideas such as the exponential moving average (EMA). But fundamentally, MACD helps traders detect when the recent momentum in a stock’s price may signal a change in its underlying trend.
This can help traders decide when to enter, add to, or exit a position.
COMPONENTS OF MACD

A MACD chart is made up of three components: the MACD line, a signal line, and a histogram, all of which are shown on a horizontal axis known as the baseline. The indicator is typically shown right below the price chart of the stocks. This allows price movements to be compared to changes in the MACD chart.
MACD BACKTEST APPROACH
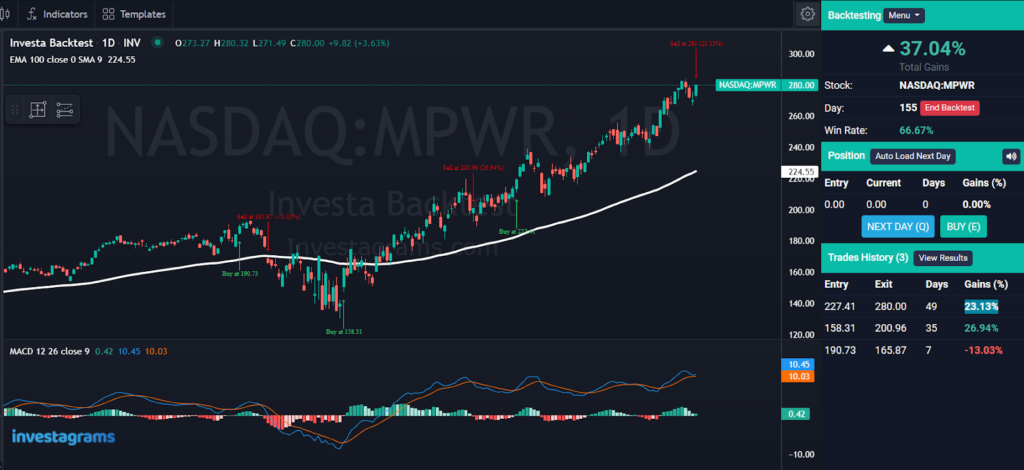
For this backtest, the indicators we used are the EMA 100 and the default MACD. The EMA 100 is used in order to assess the trend of the market. The stocks covered were U.S. and PH stocks. Random liquid stocks were chosen, with historical data starting from January 1, 2020.
The trades’ framework will be as follows:

- Long positions are entered once the MACD line crosses over the Signal line.

- Positions are then sold once a decrease in momentum is signaled by the MACD line crossing under the Signal line. Positions are also sold if there is a big change in market sentiment; hence, we must cut losses to prevent further deficits.
RESULTS USING THE MACD STRATEGY

The strategy had a hit rate of 54% and an edge ratio of 1.80 over about 100 trades. It is important to take into account that trends play a substantial role in determining the success of each trade. That is why we also took into account if prices were above the EMA 100, which serves as an additional indicator to determine if the MACD signals were only portraying false positives. The majority of the significant gains were positions executed in above the EMA 100.
INSIGHTS
Here are some key insights that can be taken from the test done:
- The trend is your best friend.
False positive divergences frequently occur when an asset’s price goes sideways in a consolidation. Being able to determine where the stock’s trend is going would be essential in verifying the signals given by the MACD. Buy signals that are against the trend are most often retracements which leads to the risk of buying even if there is a chance that the price would continue to go lower.
- False moves are common, so it is better to confirm first
It is advisable to wait three or four days after a signal line crossing to ensure that it is not a fake move.
- Be sensitive to the momentum
Even in the absence of a clear reversal, a slowing in price momentum (sideways movement or stagnant trending movement) will lead MACD to pull away from its prior extremes and gravitate toward the zero lines. This could be used to warn traders of the shift in momentum and allows traders to reassess their positions according to their risk levels.
LAST THOUGHTS
The MACD technical indicator is best used to identify changes in momentum and trend direction. This means that it is most efficient in spotting trend strength, assessing its momentum, and identifying changes in its trend.
This indicator should not be utilized in isolation but rather in combination with other technical and fundamental analysis techniques. Trading against the trend would give a lot of false signals, this is why excellent risk management must be observed when doing so.
Got no time analyzing hundreds of stocks or cryptocurrencies in chart one at a time? We’ll make it easier for you with ProScreener!
Access your FREE 14-Day Free Trial today.

