
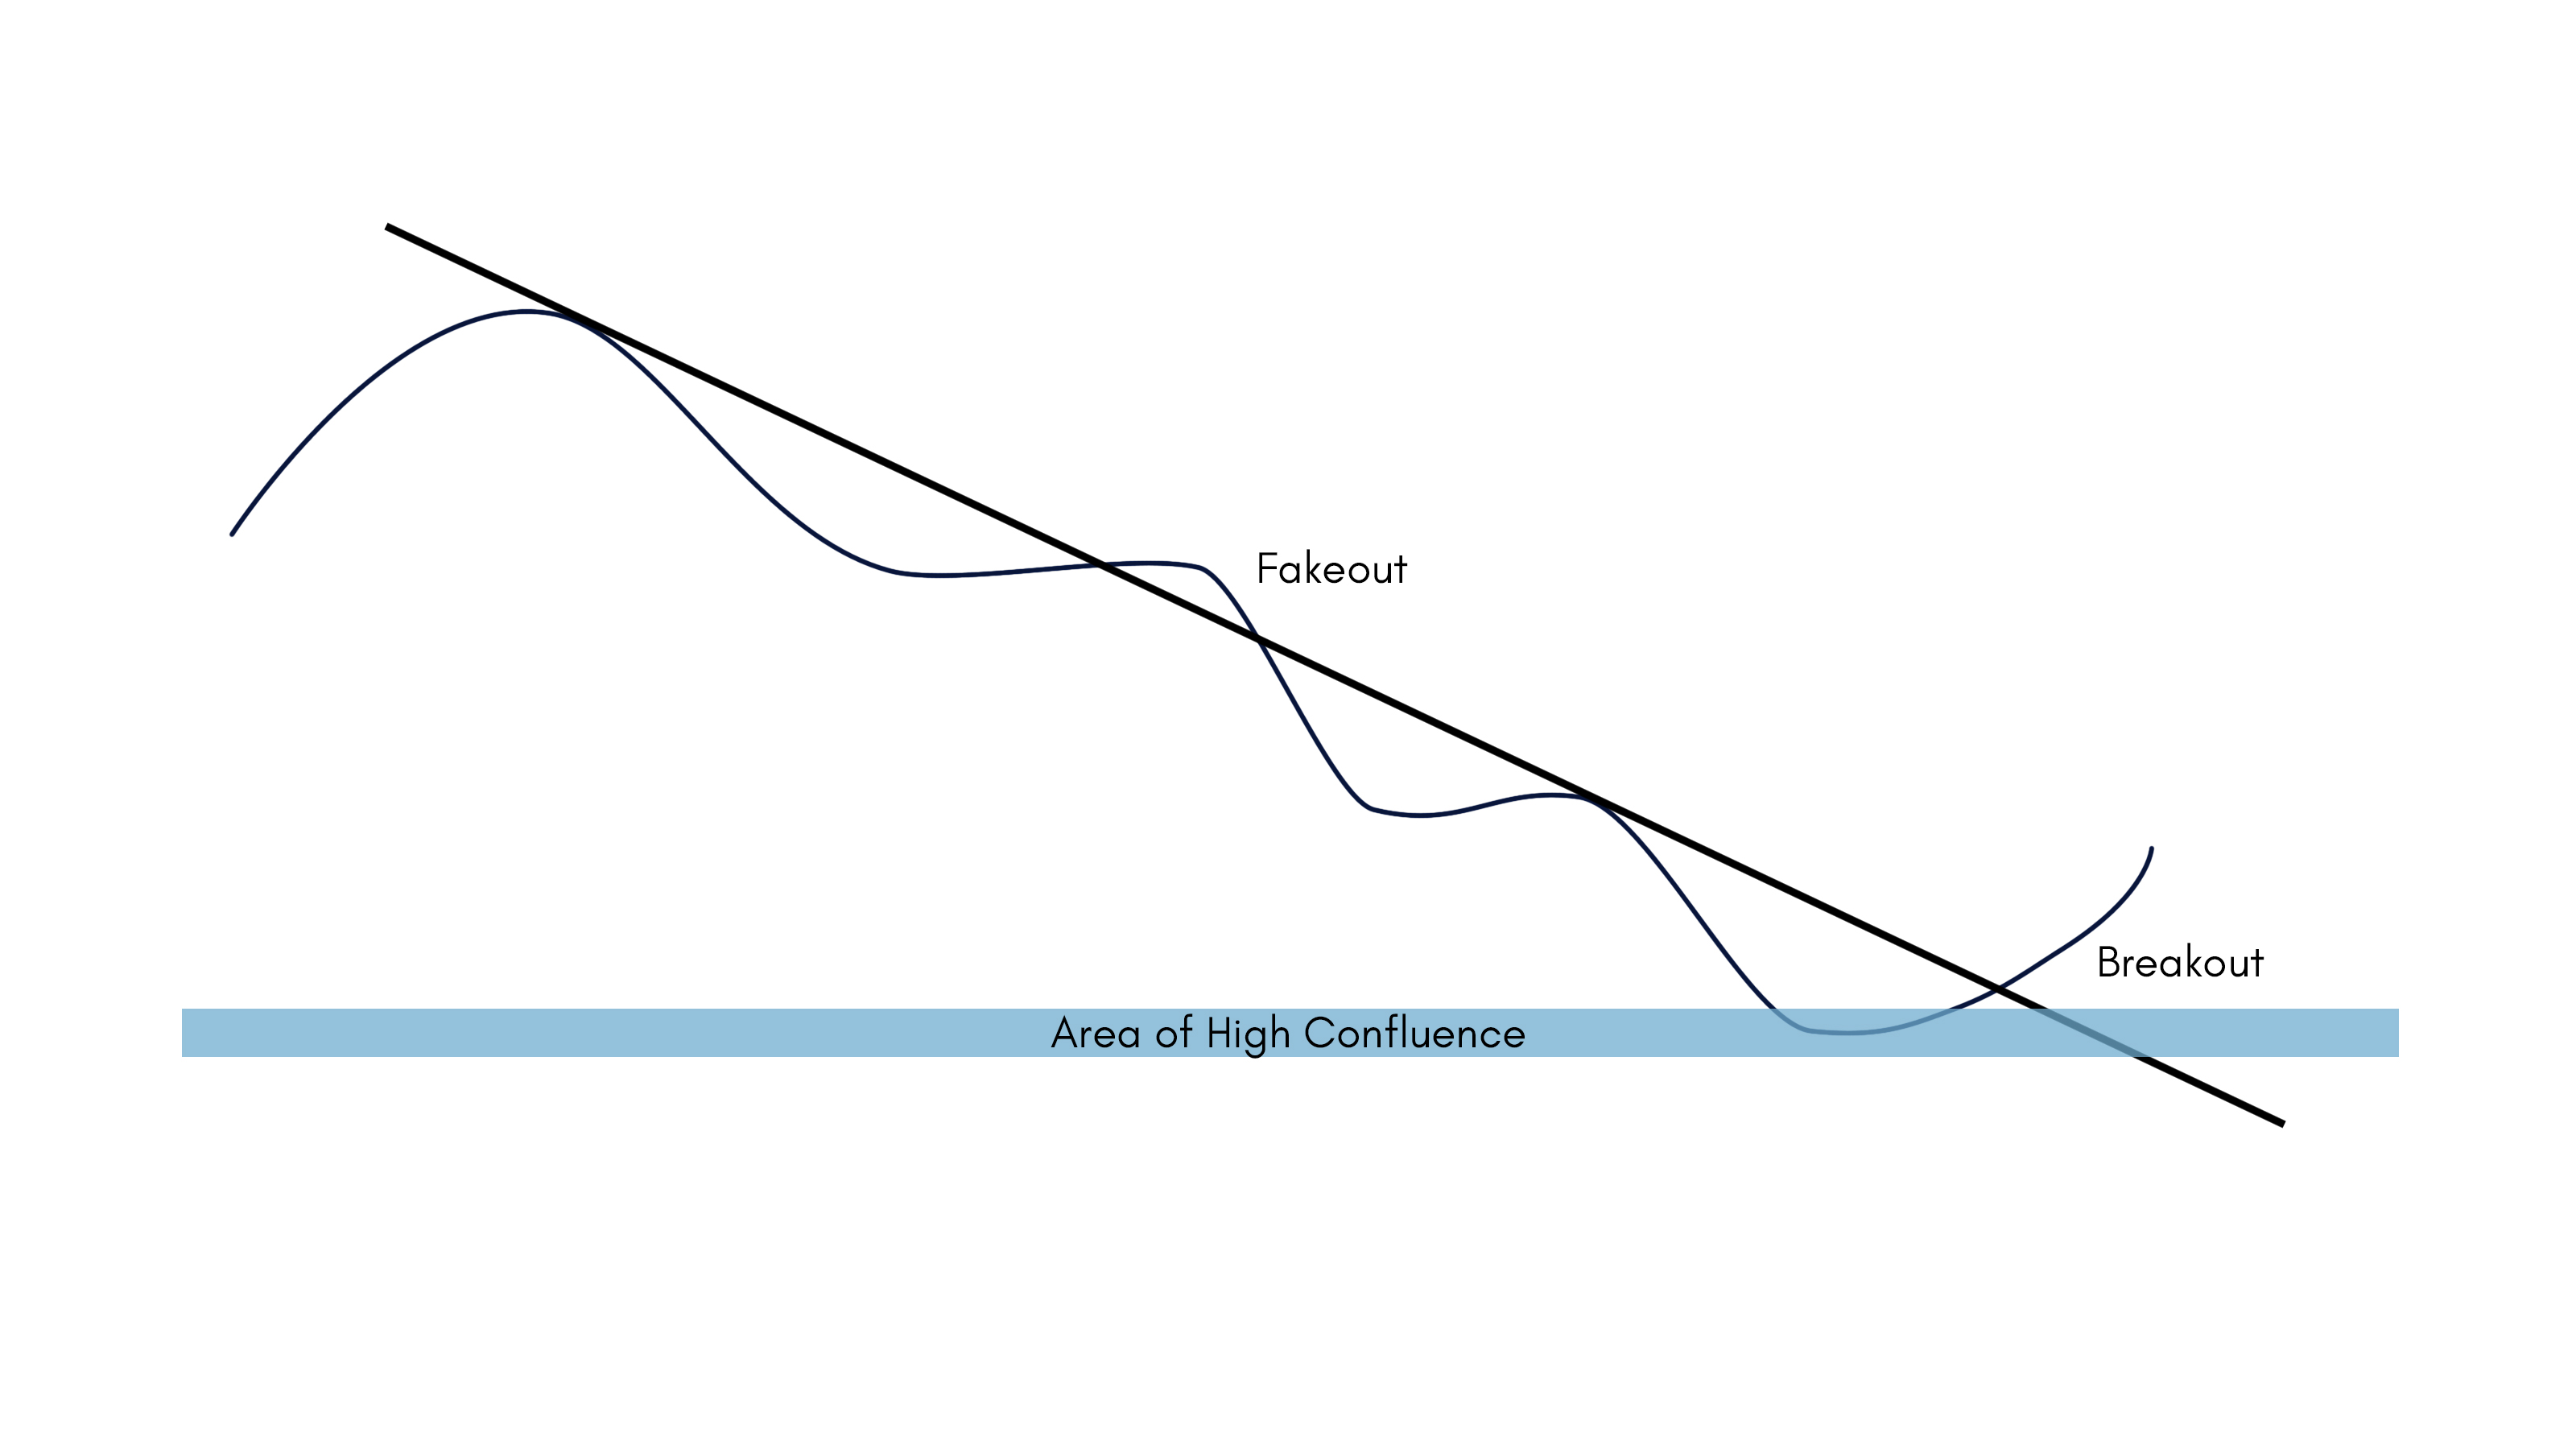
If you are a technical trader, chances are, the trendline is one of the first charting tools that you have learned to use. Its elegance comes from its simplicity: just trace the line and either follow the trend or wait for a breakout. However, like supports and resistances, trendlines are prone to both fakeouts and shakeouts. If you find yourself a constant victim to these fakeouts and shakeouts, then maybe your trendline strategy is missing the most important component: confluence.
In the world of trading, confluence refers to the convergence of different trading strategies. An example would be a set of moving averages, structural supports, and fibonacci retracements all indicating the same critical level for a certain stock. This critical level is often referred to as an area of high confluence. The idea behind the importance of an area of high confluence banks on the fact that different traders use different trading strategies.
From time to time, a high number of traders will consider a price level critical in accordance with their strategy. Once the price reaches this level, there will be a surge in the number of buyers/sellers since a lot of traders consider the price as a critical level. In a nutshell, areas of high confluences often equate to higher probabilities.
Incorporating areas of high confluences with your trendline strategy is as easy as making sure that the price touched an area of high confluence before approaching a trendline. This removes the small errors from mistakes in drawing your trendline as well as irregular market behavior.
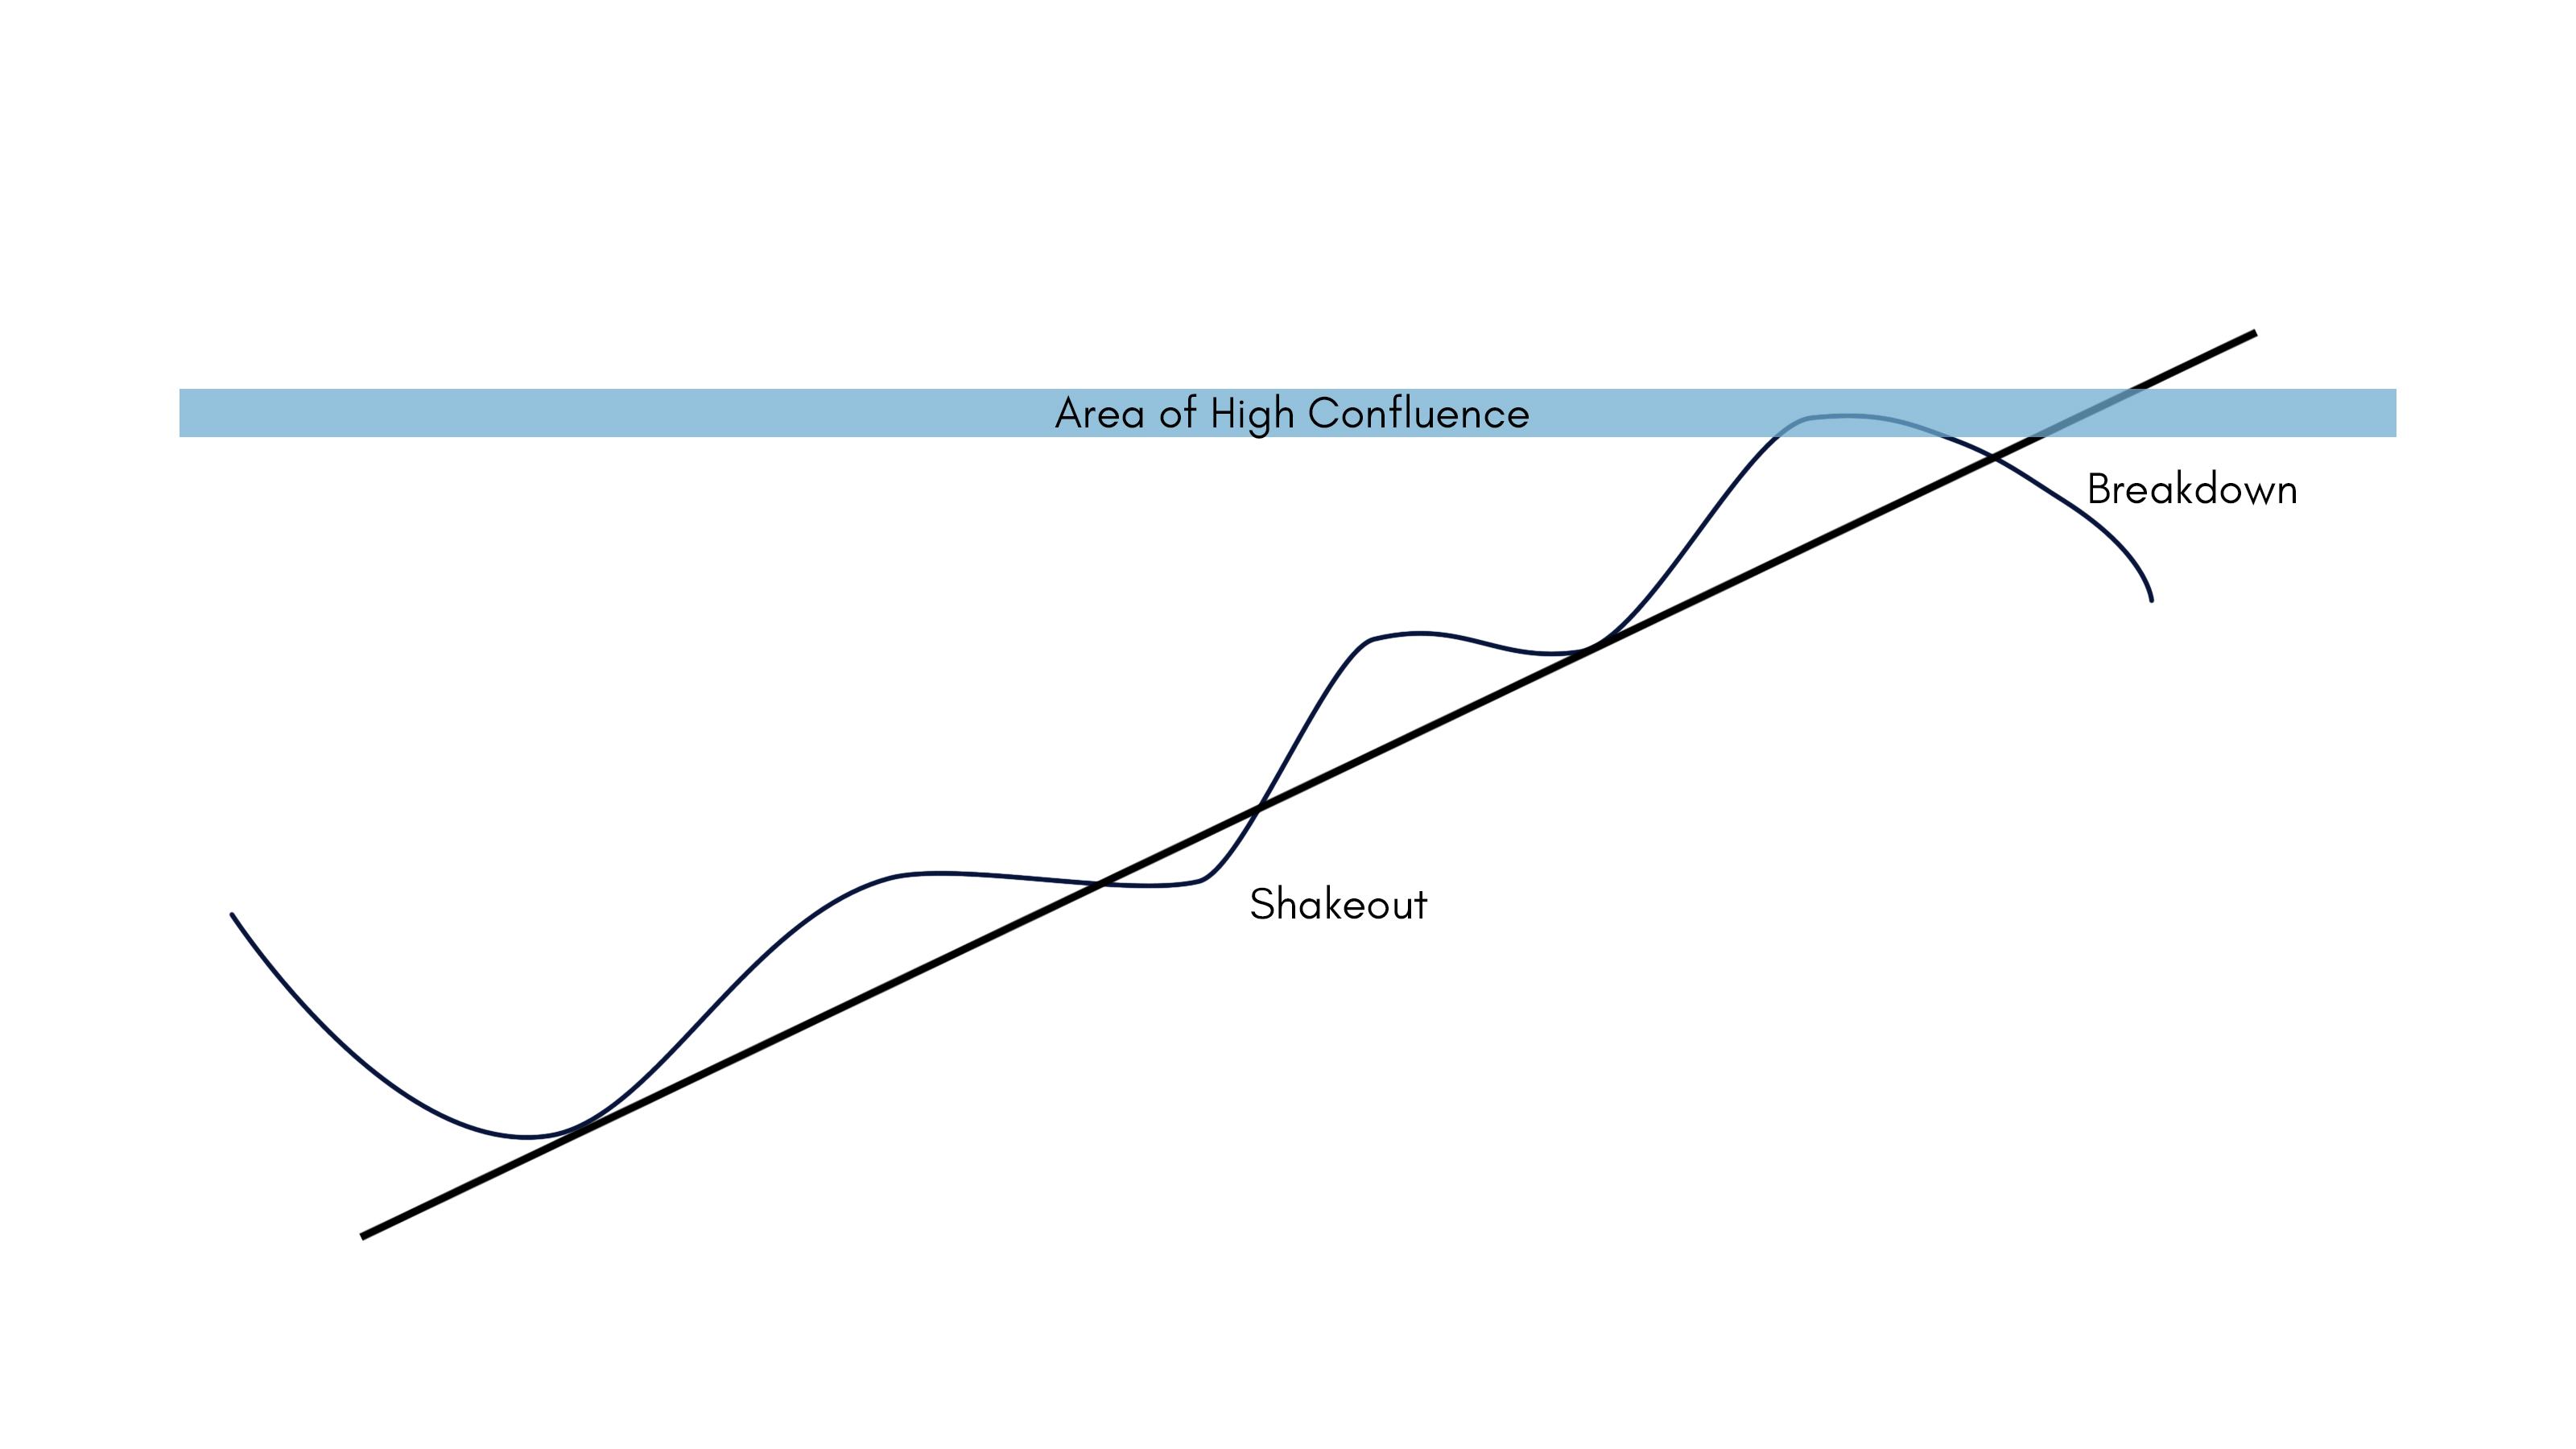
Essentially, the key takeaway is that trendline breakouts and breakdowns are invalid if the price did not come from an area of high confluence prior to the breakout/breakdown. This strategy goes well with both breakout trading and trend following since a breakdown from the trendline without a bounce from an area of high confluence is probably a shakeout and not a trend reversal.
Areas of High Confluence can be composed of (but not limited to) any of the following:
- Chart patterns
- Range support and resistance levels
- Moving Averages
- Bollinger Bands
- Ichimoku Clouds
- Fibonacci Retracement Levels
It is important to note that for your trendline strategy to be effective, you should not only consider areas of high confluences but also the plotting of the trendline itself. The price should touch the trendline at least two times, the more touches, the better. Including the wicks depends entirely on your judgement as a trader as well as the “DNA” of the historical behaviour of the stock. With all this said, let’s head on to some examples.
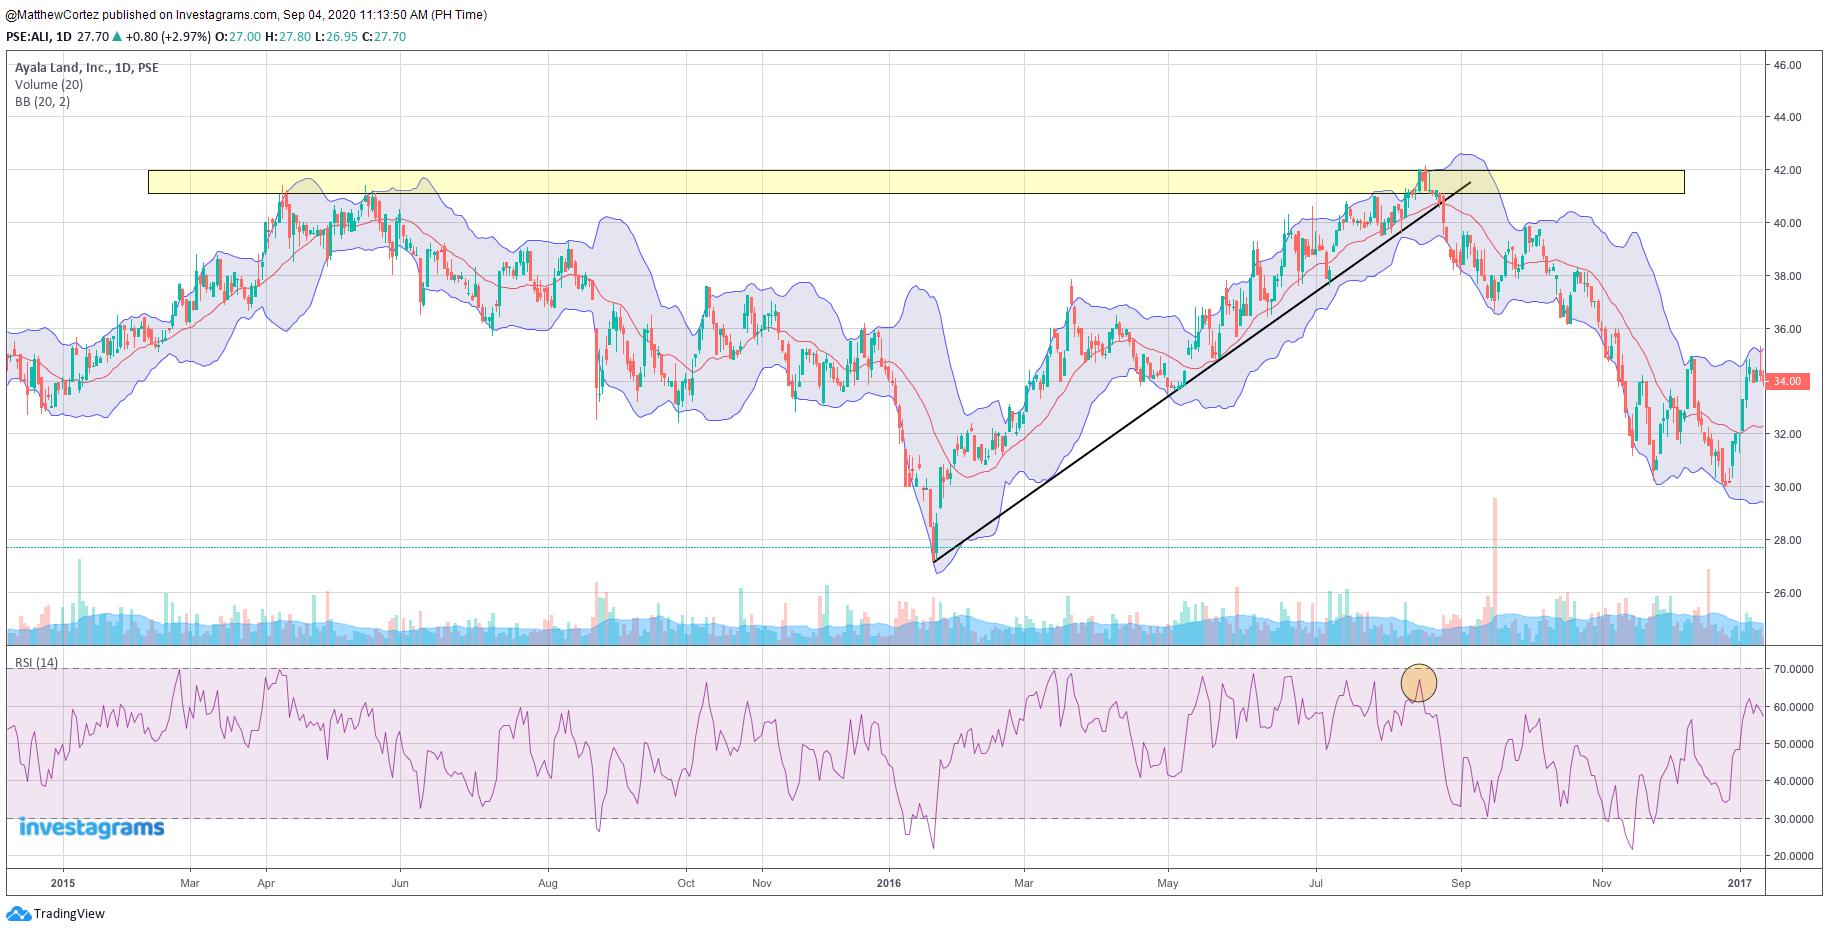
In the photo above, there is a defined trendline on the daily chart of $ALI. We can see that the 40 price level is an area of high confluence because of the following factors: (1) it is a psychological resistance, (2) it is the high of the previous uptrend, (3) the price is already at the top of the Bollinger bands, (4) the RSI is near overbought levels.
Because the price bounced from an area of high confluence before breaking the trendline, there is a high probability that the price action is a breakdown and not just a shakeout. As we can see through what happens next, the move is in fact a breakdown of the trendline.
This trendline strategy shows us that although we should develop a trading system that is tailored to our specific needs, we should also be familiar with tools and indicators outside of our system. This helps us widen our understanding of where the market might be headed since we are not only tapping into one strategy, but to multiple ones at the same time.
The stock market is basically a psychological battle between traders of different niches after all. Normal trading rules (take profit, position sizing, and stop loss) still apply. All of these strategies will help you trade the confluence and hopefully take you one step closer to financial freedom.
Take your trading to the next level.
Join the INVESTACUP 2020 and get a chance to WIN OVER HALF A MILLION WORTH OF CASH PRIZES!