Investagrams FEATURED TRADER is BACK!
One of the most rewarding part of our trading journey is not only teaching others on stock trading or sharing what we know but also hearing about the success of our fellow traders — thus, we would like to get you all back on the game and keep the ball rolling as we feature our TRADER OF THE WEEK here in InvestaDaily.
We choose among your posted charts from the prior week based on the relevance of stock pick such as popularity, activeness of the stock, accuracy, and profitability of the analysis. We want to give recognition to those who continuously give their insights not just about investments in stocks but also in life.
Our chosen winner for each week will win one-month ACCESS to our PREMIUM feature – InvestaJournal. This journal will organize your everyday transactions with ease, speed up your learning curve, and improve your trading strategies.
Learn more: https://www.investagrams.com/InvestaJournal/
Here we go!
Congratulations to our featured trader of the week @jessietiu (A Force)
He rocked his analysis for $CHP (Cemex Holdings Philippines, Inc.) six days ago when he provided an in-depth potential bounce setup. (Visit https://www.investagrams.com/Post/jessietiu/671322)
See his chart below:
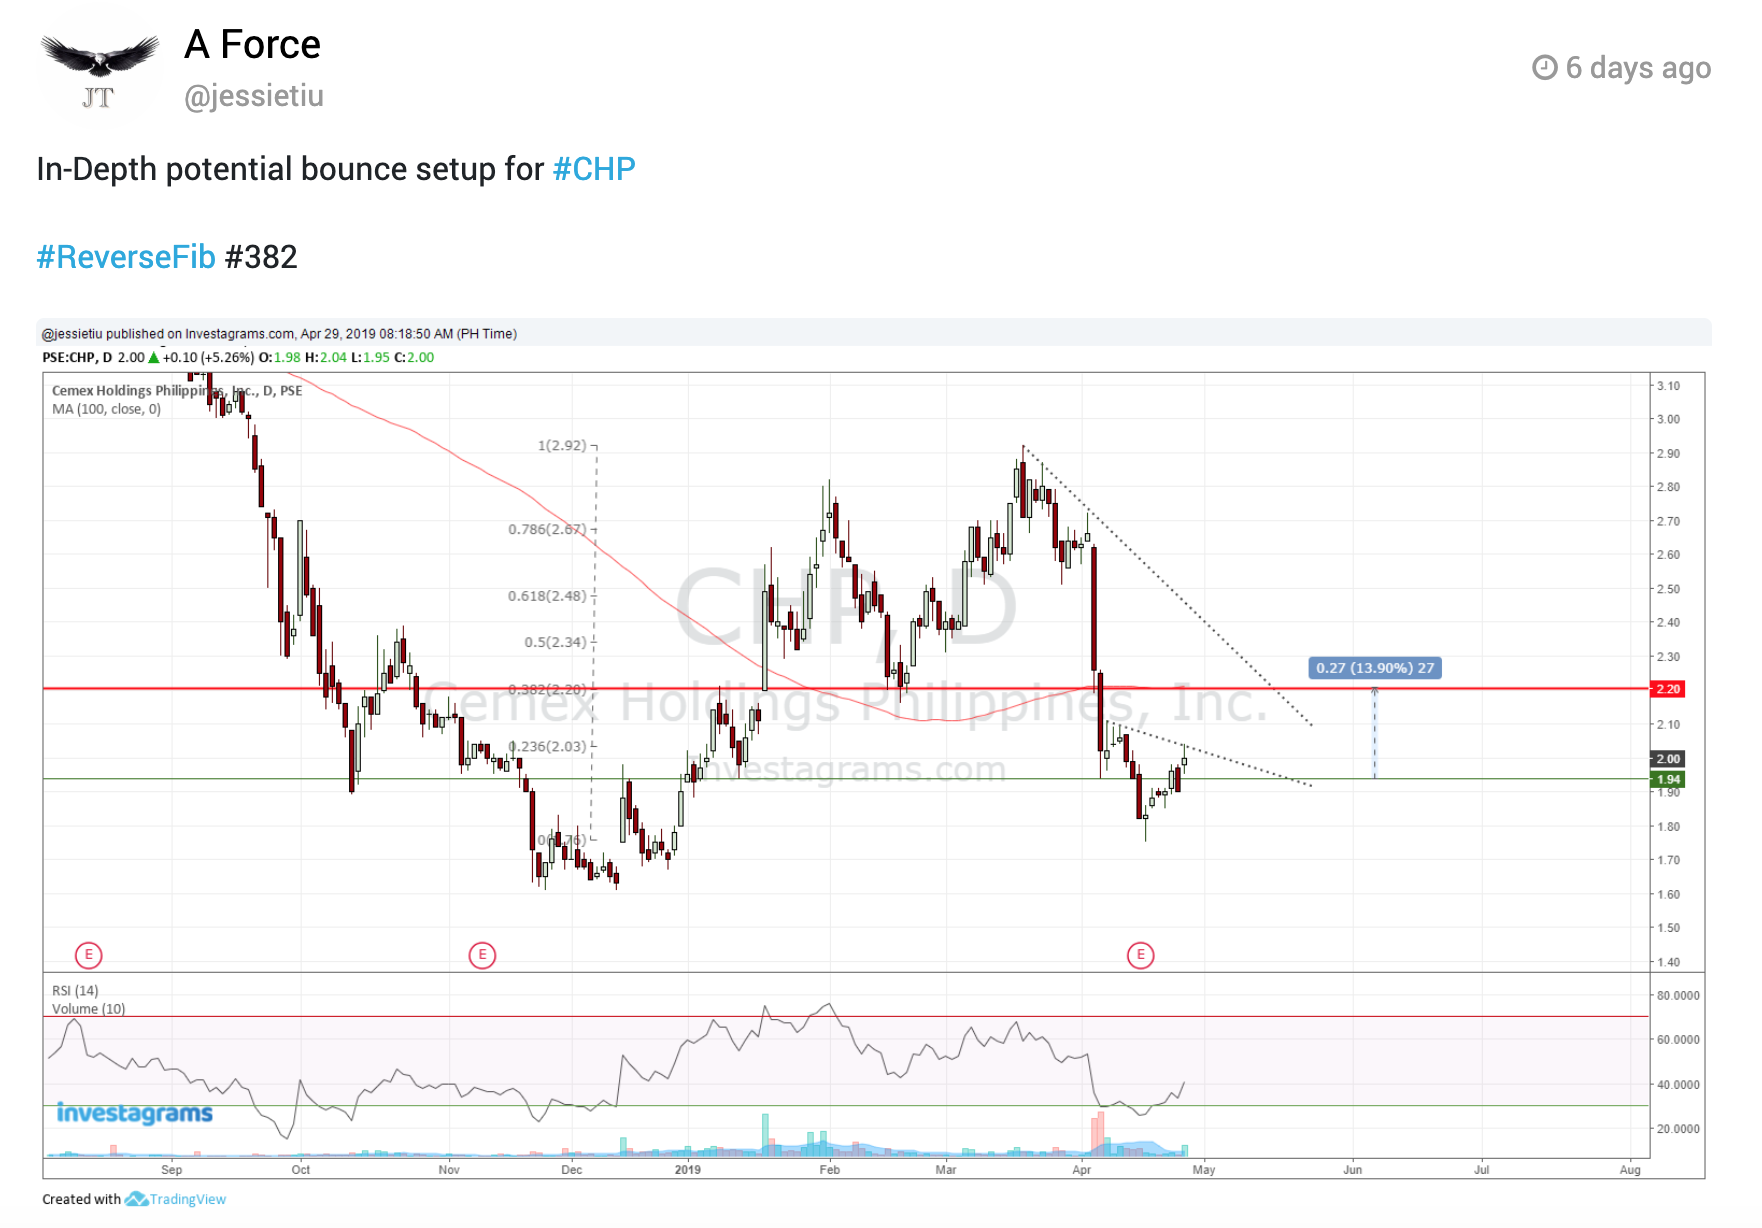
To put his chart on context, he looked at the daily chart timeframe and used Fibonacci levels to forecast the extent of the length of his trend bounce. For those who are new with this kind of set up, Fibonacci retracements are ratios used to identify potential reversal levels and/or uncovers hidden support and resistance that are created by the golden ratio.
In this scenario, he was able to identify a potential trend reversal play from the stock’s prior move based on the following:
1. Identified reversal on a moderate retracement at 0.382. (catching this requires a closer watch and quicker trigger finger – see what happened on April 30 where there’s a quick movement of price: reached the highest at 2.21, and closed at 2.17.)
2. Moving average at 100: MA100 aligned with the 0.382 Fib levels thus potential play scenario.
3. Chart accompanied by RSI level at 40 that signifies more reliably signal bullish condition. (The RSI or relative strength index is a momentum indicator that measures the magnitude of recent price changes so a trader can evaluate overbought or oversold conditions.)
Here’s what happened days after his analysis:
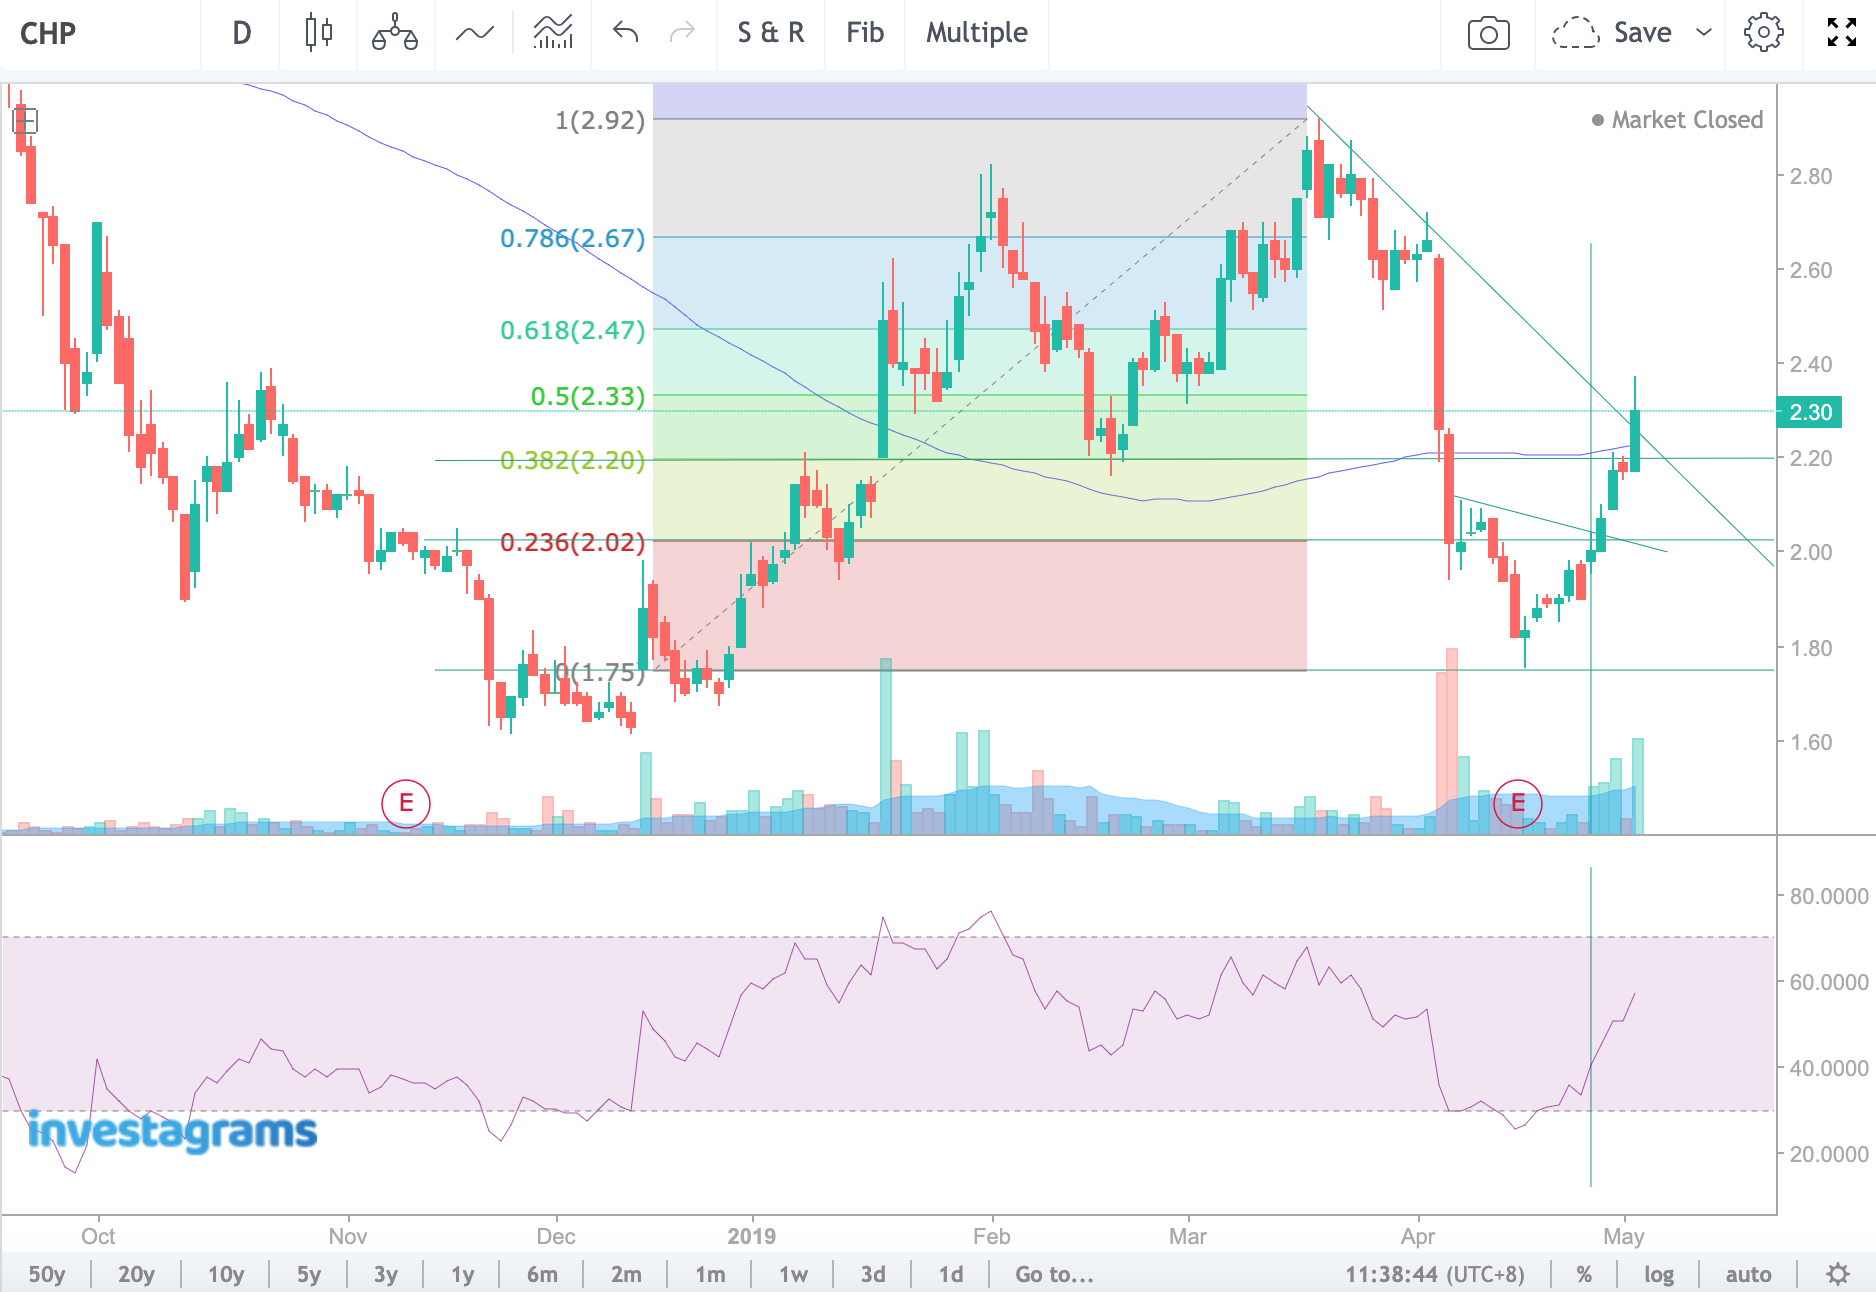
Two days after (April 30), the 0.382 levels reached with a quick play but as the buyers and sellers are still undecided (confirming doji candle on May 2), then we can say that the confirmation only came on 0.382 spot on May 3 (price opens at 2.17 and closed at 2.30), crossed MA100, and RSI hits 57.2 respectively.
If you bought at the opening price 2 levels and sold at the close of 2.30, that will give you an astounding 14.84% gain in just a few days. $CHP was also tagged as one of the Top Gainers last Friday!
We would like to congratulate all the $CHP holders and those who followed @jessietiu’s trade!
Retrospection
In this kind of plays, we must be able to hold on to our risk and reward analysis as the market always changes. The successful traders will always come back to the questions like: “Why is it going up?” or “Why is it going down further?” probably of the same reason it went up or down five, two, or one year ago. There’s that reason that for one day, there are more buyers than sellers or vice versa and that’s not going to change. Traders will come and go, and the reality is, it will come back to the basic human nature – FEAR and GREED. Part of A Force’s chart analysis is that he gave us a piece of advice via his comment section to traders to “be quick in taking profit once it hits resistances.” And to be a successful trader, it all comes down on how you manage your reward-risk ratio.
Let’s keep sharing and helping each other because that’s what #Investagrams is all about!
Till next time, Happy Trading!