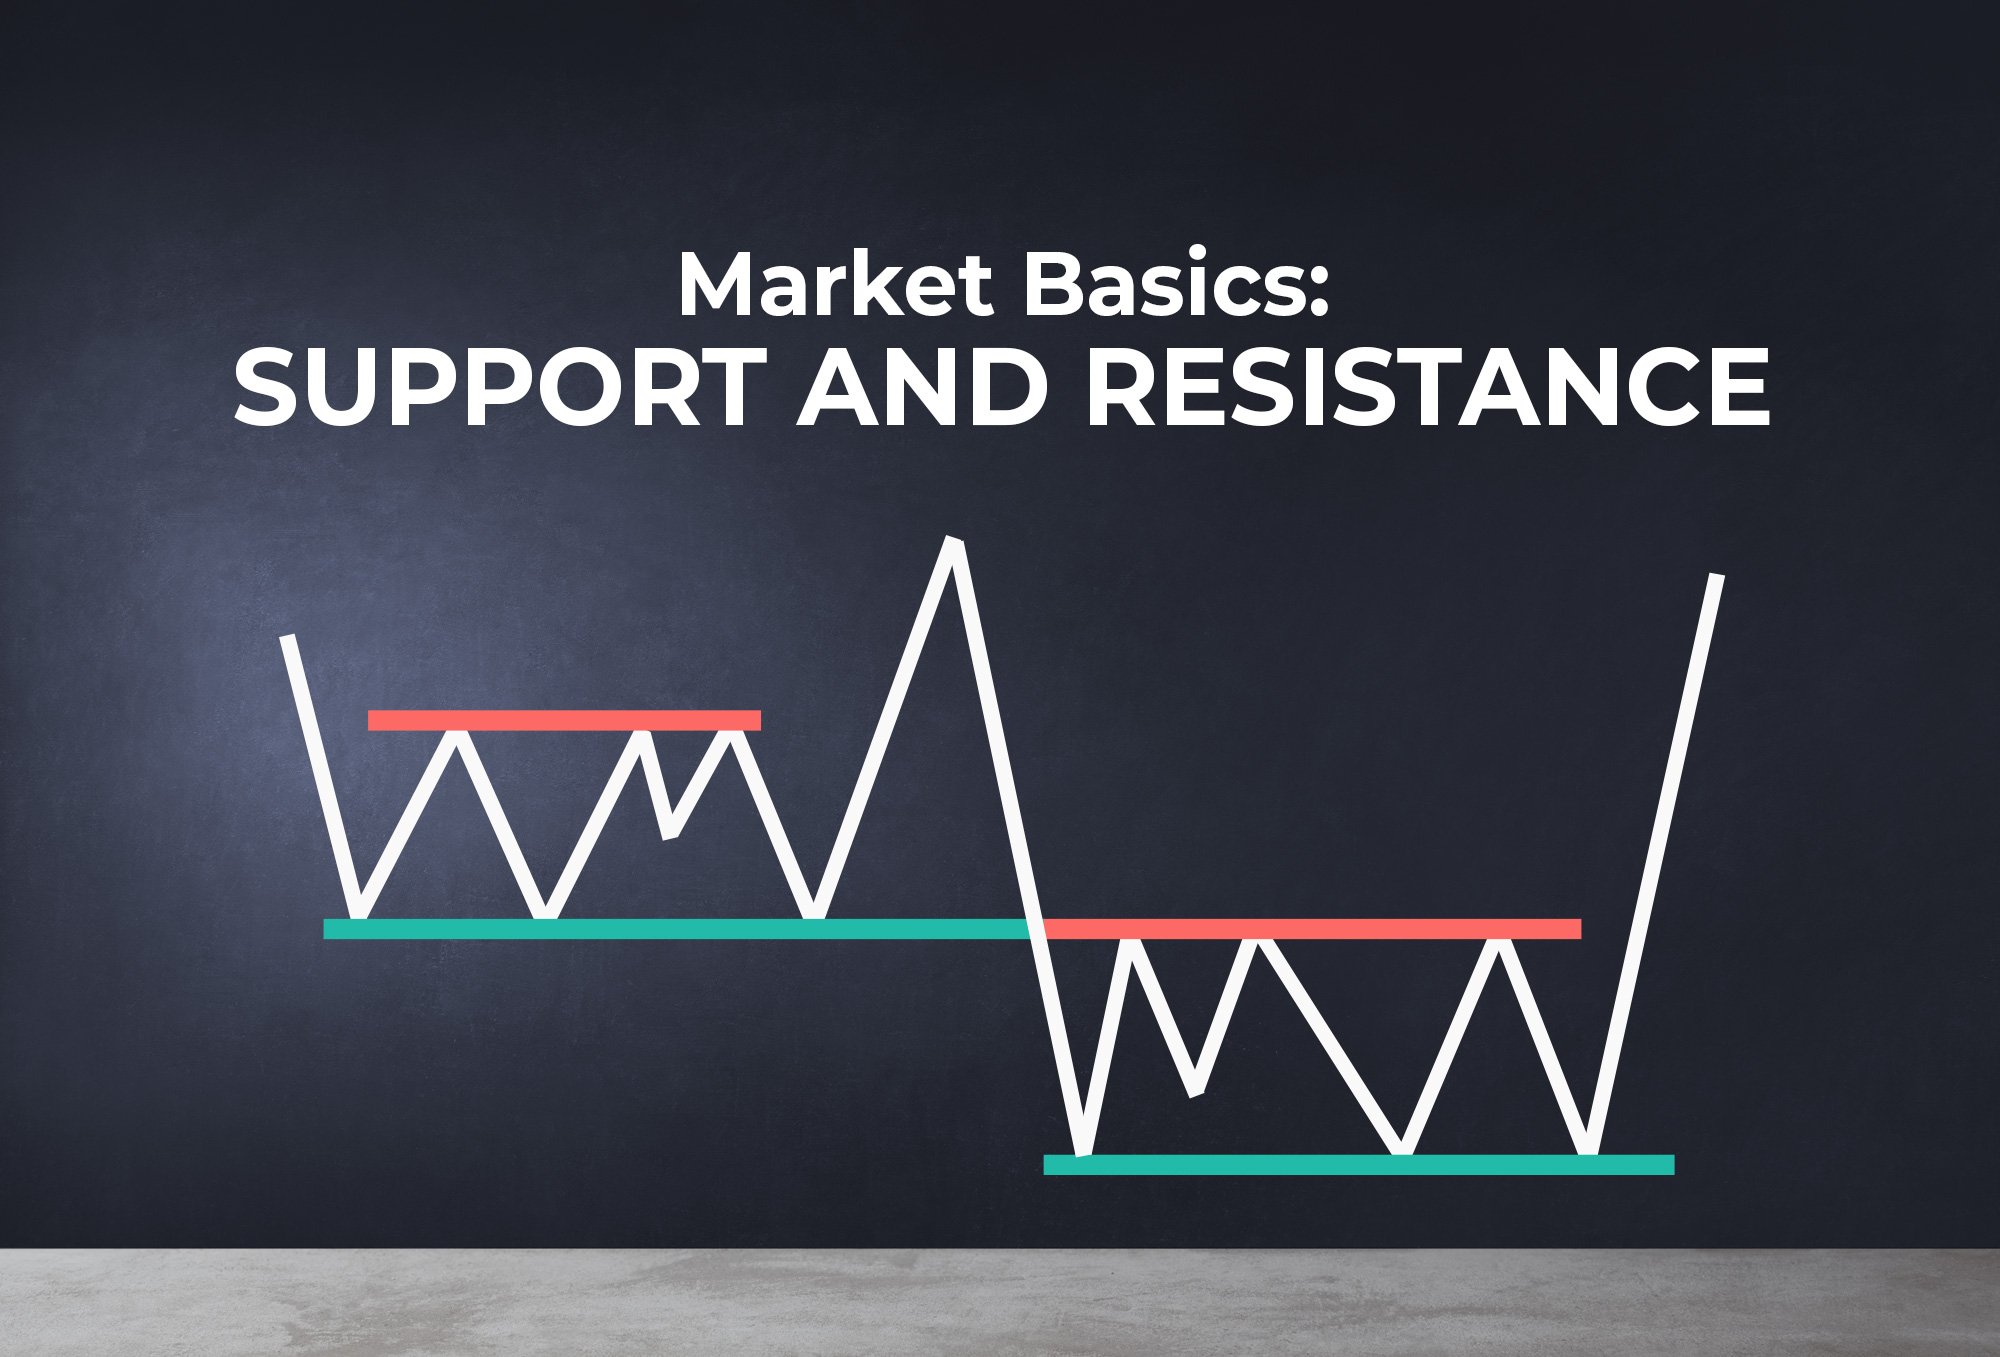
One of the most fundamental concepts any trader should learn in the stock market is finding the support and resistance levels in a chart. The beauty of these areas or zones is that it will help you identify where the supply and demand are – the two major forces that move the market. Knowing these two validates your points of entry and exit when entering a trade.
Whenever the market needs to accumulate and distribute shares at different price levels, the stock goes to unprecedented price levels (upwards or downwards), and new support and resistance will be formed. On the other hand, if a stock is moving sideways, then the price will gravitate towards to as it waits for a breakdown of support or breakout of resistance.
Identifying Support and Resistance:
Support
The support area is where the market prevents the stock from declining further. The market psychology behind this is that the buying power is strong enough to hold a price. During market movement, the price declines and moves towards these levels where the buyers (bulls) acquire a stock price at the same area and eventually overcome the selling pressure made by the bears (sellers). In short, buyers look at support levels as a buying opportunity.
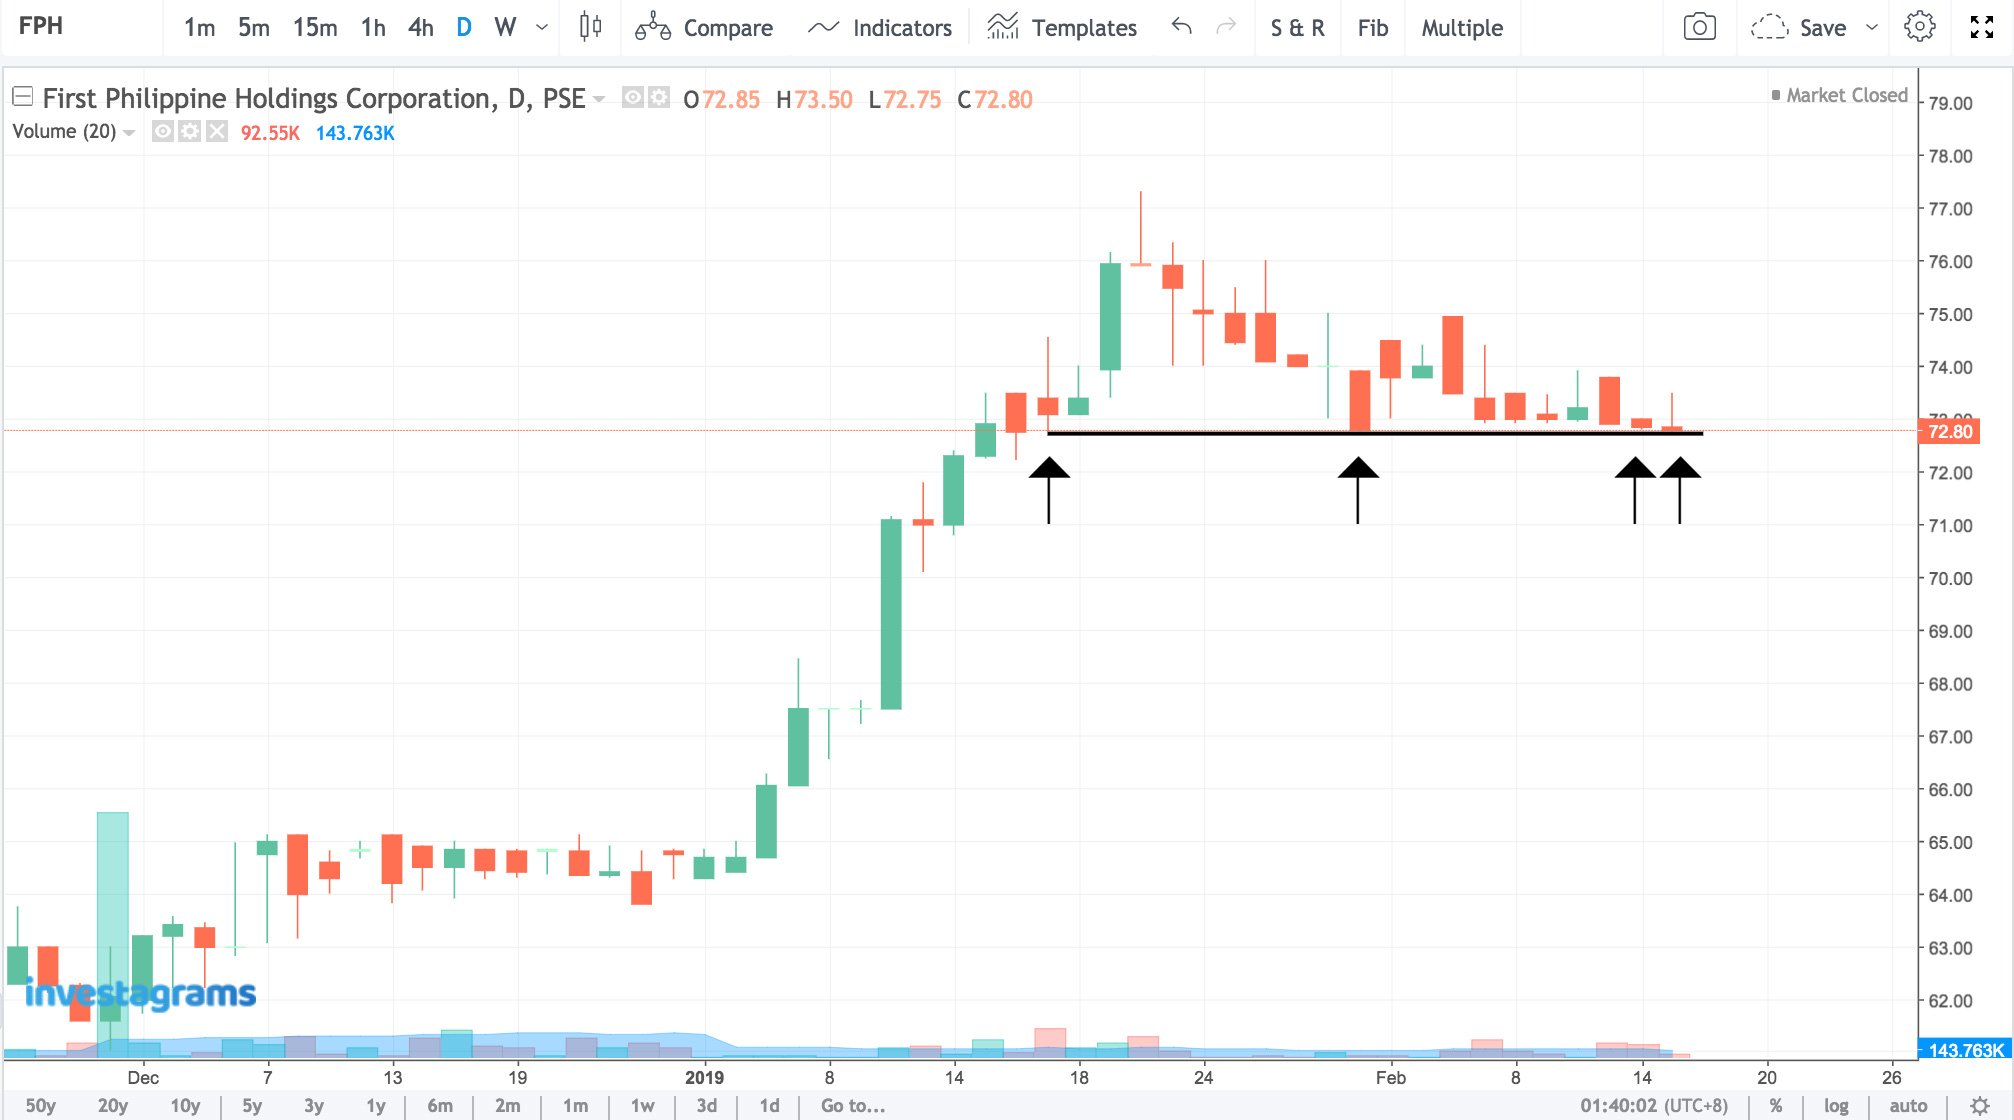
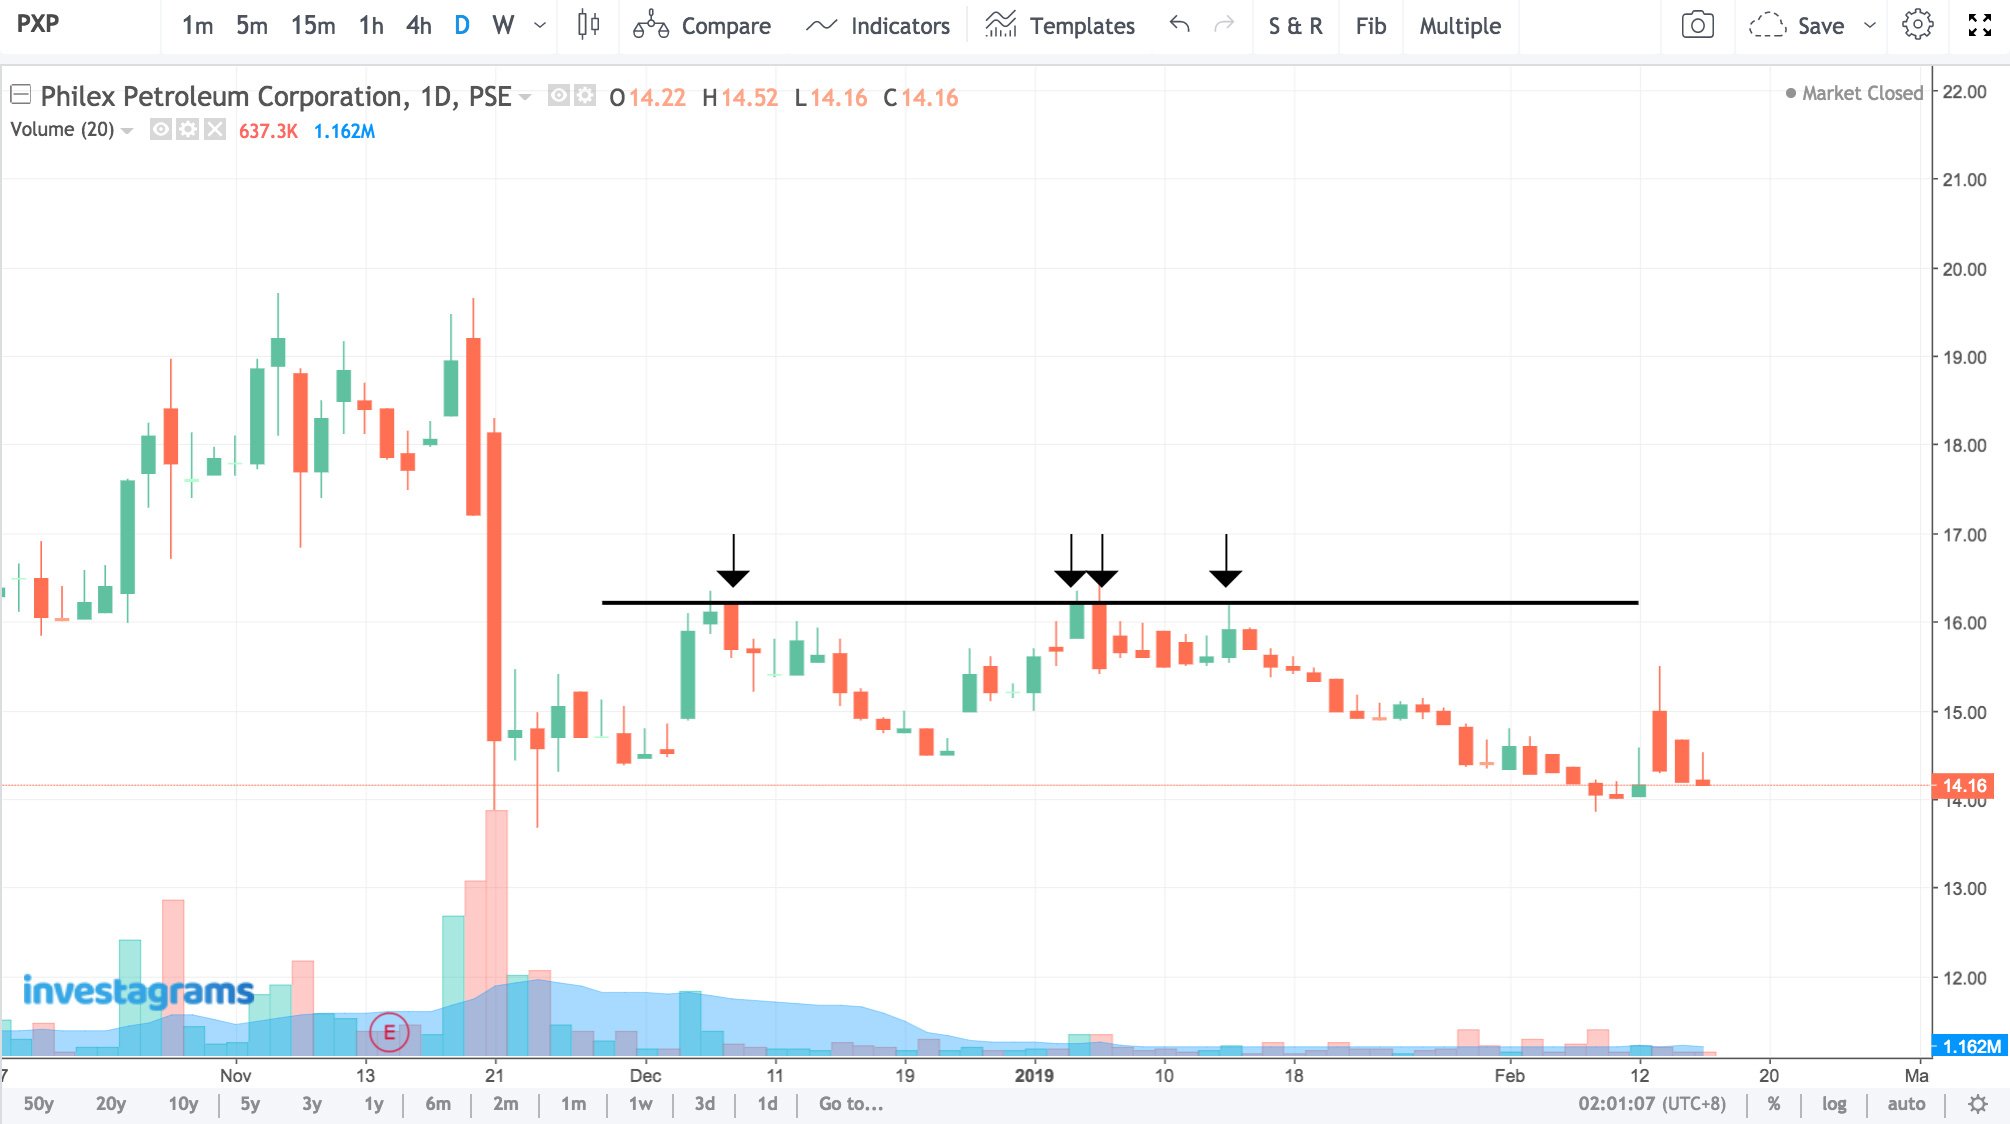
The chart below shows you how support prevented the stock from declining further on numerous occasions, forming a “floor” of support.
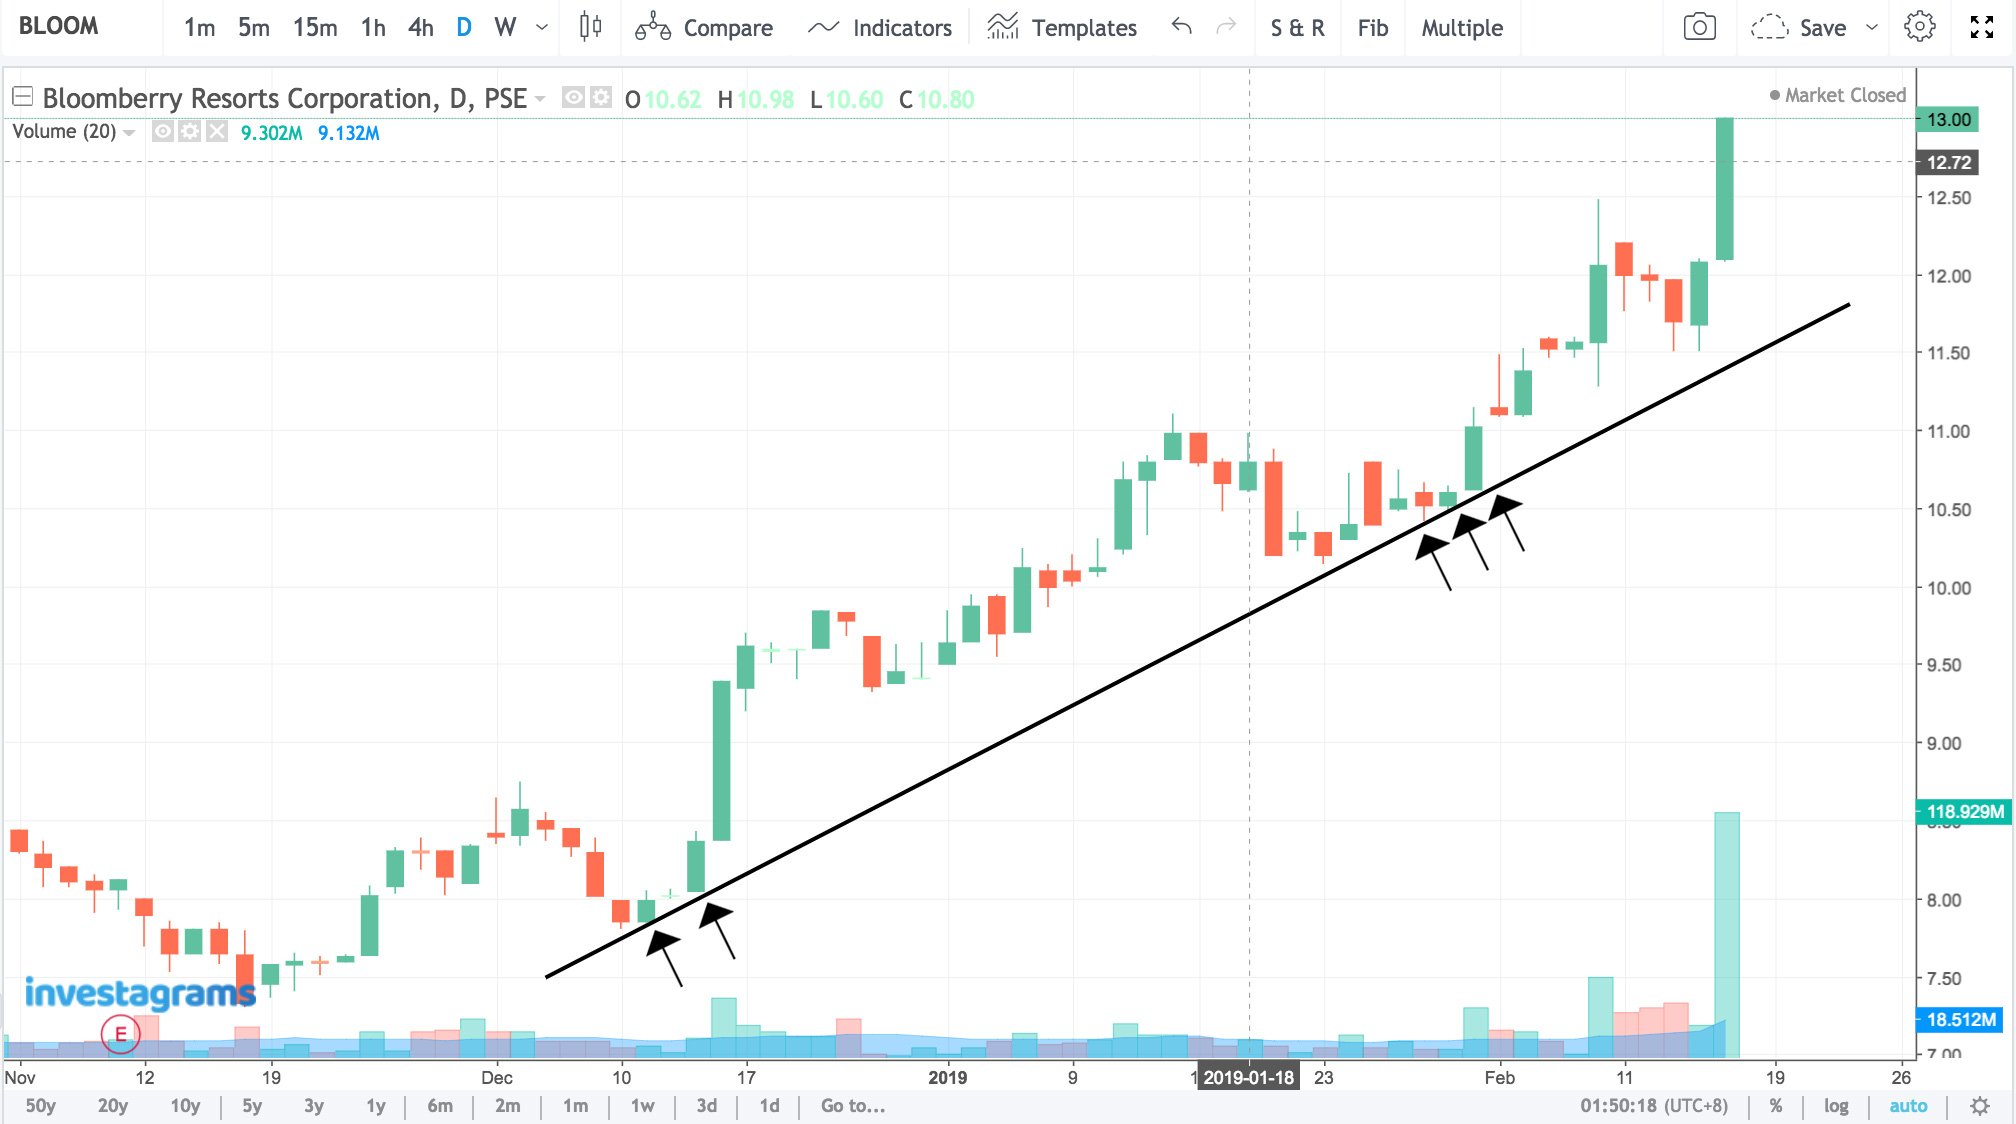
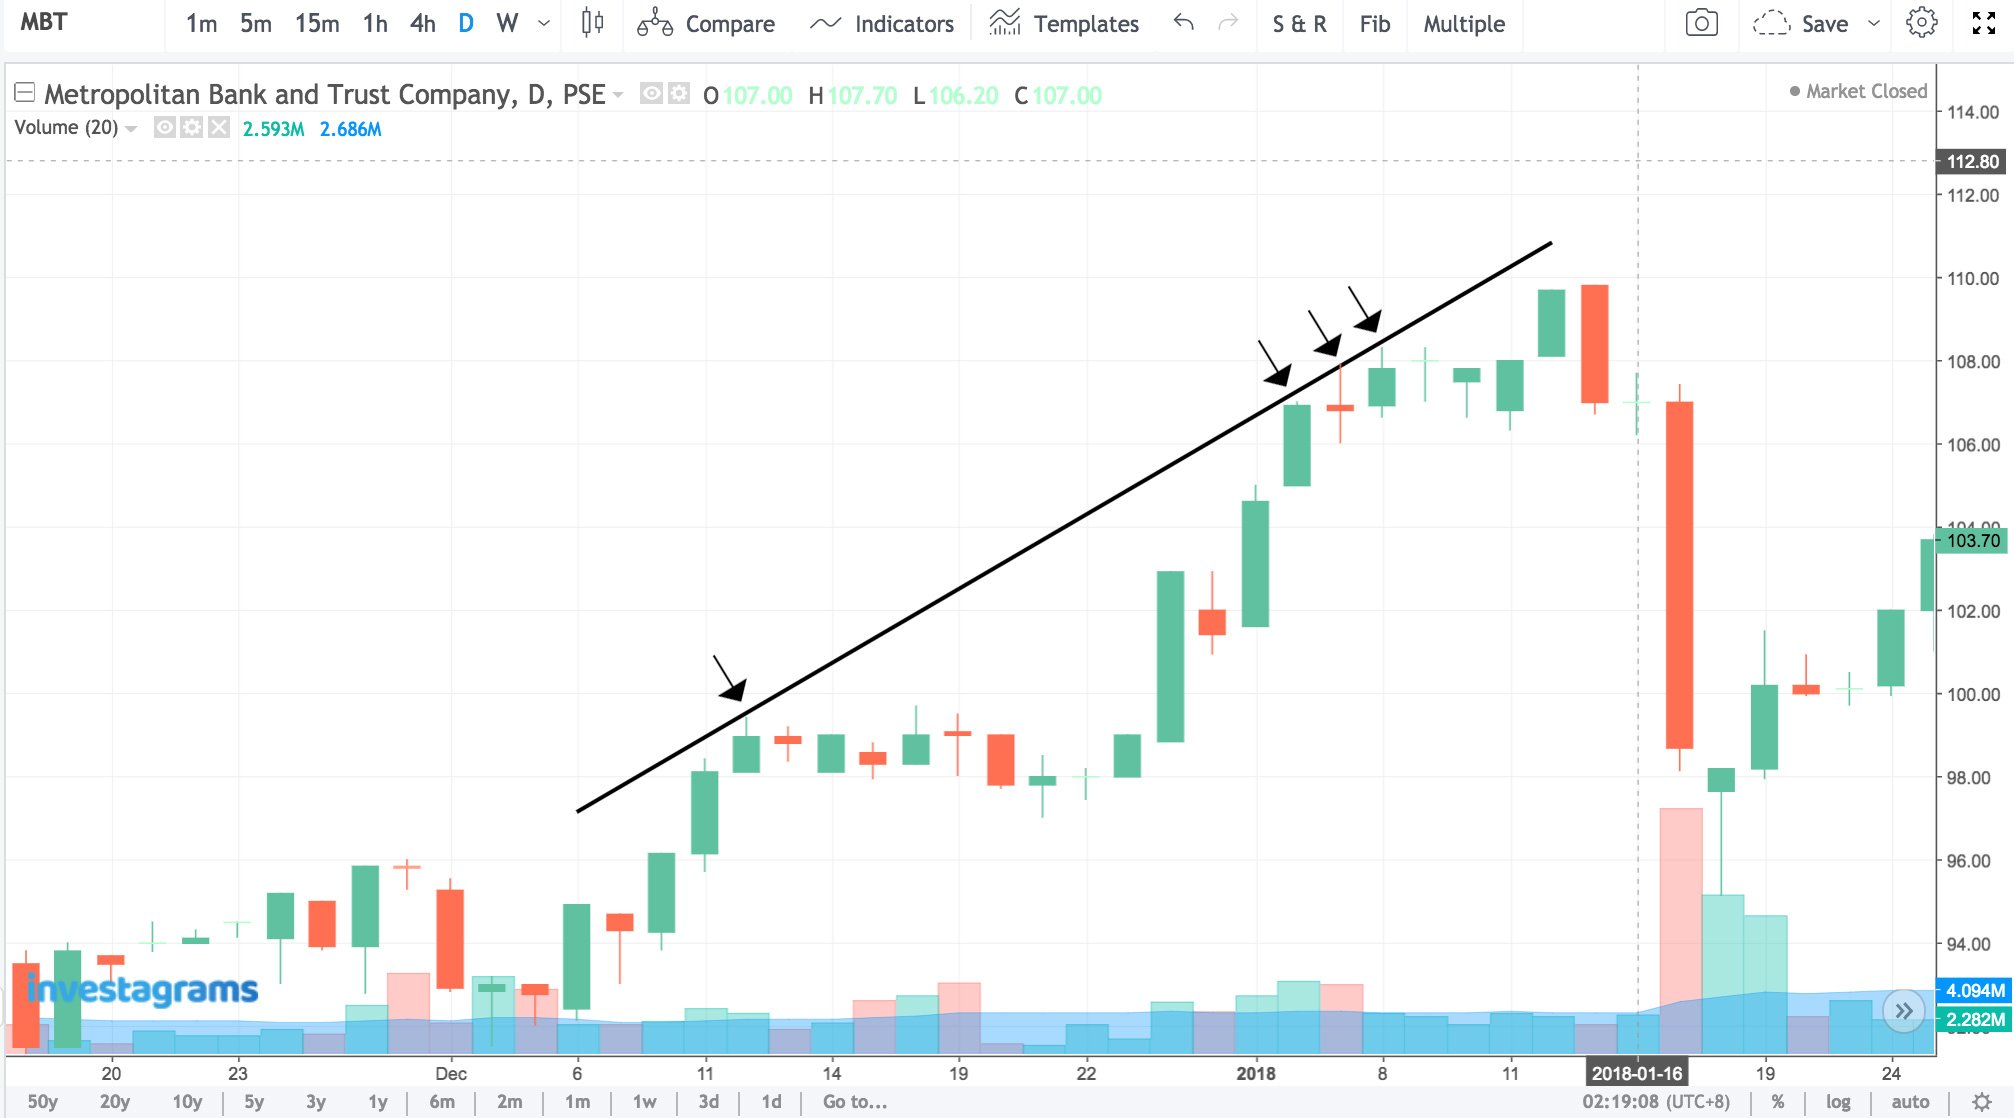
Support can also be identified while the stock is trending upwards or downwards and based on the chart below, buyers supported the stock from reversing from its uptrend. As the stock created dips or retracements, buyers saw this as an opportunity to ride the trend or to add shares to their current positions. These collective market decisions continually overwhelmed all the profit taking and selling pressure from the bears that helped sustain the uptrend.
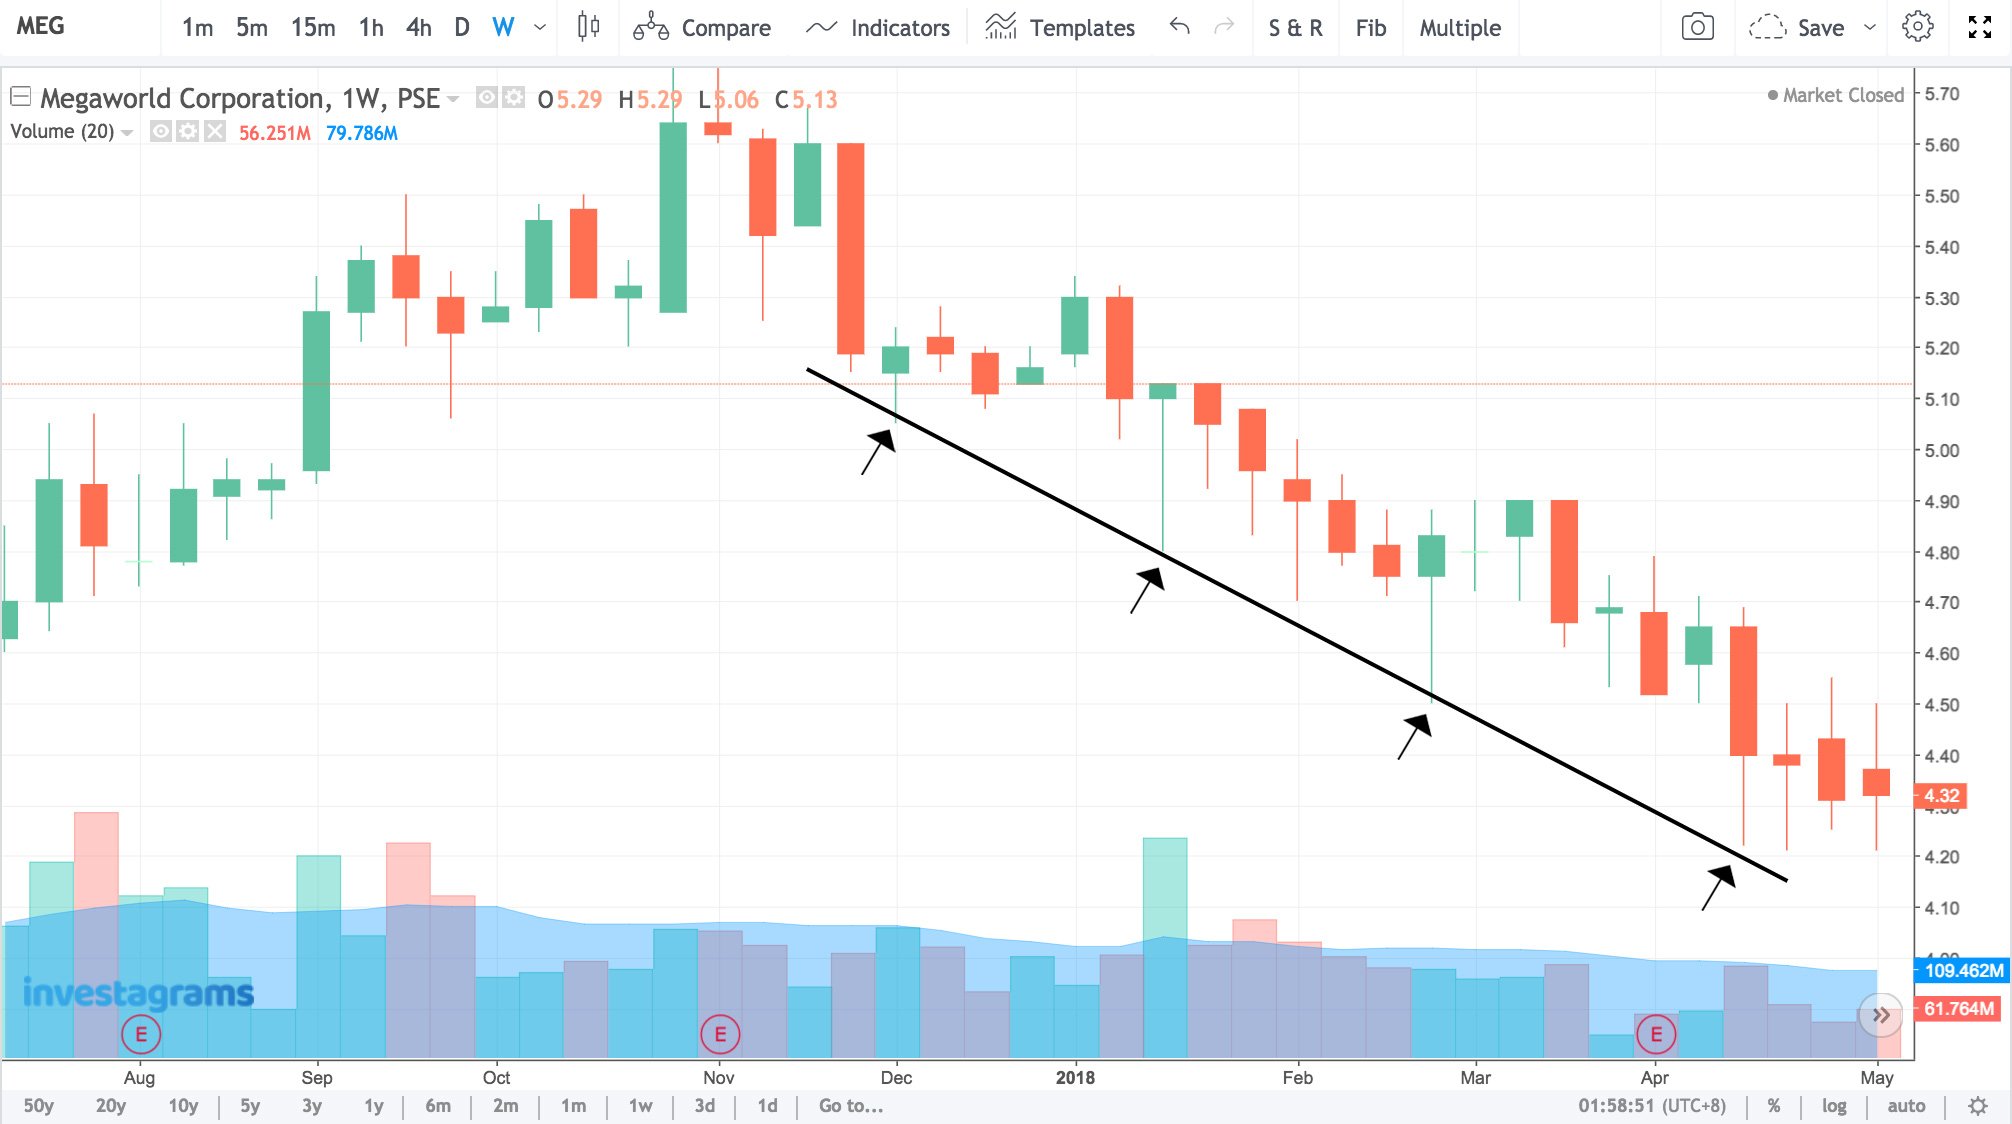
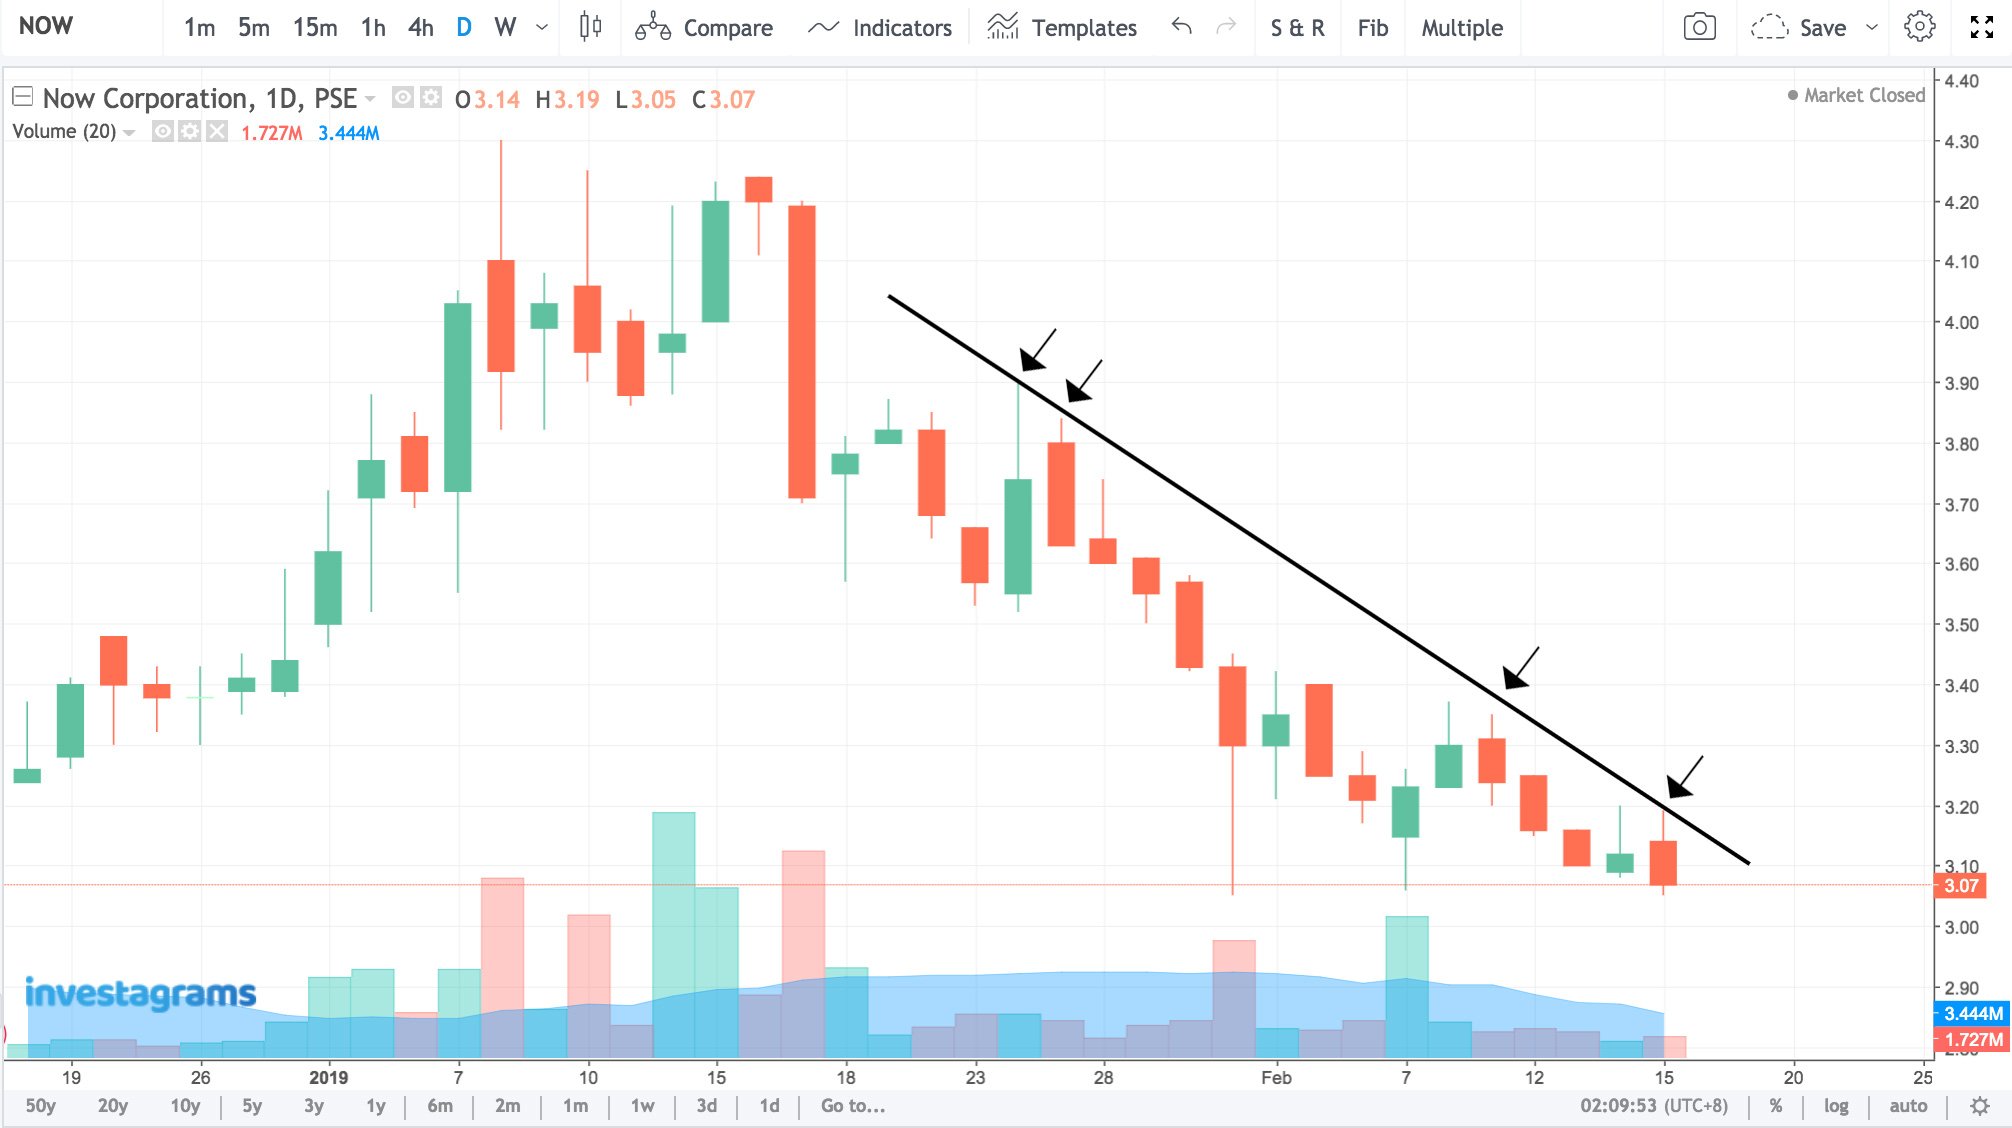
Alternatively, the support depicted here in the next chart below suffered a different fate compared to the previous one. Buyers here tried and tried again to prevent the stock from trending lower, but the selling pressure was overwhelming enough that it created a downtrend or a series of lower lows and lower highs, breaking down each newly formed support.
Resistance
The area or level that prevents a stock from moving upwards is called resistance. This is mainly because the majority of the sellers are selling at a certain price level of a stock that ultimately overpowers buying pressure.
The chart below showed how the resistance is formed during April acted as resistance again during the last week of August and early October. It went on to become the stock’s ‘roof’ where price keeps getting rejected to move up way pass the current resistance levels. One possible reason is that the investors who bought during the high in April continually sold their positions during the highs of August and October as they break even and exit.
During downtrends, resistances can be seen in a descending trend distinguished by lower highs and lower lows where buyers are not strong enough to overpower the sellers.
Meanwhile in uptrends, because of the underlying buying pressure from the bulls, resistances keep on forming higher highs as they become more willing to pay a higher price for the stock.
Here are the things that you need to take note whenever you look at the support and resistance levels:
– Support and resistance occur in all timeframes.
– In general, the more often an area is ‘touched’ and not broken, the stronger the area is.
– Support becomes resistance: If the price falls below a support line, then the demand for that price wasn’t strong enough to keep the support line intact and the traders who bought at this levels are now stuck in positions at a (possible) loss.
– Resistance becomes support: if the price is broken way pass the resistance line, then the resistance level is now considered as new support.
– The common notion for traders: Buy low (support) and sell high (resistance).
Helpful Indicators:
The indicators below are just a few from a plethora that adds additional support and resistance. Further research about these two indicators is highly recommended before incorporating it into your trading system.
Fibonacci Retracement (FIBO)
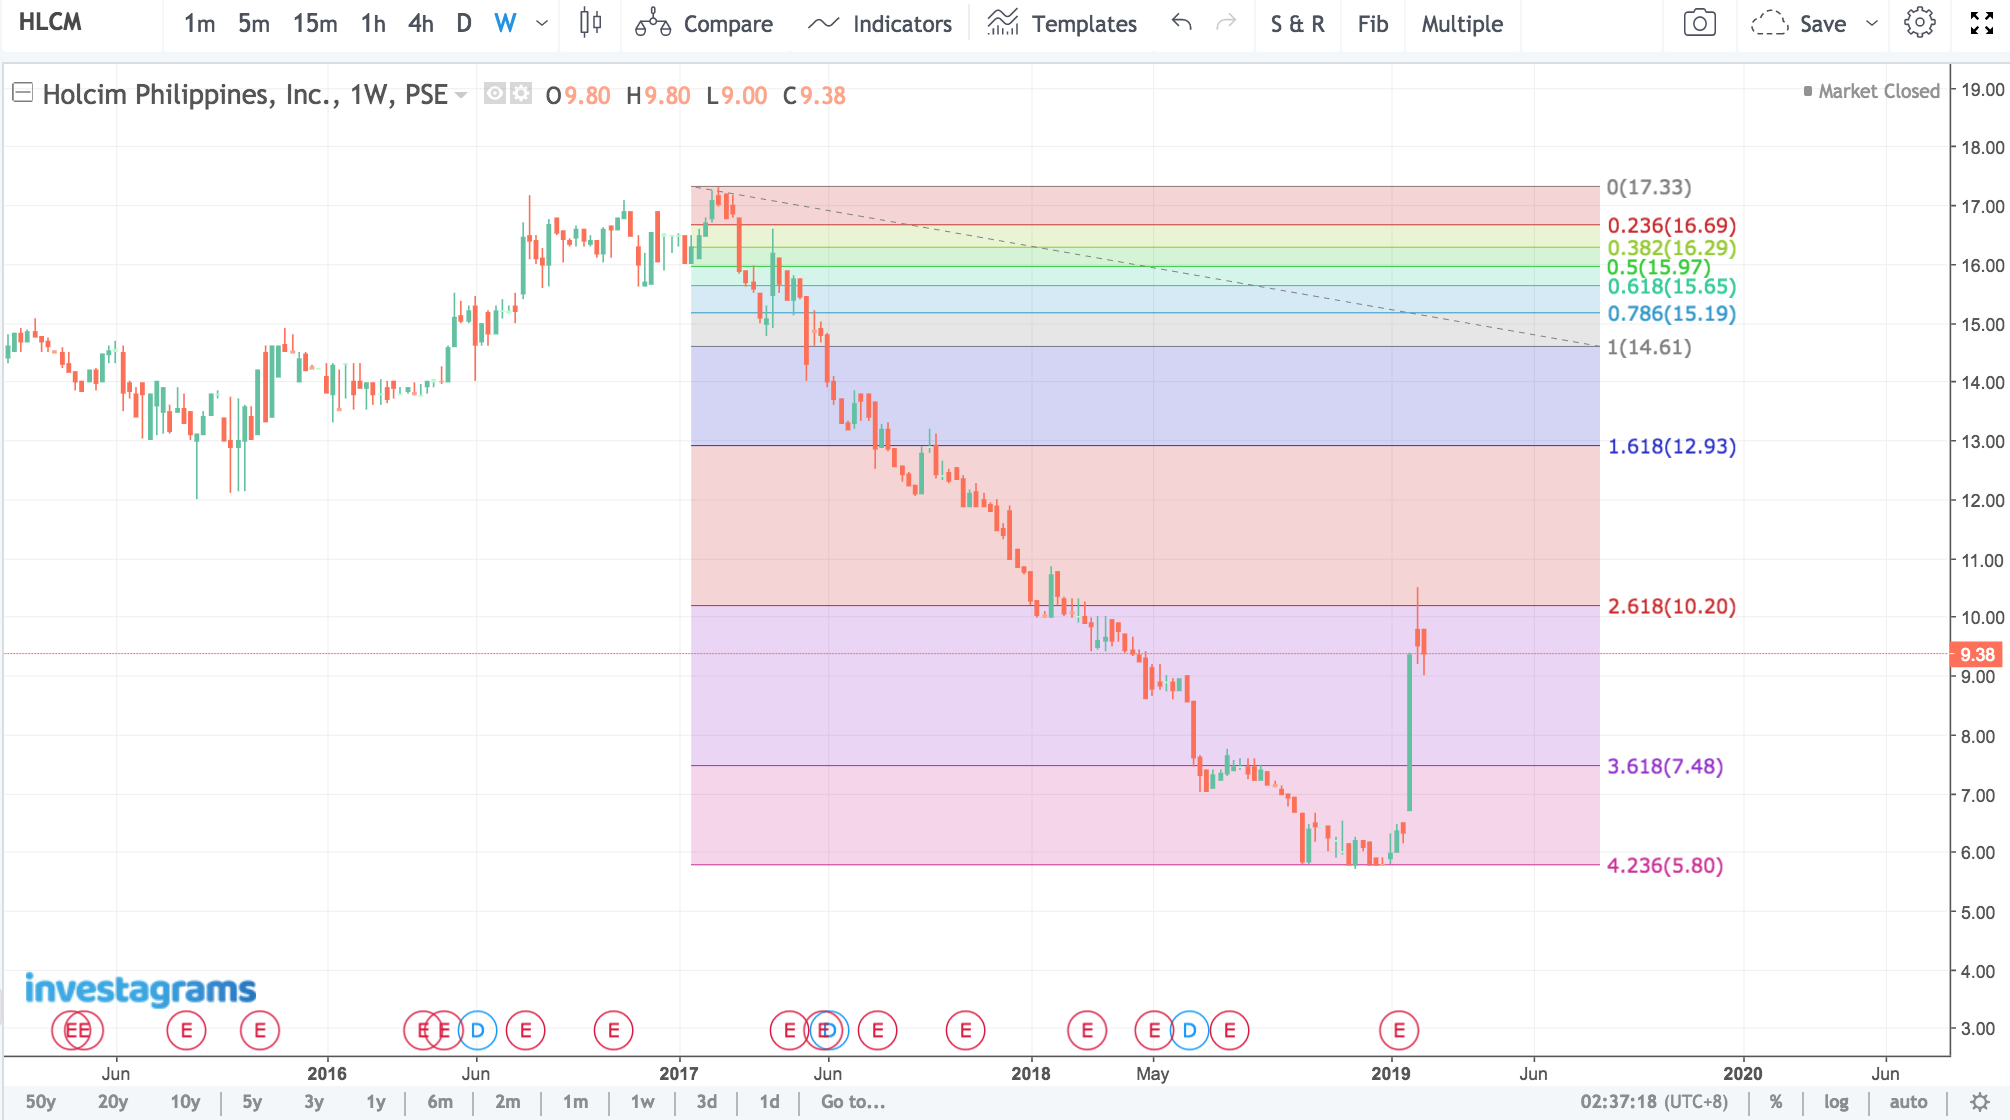
This indicator provides support and resistance from its formulated ratios. Simply put, if the FIBO plotted from swing high to swing low, it will identify possible resistance levels. If the chart is plotted from swing low to swing high, it will display possible support levels as a stock retraces from its high which is useful for a bounce on support traders.
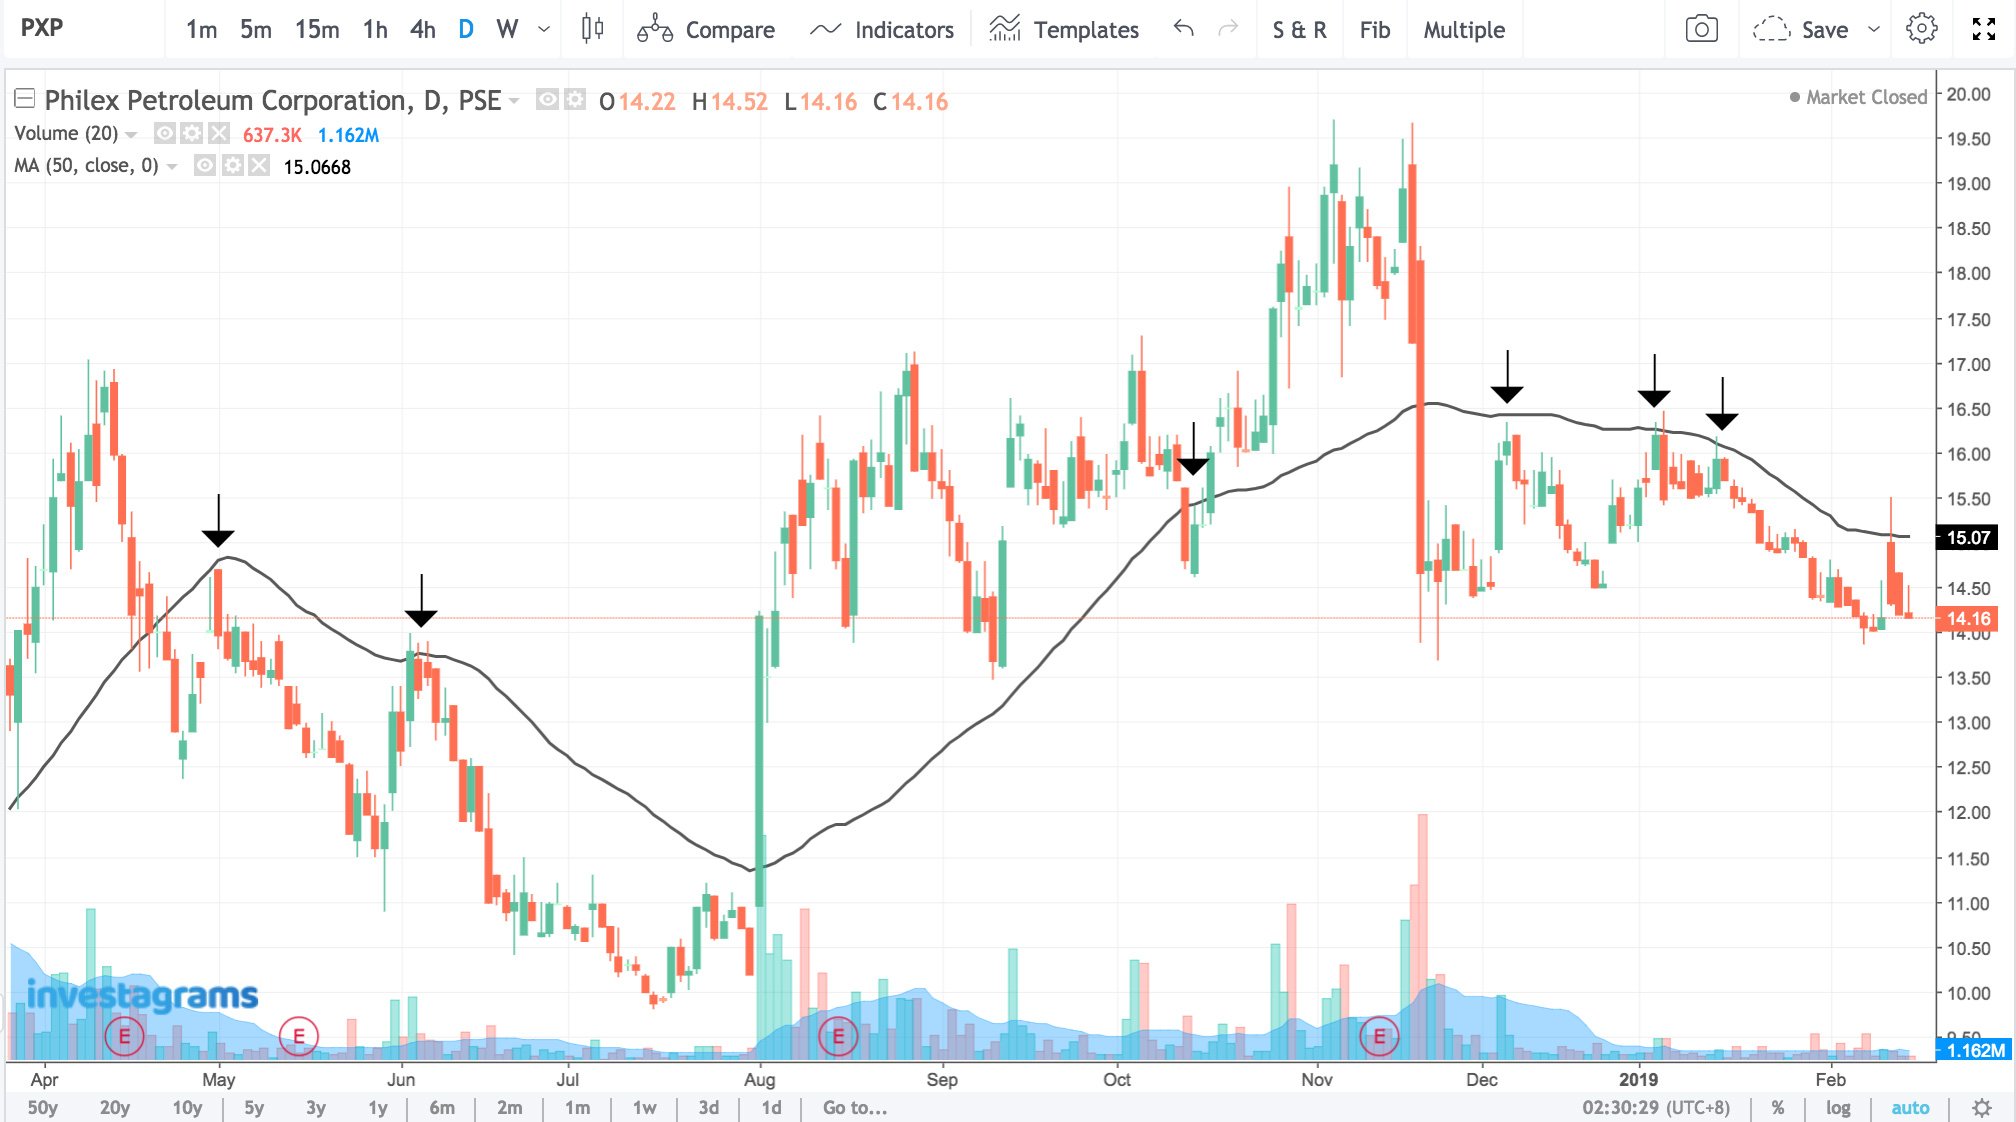
Moving Average (MA)
The moving average approach sometimes serves as dynamic support and resistance utilized by some traders. They’re called dynamic because they move along price movements. The chart below shows how the 50-day moving average served as resistance for several times for this stock.
Summary
Support and resistance can be subjective at times mainly because some traders plot them at wicks while others plot at the body of a candlestick. Some traders use the indicators above to find confluence in support and resistance levels/areas while others prefer a more straightforward approach by only plotting them in their structural form. It is also essential to examine how a candlestick closes at a support or resistance level and/or whether it closes above or below it.
Major market players (institutions and fund managers) influence the direction greater than retail traders. There will be times where they could “dictate” support and resistance levels as they significantly provide the supply and demand in the market. They would sometimes trigger breakout traders to buy at the break of resistance only to sell hard on them, creating a liquidity pool to distribute their shares. They may also trigger some traders to exit their positions as their stops are hit below support only to close above support again as these major market players needed the former’s shares in order to allocate more.
As the market trends upward, resistances will be tested. As it trends lower, support will be tested. The market volatility can make or break traders as they look for their preferred setups and trading decisions will be are made at these levels – whether in buying or in selling, in entries and exits and from trigger prices to cut loss levels. That’s why understanding the support and resistance levels of the stock you’re trading is more important than knowing how to click the buy and sell button.
Safe investing!