At first, reading stock charts can be daunting and confusing. Some beginners just focus on the zigzag pattern a chart displays and rely on their hunches and gut feels whenever they feel like the market is about to turn in (or against) their favor. Although it may earn them a few gains or so in the beginning (assuming luck is on their side), it won’t be good for them in the long run. Speculation is wishful thinking, and betting on a stock without proper knowledge of trading is very risky as it may cause a person to lose all his hard-earned money in no time.
There was a time when I was charting during office breaks and one of my colleagues asked me whether it would be good to buy the stock I’m looking at since it seems like it’s about to go up and ‘to the moon’ (a trading term which means that a stock is on top of the all-time high).
Unbeknownst to her, the stock was not really a “stock” because what she was referring to is the chart of the Philippine Stock Exchange Index (PSEi). She told me later on that she bought shares from First Metro Philippine Equity Exchange Traded Fund (FMETF) which is akin to the chart of the PSEi.
I told her that based on the price action (candlestick formations) of the chart, there was a high probability that this would be bearish in the coming days because of the evening star (bearish abandoned baby, shooting star or pivot high in some books) candlestick pattern in confluence with the bearish divergence from my RSI’s setting. Unfortunately, she did not consider my honest analysis and went on to heed the post from a Facebook Group recommendation that she joined recently.
Today, she’s in a dilemma because she’s seeing red amounts in her portfolio (she’s losing her money). Why? Because she bought somewhere in the 9,000 levels of PSEi equivalent of the index fund she bought even after a new calendar year. In hindsight, maybe if she knew how to read candlesticks then perhaps she wouldn’t have had bought then, right?
The above story is one of the precedents as to why a beginner or newbie investor should consider studying technical analysis, especially how to read candlesticks.
This is what the article is about – the foundation of technical analysis: CANDLESTICKS. Learning candlestick patterns bolsters our ability to trade the market more successfully.
Here are five reasons why learning how to read and interpret candlesticks will help you tenfold:
1. It will teach you how to think in probabilities.
2. It greatly improves your odds for a winning trade.
3. You will learn how to come up with your own analysis.
4. You will know who’s winning: buyers (bulls) vs sellers (bears).
5. This will be the “blueprint” for most of the trading setups you’ll trade.
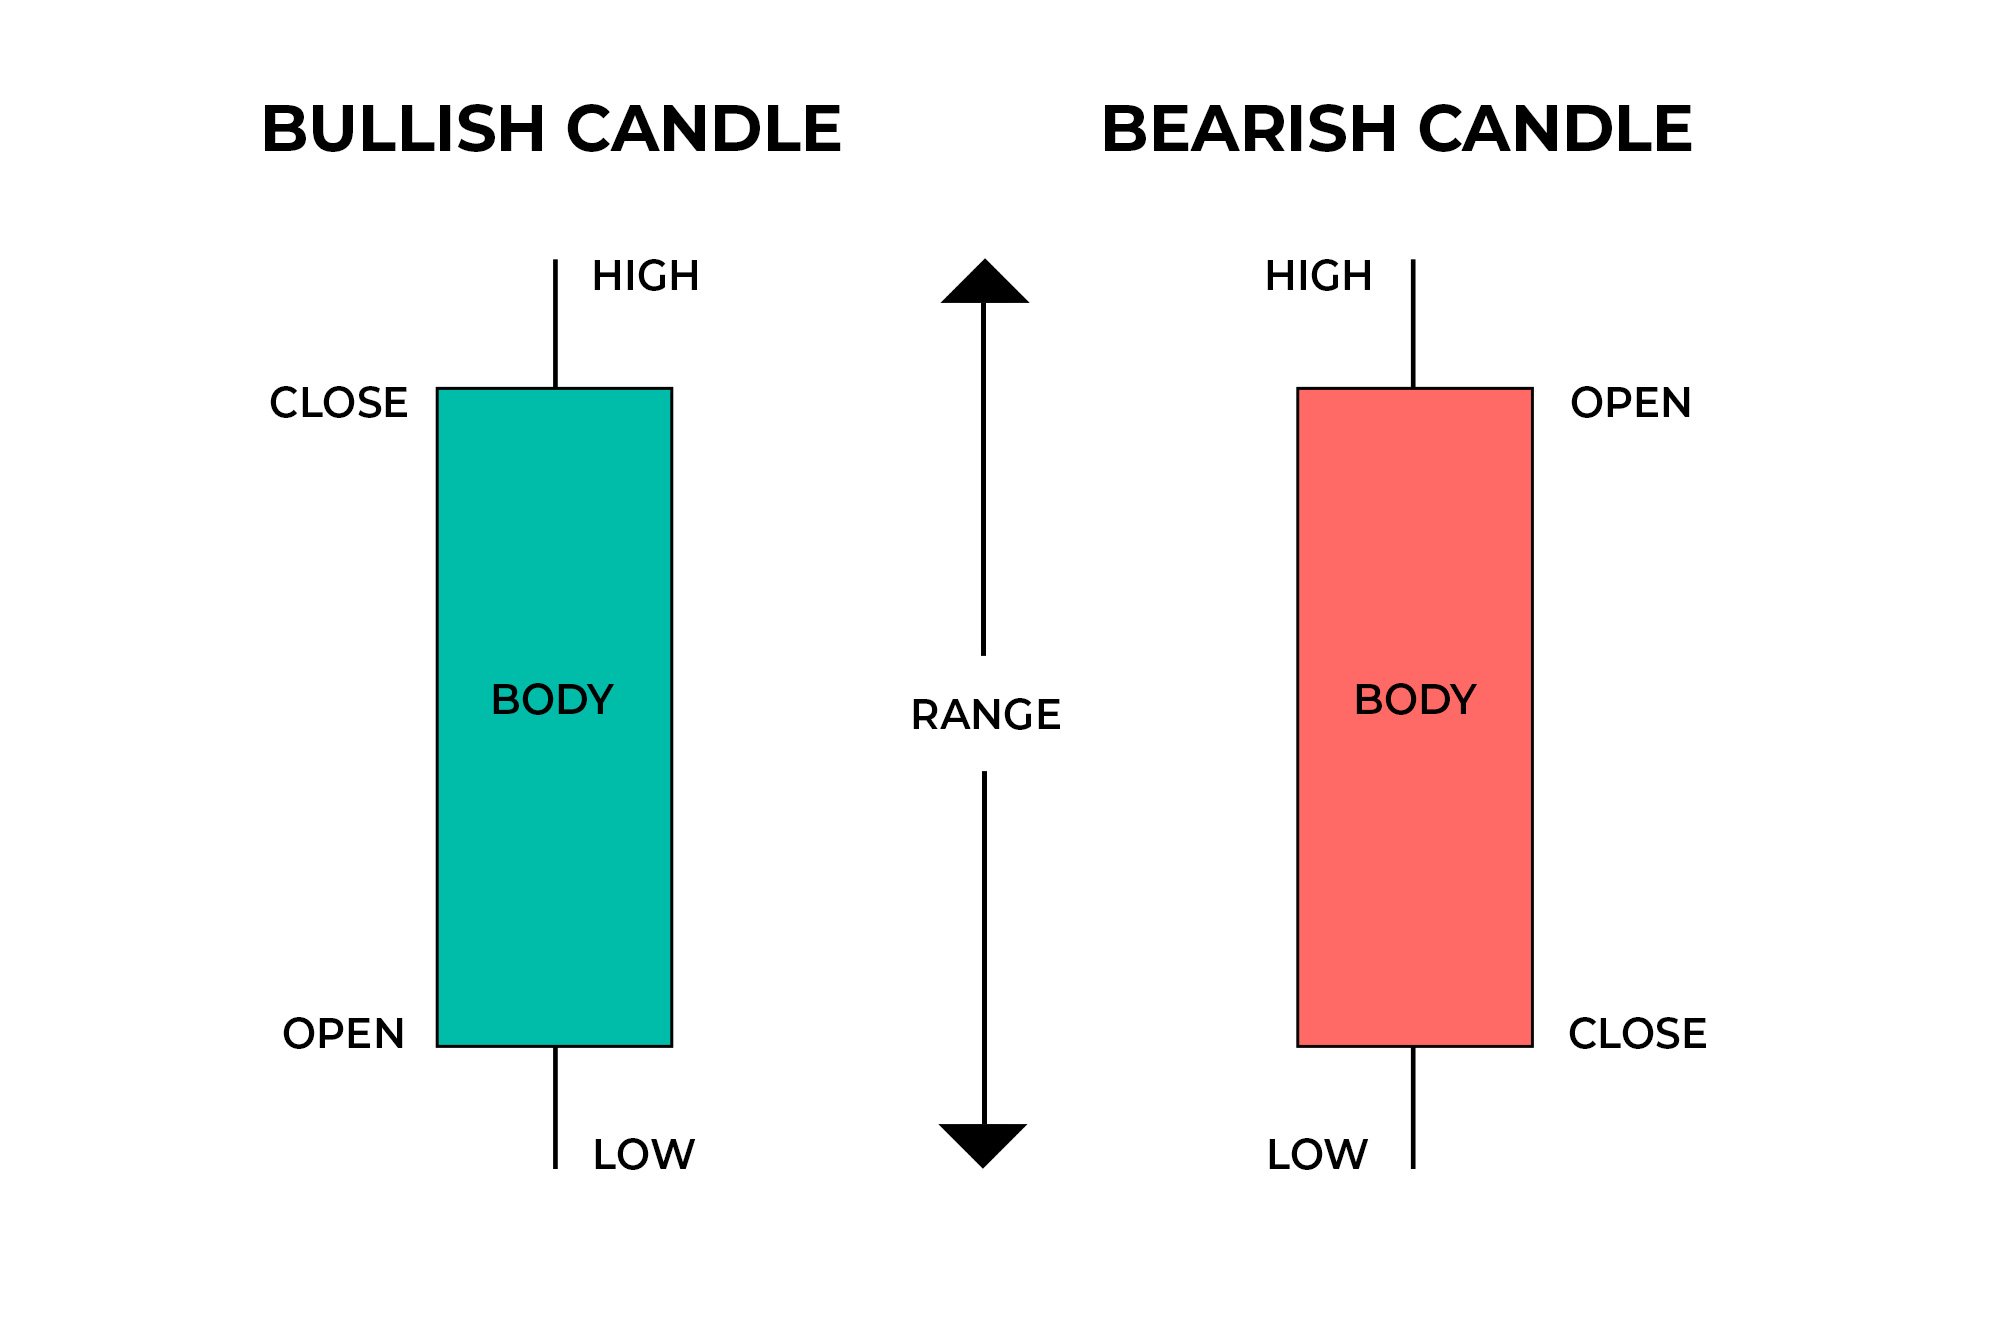
Open, high, low, close, body – the parts of a candlestick
When looking at a candlestick, it is important that you know the open, close, high, low, as well as what the body and even the range is. For the following examples, we will use green (when the candle is trading or closes above its open or commonly known as Bullish Candle) and red (when the candle closes or is trading below its open or the Bearish Candle) colored candlesticks.
 Open
Open
This represents the first price bought of the timeframe of your candle. If the succeeding transactions are higher than the open, then the candlestick will become color green, but if the next trades after the open are below the open, then the candlestick will turn red.
High Price
This shows the highest price traded during the period/timeframe of the candle. This is represented by the upper wick/shadow. If ever there’s no wick/shadow, then the open or close price is the highest price.
Low Price
This displays the lowest price traded during the period/timeframe of the candle. Same as what you see in the high price, there should be a wick/shadow but in this case it’s in the lower part of the candle. No wick/shadow means that the close price is the lowest price.
Close
This is the last price sold or the last transaction of the timeframe of the candle. This will ultimately determine the color of the candle. If the last traded price closes above the open, then the candlestick should be color green. Meanwhile, if the last price closes below the open, then the candlestick should be of red color. It is the most important part of the candle as this determines whether the bulls (buyers) or bears (sellers) won.
Wicks/Shadows
These are simply the lines that represents the high and the low price. The upper wicks/shadows represent the high price whilst the lower wicks/shadows depict the low price. Wicks can be long or short depending on volatility.
Range
This is the difference between the high and the low of the candlestick. The bigger the range, the more volatile the candlestick traded during its timeframe as the buying pressure battles with selling pressure. The smaller the range, the less volatile it was (could also represent as consolidation). The formula to compute this is: Range = High – Low.
Body
This is the color-filled section of the candlestick. The color of the body gives us the clue as to where the course or the bias of the candlestick is headed (either upwards or downwards). If a candlestick closed well above its high without lower and upper wicks, you can expect that buying pressure will carry over somehow on the next candle.
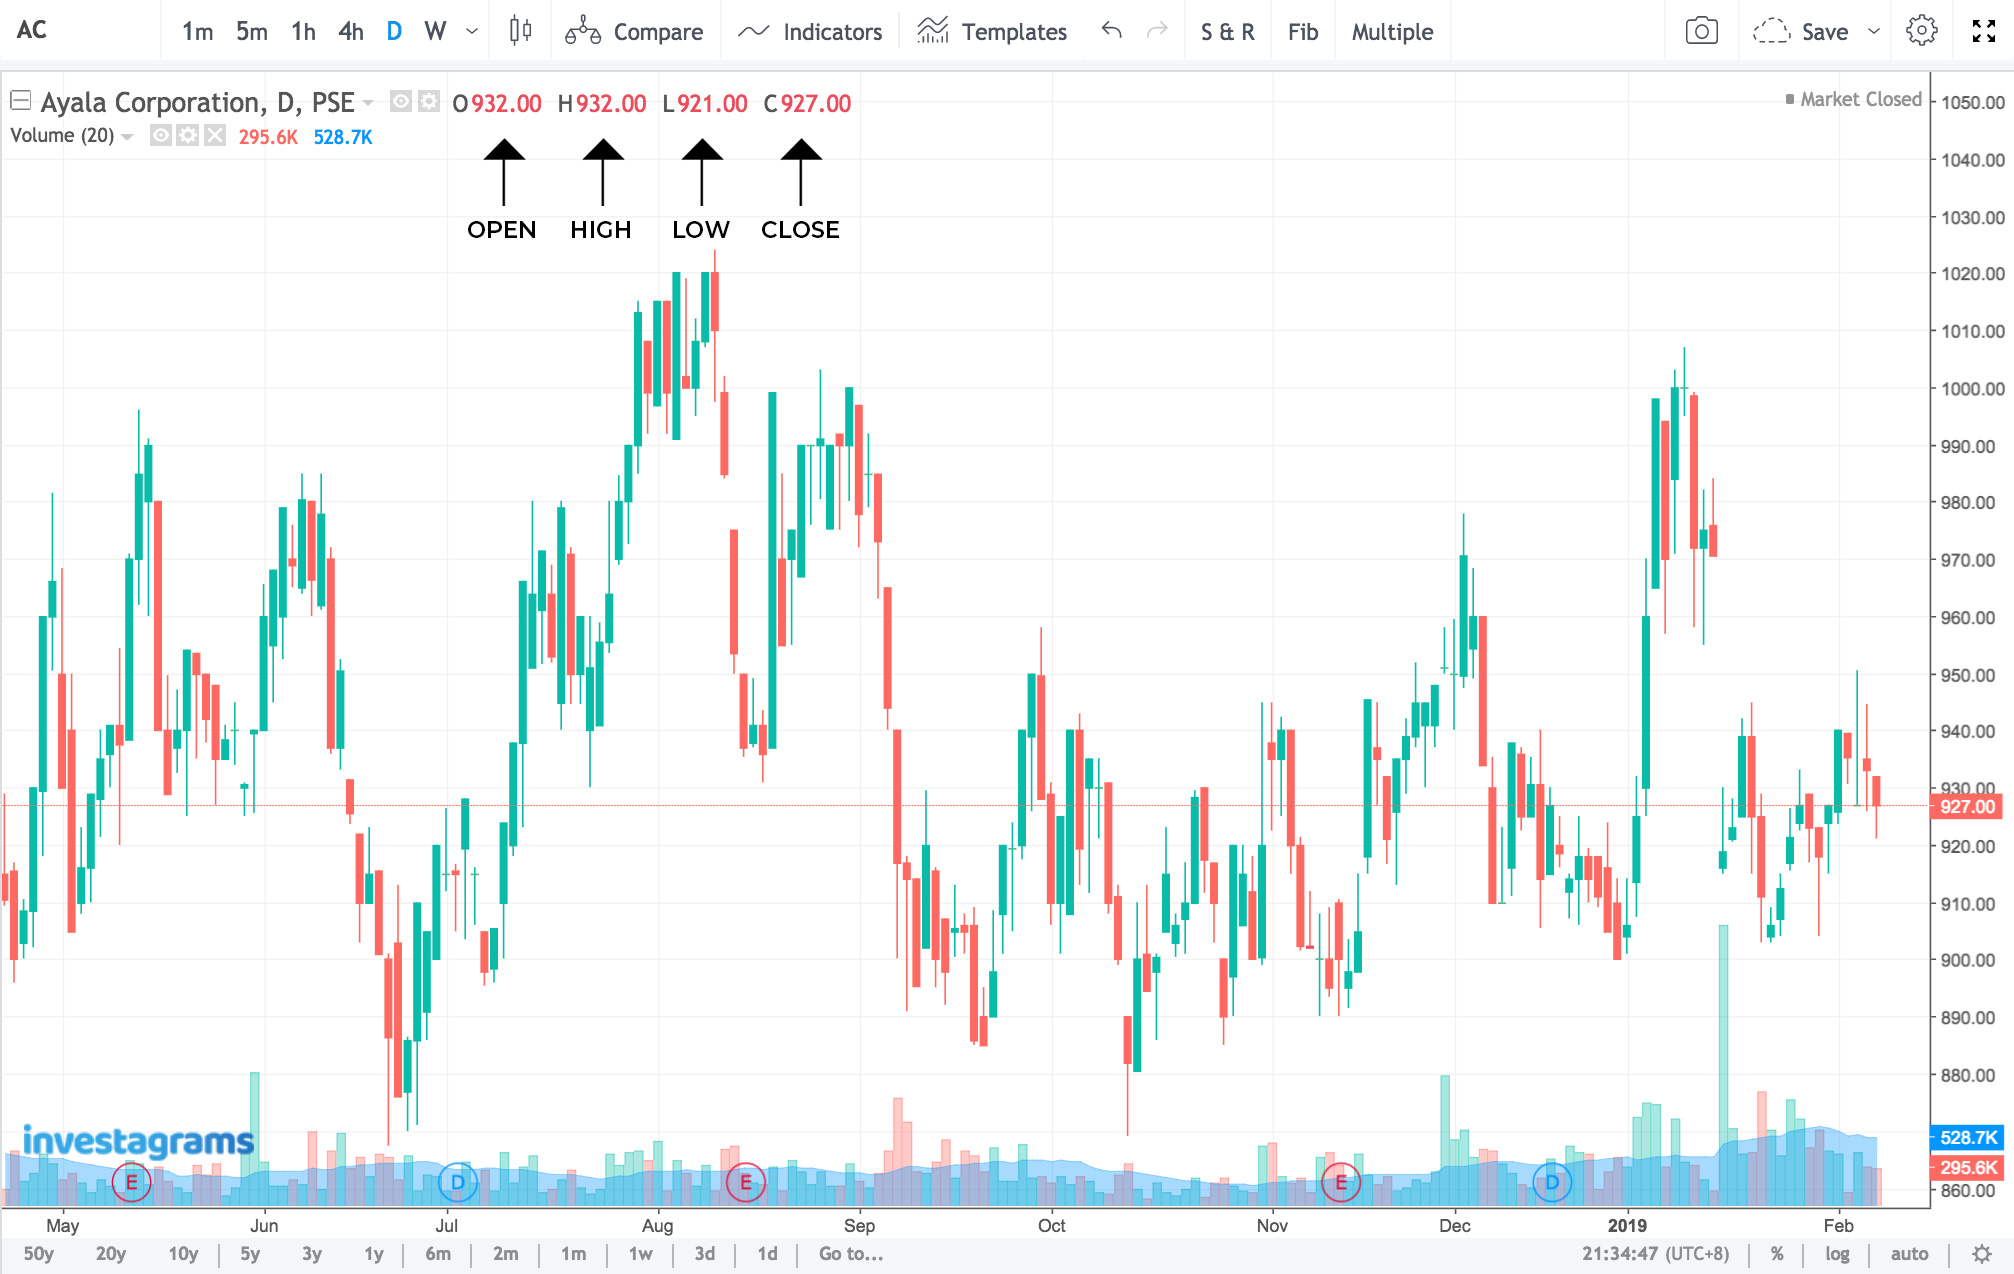
In InvestaChart, the open, high, low, and close is conspicuous. It can easily be seen on the right side of the stock’s name just by pointing your mouse over a candlestick.
Here are a few examples of basic candlesticks. The following interpretations are also indicated: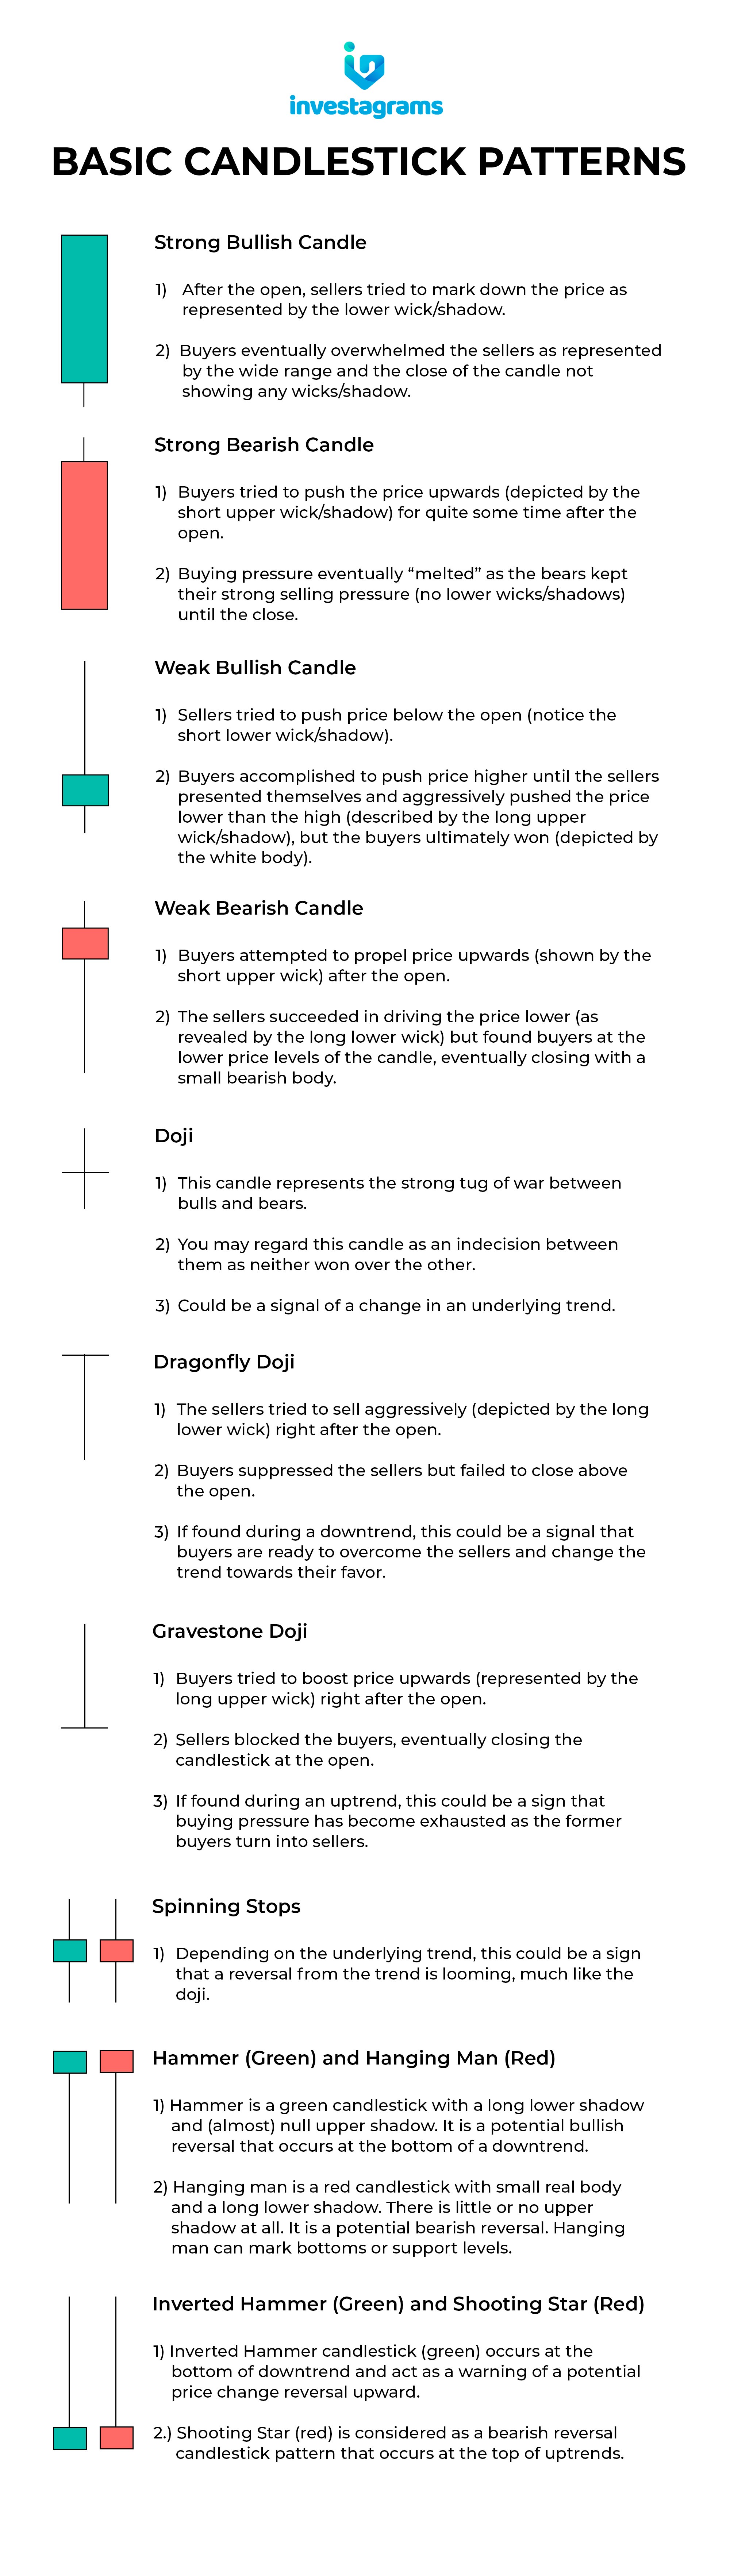 Some examples of candlestick patterns:
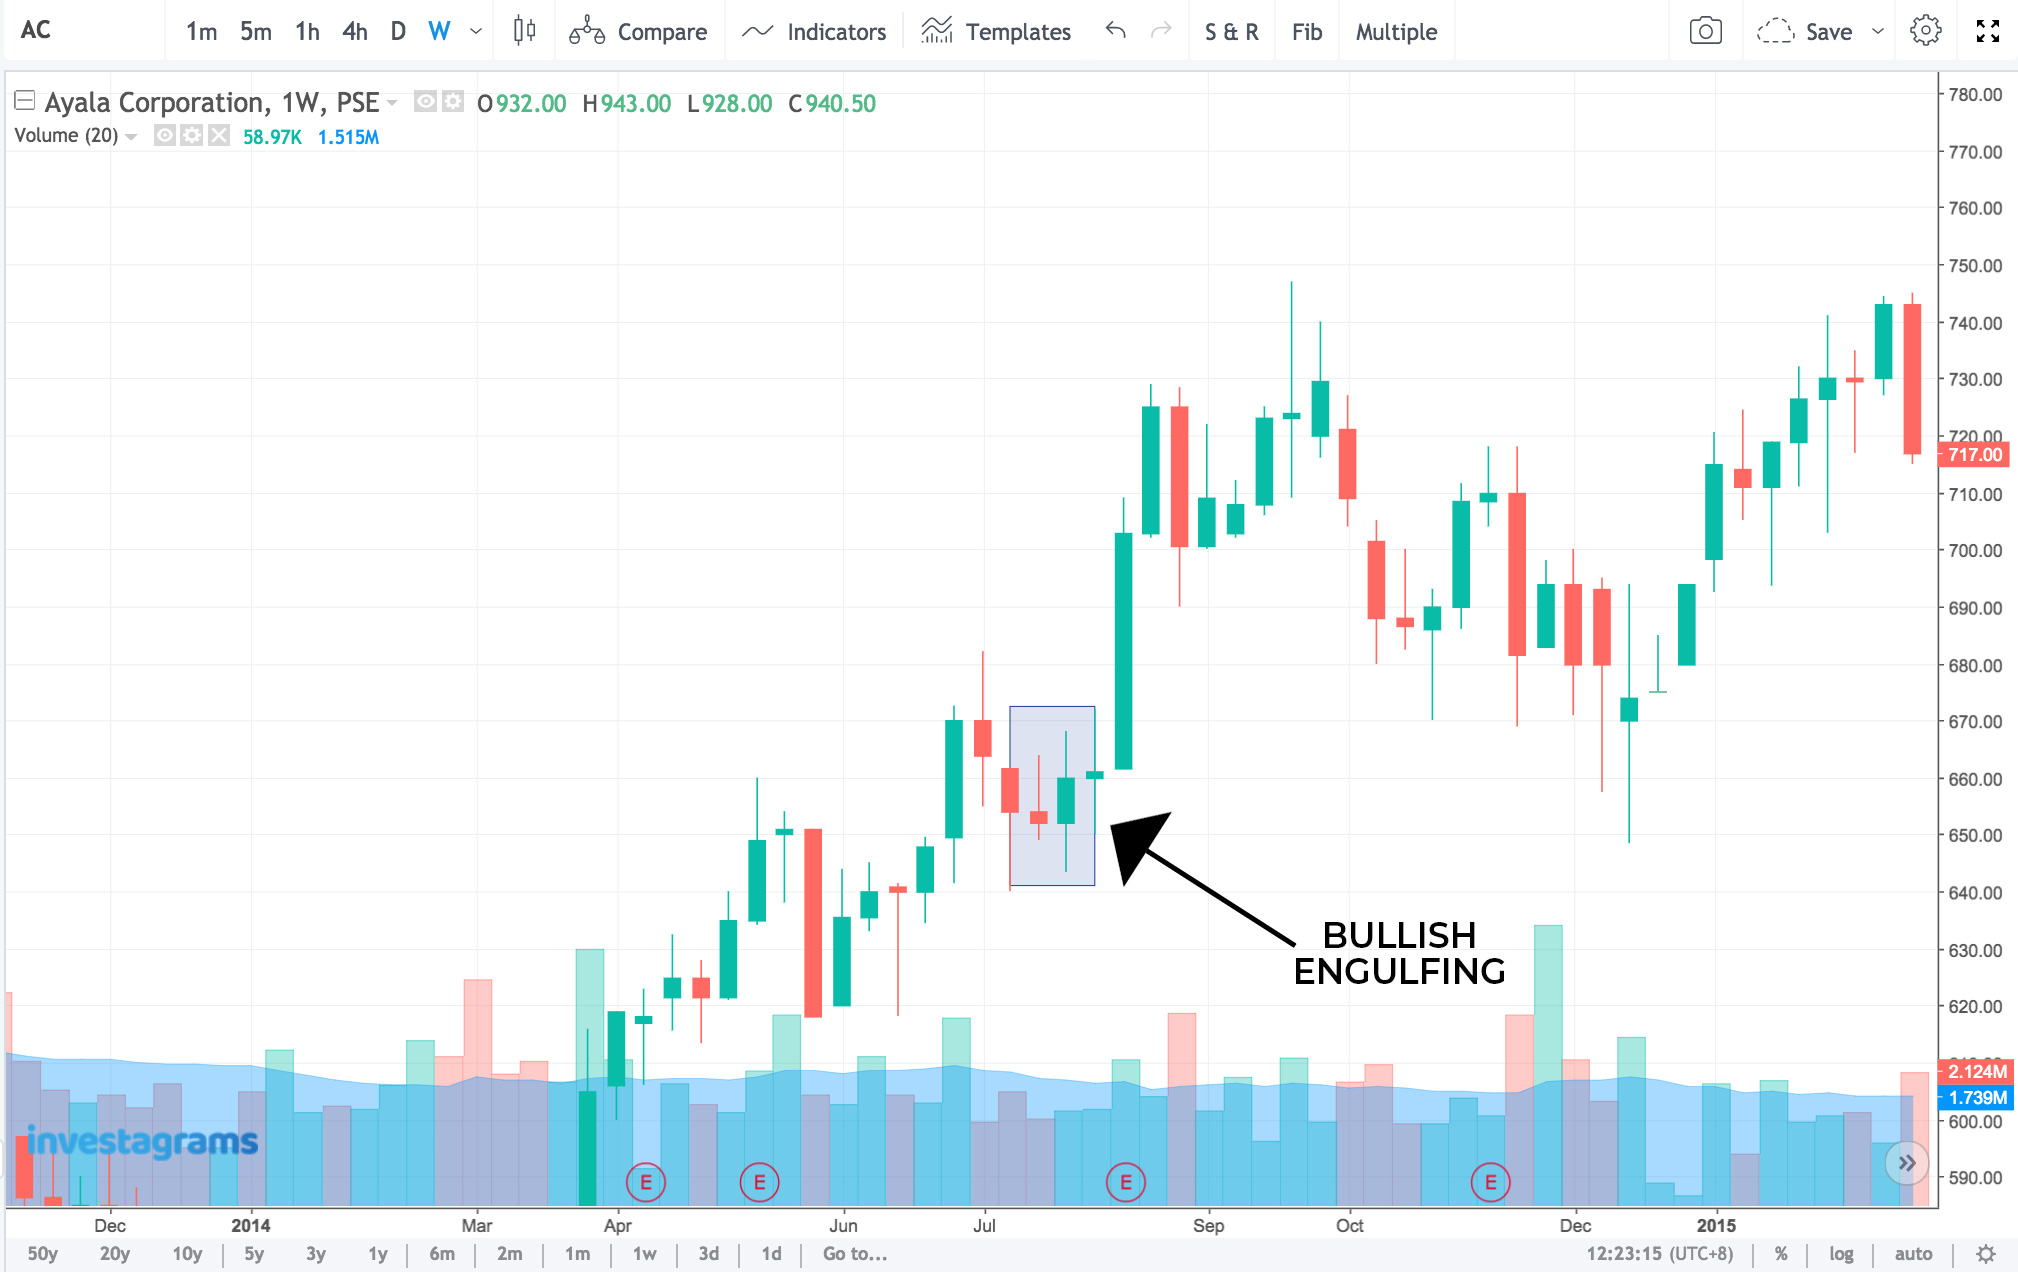
Bullish Engulfing
The candlestick pattern within the blue box in the middle of the chart is called a “Bullish Engulfing”. A bullish engulfing is a two-candle bullish reversal pattern. It happens when a candle’s body fully engulfs the body of the previous candle after a declining trend. It tells you that there’s a high chance that selling is waning down and that the buyers are now present. The next candles after the pattern shows that the buyers were indeed present.
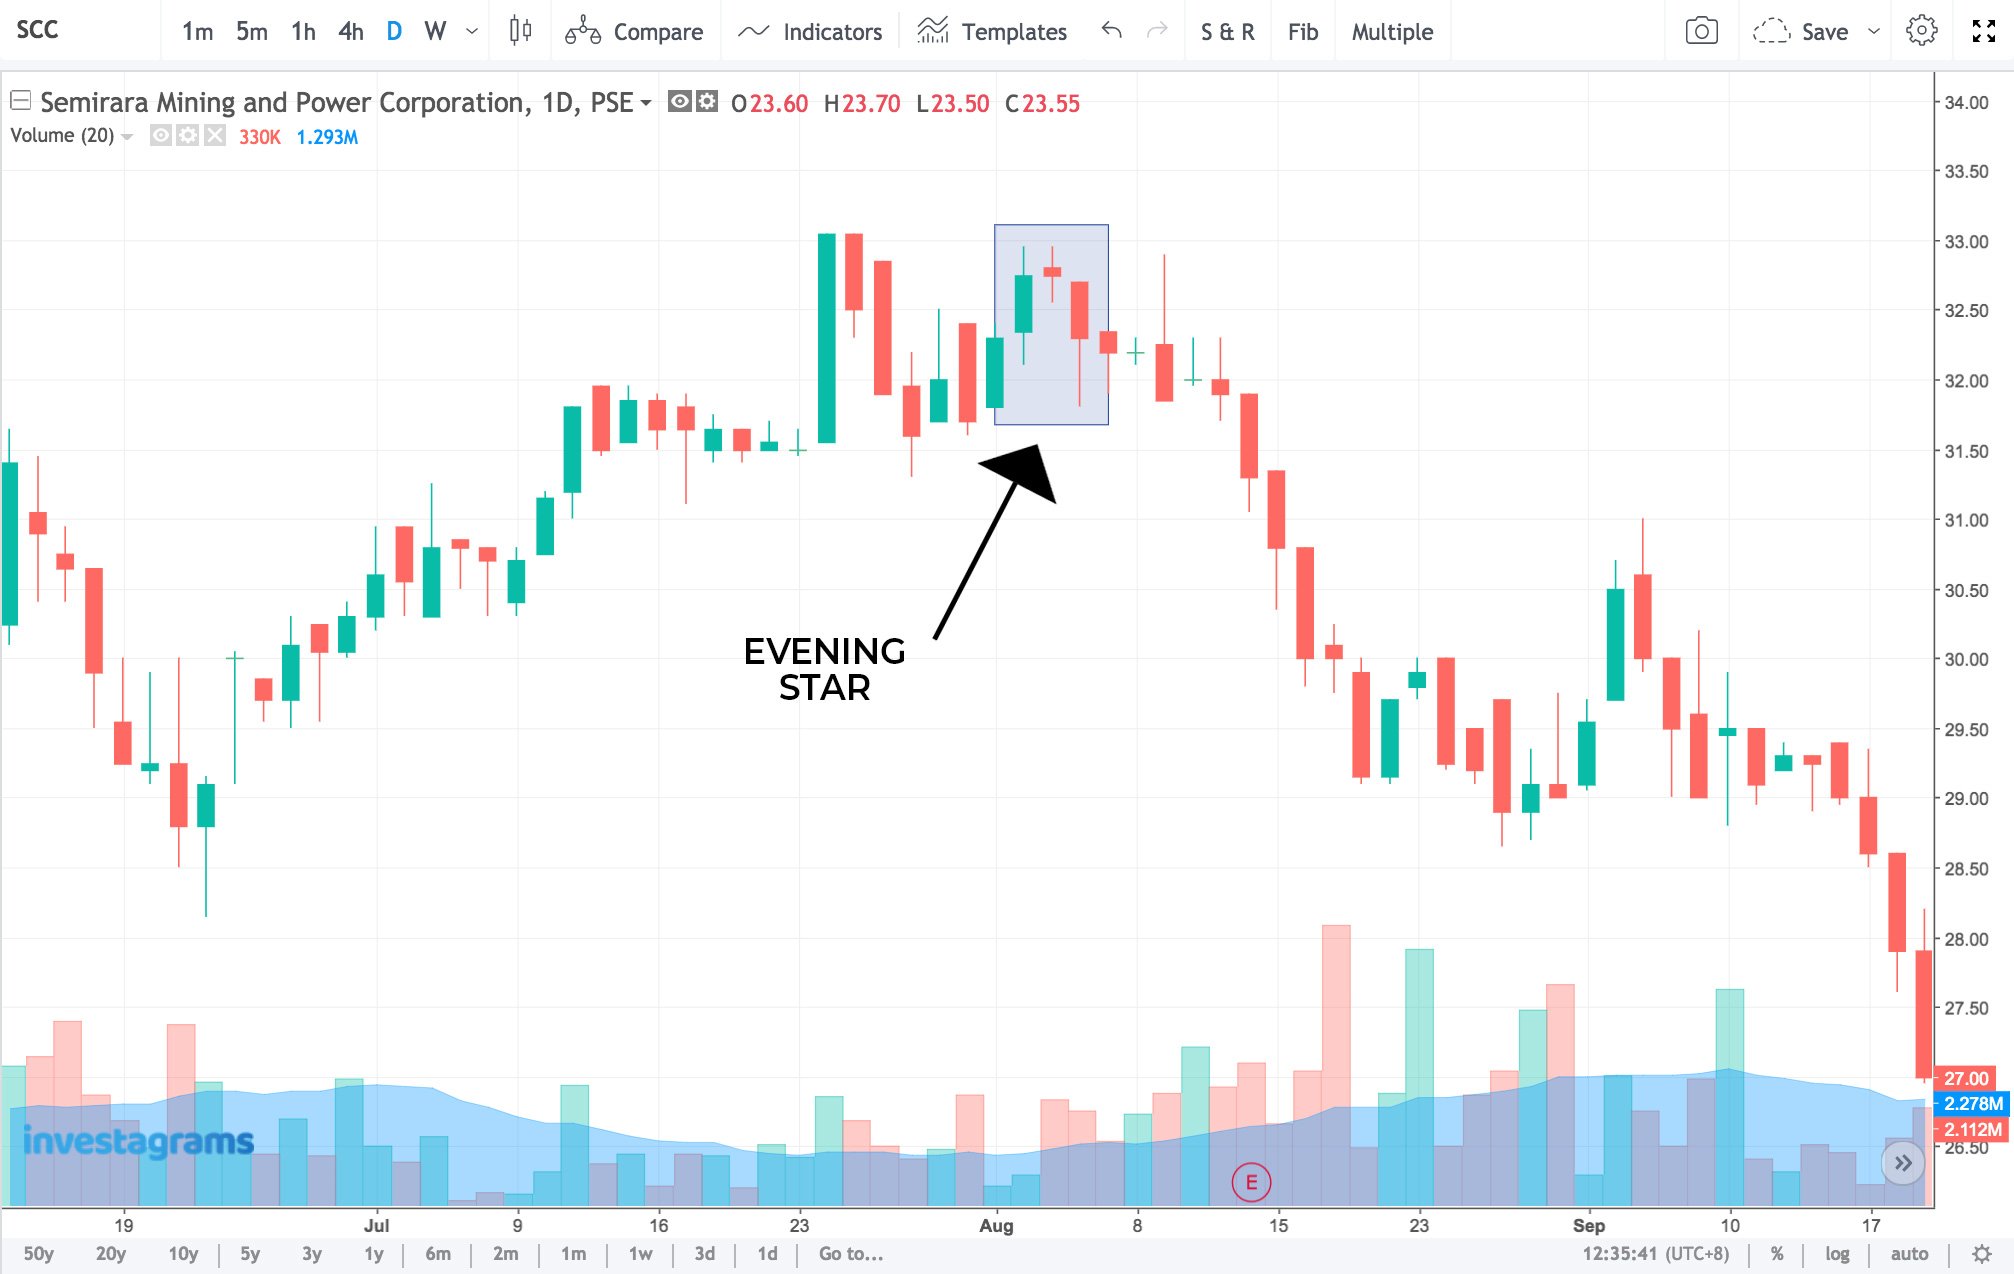
Evening Star
What you see here is the “Evening Star” bearish reversal pattern. It’s a three-candle stick pattern that involves a prior uptrend. The first candle should be strong and bullish, the middle shows weakness in the trend, while the third and last candle gaps down, making strong selling pressure felt.
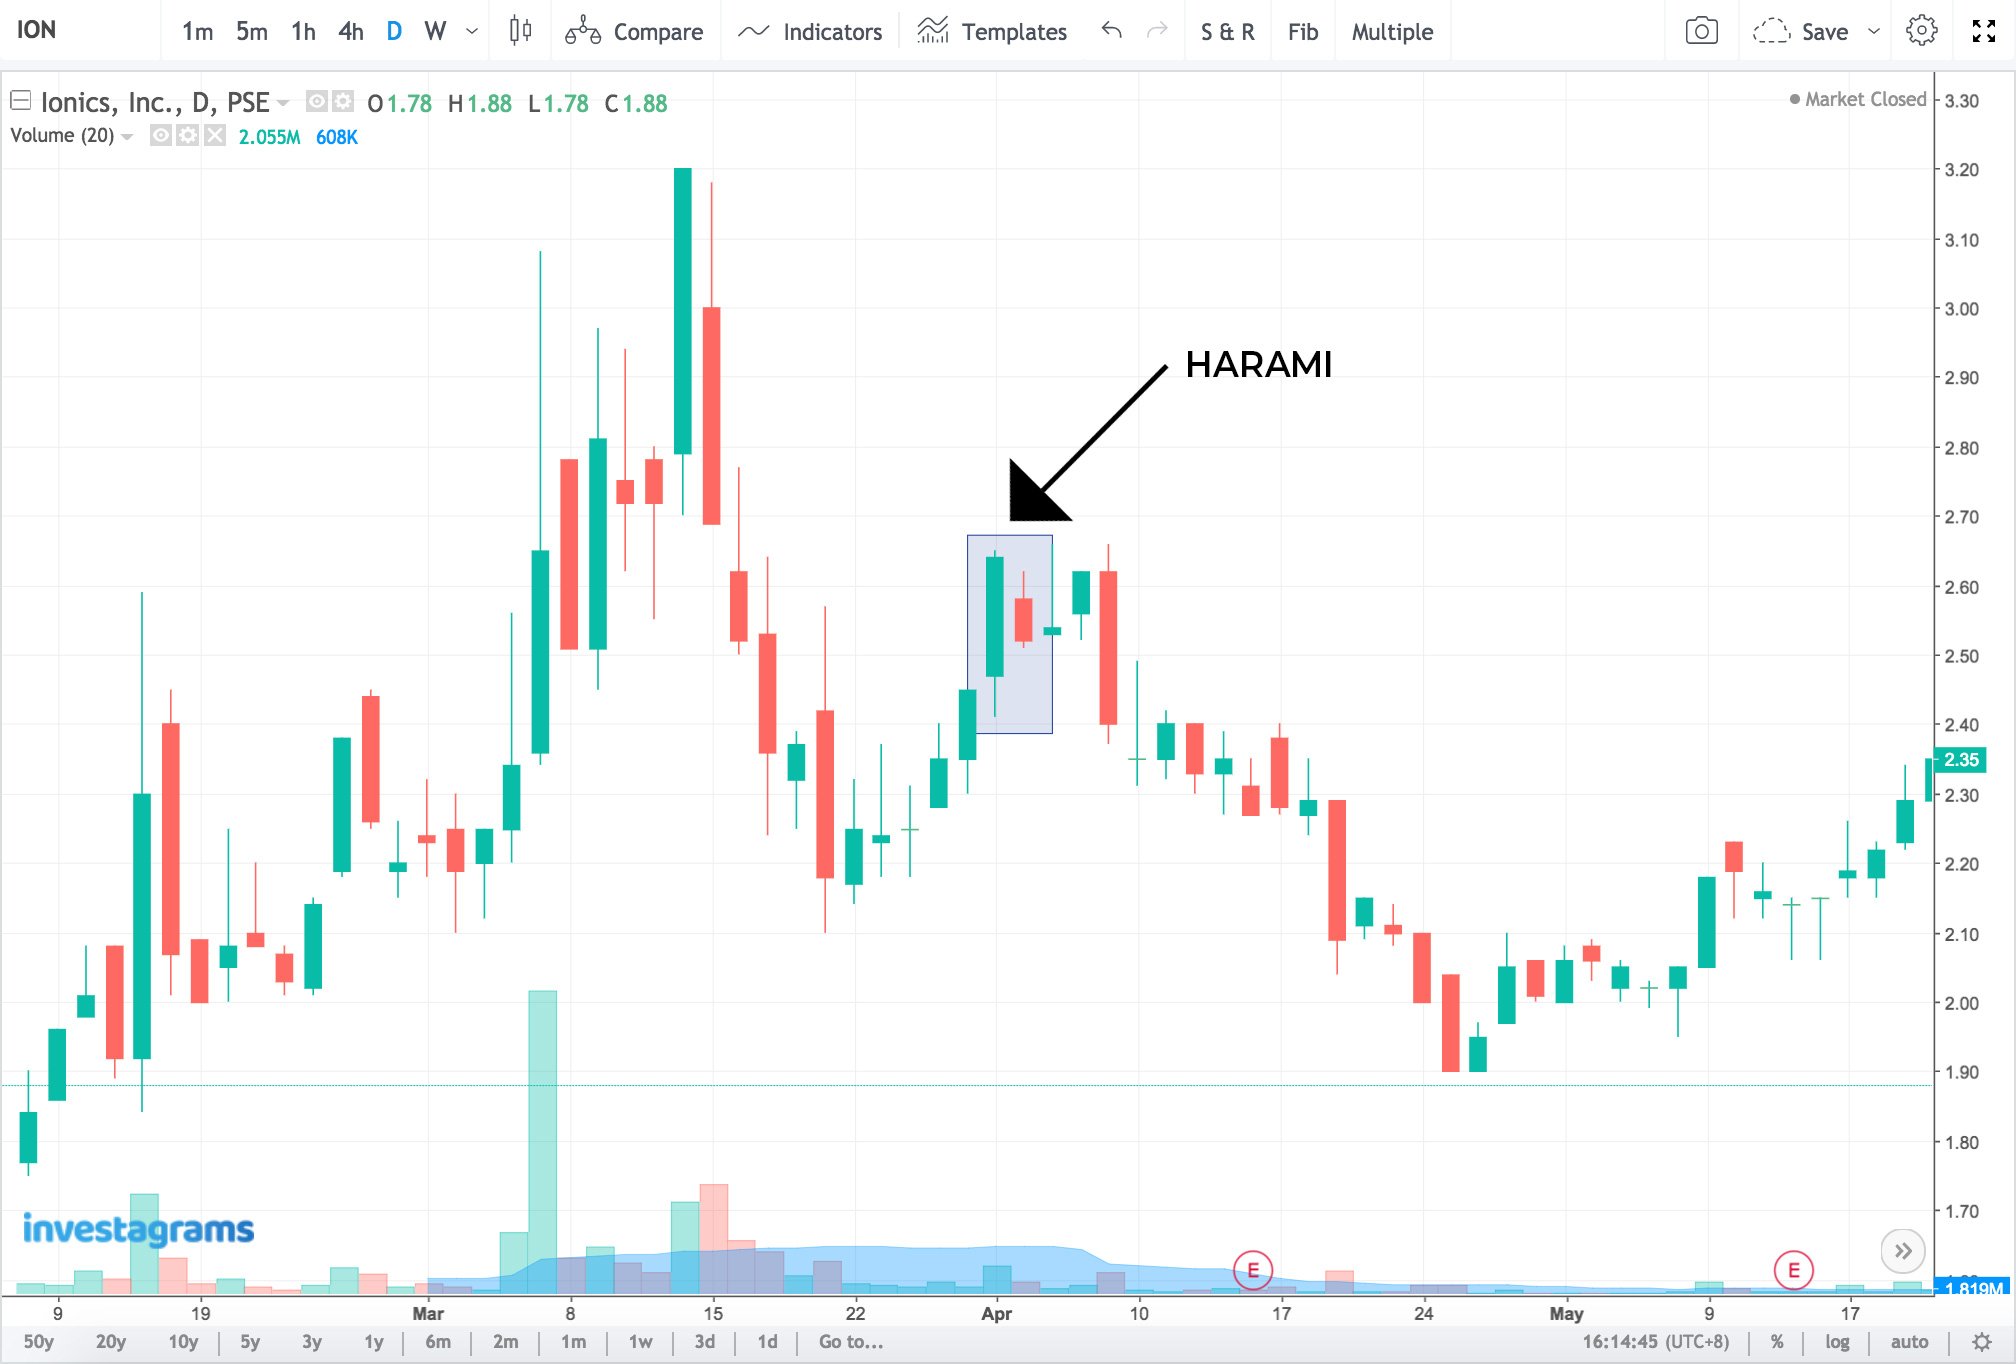
Harami
Another candlestick pattern is called “Harami” whereby the pattern will contain two candles and the second candle is smaller than the first one. The smaller candle (second) stays alongside the midriff of the larger candle (first). Note that only the body needs to be inside the first candle, the wicks are irrelevant. Generally, the Harami pattern is a sign of a changing trend and can either be bullish or bearish.
“Never invest in a business you cannot understand.” ~ Warren Buffett
There are plenty of other patterns you can trade out of candlestick formations. This can help you get in and out of your trades with confidence and prudence. Combine candlestick reading with learning how to draw support and resistances, reading trends, use momentum indicators, screen stocks, utilize a few indicators, journaling, and risk management, then you’ll be ready come up with your own trading system. Afterwards, you should be ready to trade after doing proper back testing of your setups or strategy.
Once you have trained your eyes on how to read candlesticks, charting will not be such a mundane task as before. You’ll come to the market well prepared and ready to face probabilities. And remember, always be responsible for the results of your market-related decisions and do your own due diligence.
Best of luck!