We would like to congratulate our featured trader for this week: Oneshot a.k.a @franzjion!
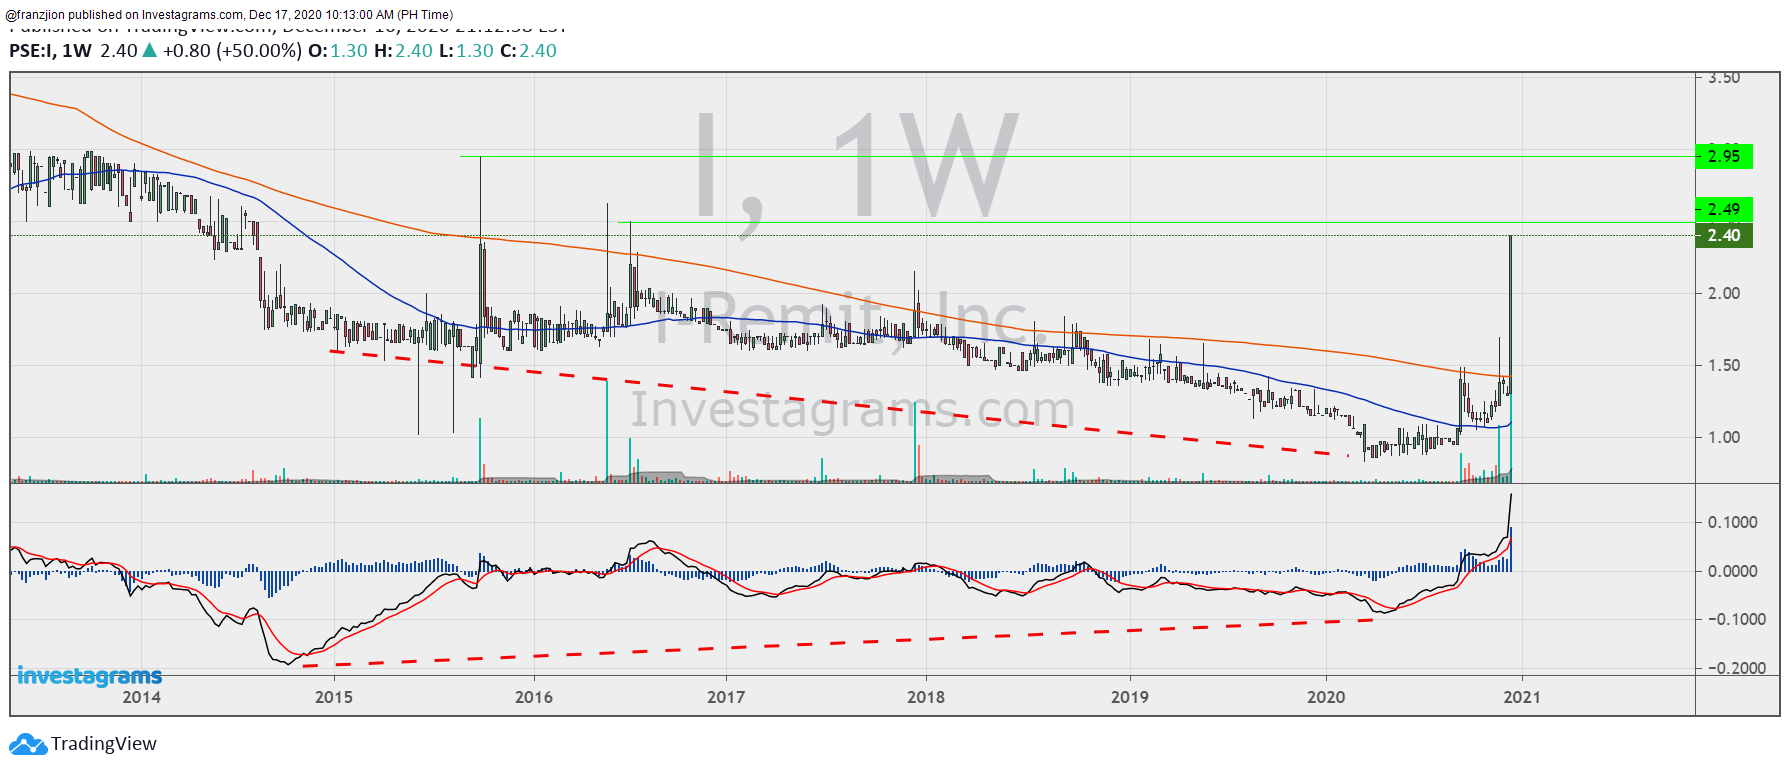
One Shot was able to eye I-Remit, Inc. a 19 year old remittance company that is one of the top here in the Philippines. One shot a.k.a @franzjion, is a deadly breakout trader who actively contributes to the Investagrams community with his expertise in using Technical Analysis to predict and time entries just before breakouts.
One shot had his sights on $I for a while before entering his position about a month ago. He skillfully used historical data since 2017 to perfectly time I-Remit’s breakout from the very strong resistance level at the 4.00 mark.
He also utilizes fibonacci levels and historical peaks to forecast possible breakout levels that can be reached. Moreover, he uses MA Cross 50 and 200 to indicate possible starting breakouts. One shot’s prediction is nothing short of skillful technical analysis as the price dipped down to the centavos before rocketing up and above the 2-peso level.
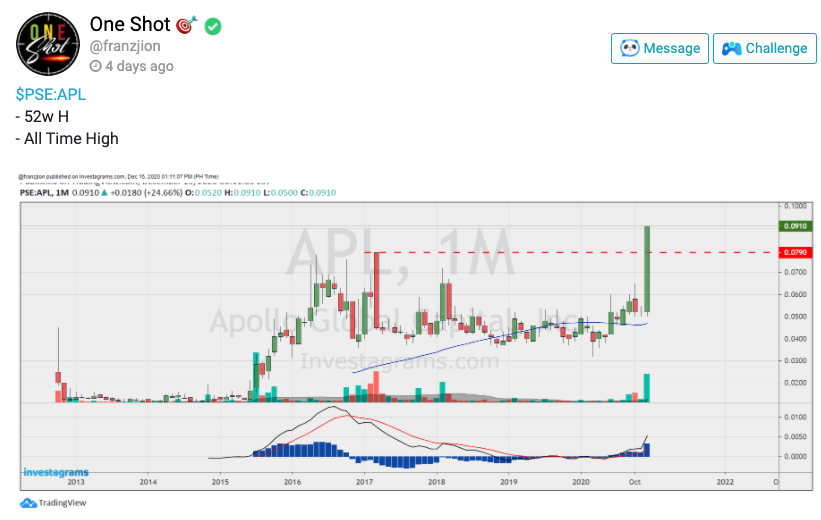
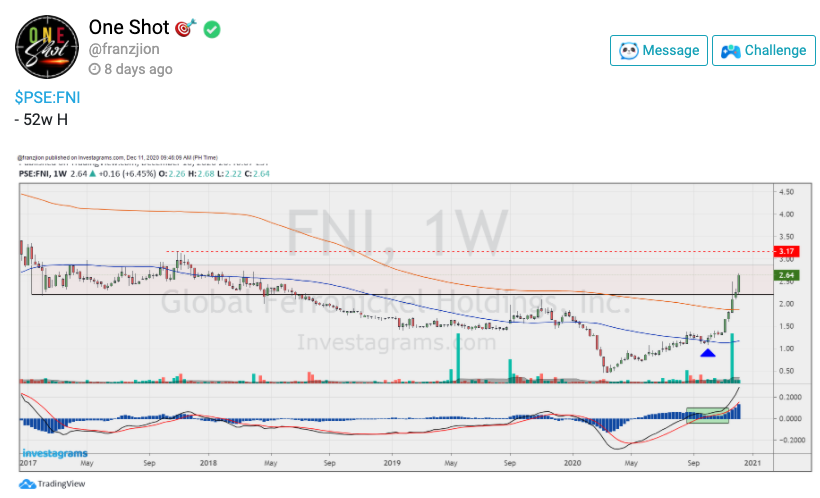
Besides $I, One shot also spotted breakouts from $APL and $FNI. He really has an eye for breakouts as his forecasts for the two are also spot on. One shot’s philosophy is all about smart positioning and entry at safe entry levels and letting the price action do the work for him.
By entering at very low and safe entry levels, he minimizes risk as the stock has nowhere else left to dip. After entry, stop losses below the support level is set, with Take Profit levels around the Fibonacci levels he plotted. Trail stops are then implemented once the initial Take Profit level is reached, ensuring a risk free trade with unlimited upside potential.
One shot is lethal with Technical Analysis in spotting breakouts, but he is nowhere near lacking in Fundamental Analysis. Fundamental Analysis is crucial for One shot to be one step ahead from other investors and entering a trade before a breakout. One shot displayed his Fundamental Analysis skills with $APL as he extracted news to support his prediction.
Congratulations to those who were able to profit from breakouts of $I, $APL, and $FNI, and kudos to One Shot a.k.a @franzjion. Your FREE 1-Month InvestaPRO is on its way!
As of this writing, the local index created a continuation pattern that isn’t pleasing as the price action proves otherwise. Although, the reverse will be true if the local barometer manages to breach the 7200 levels that may serve as leverage to propel its way upwards.
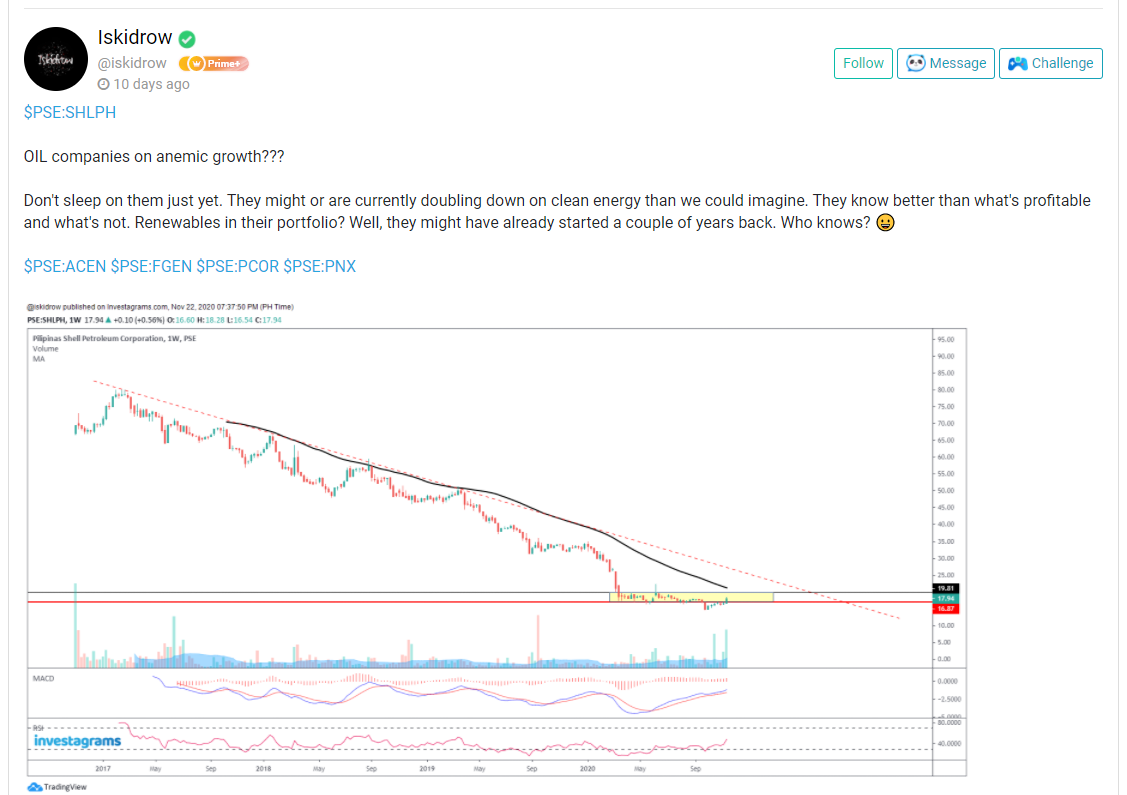
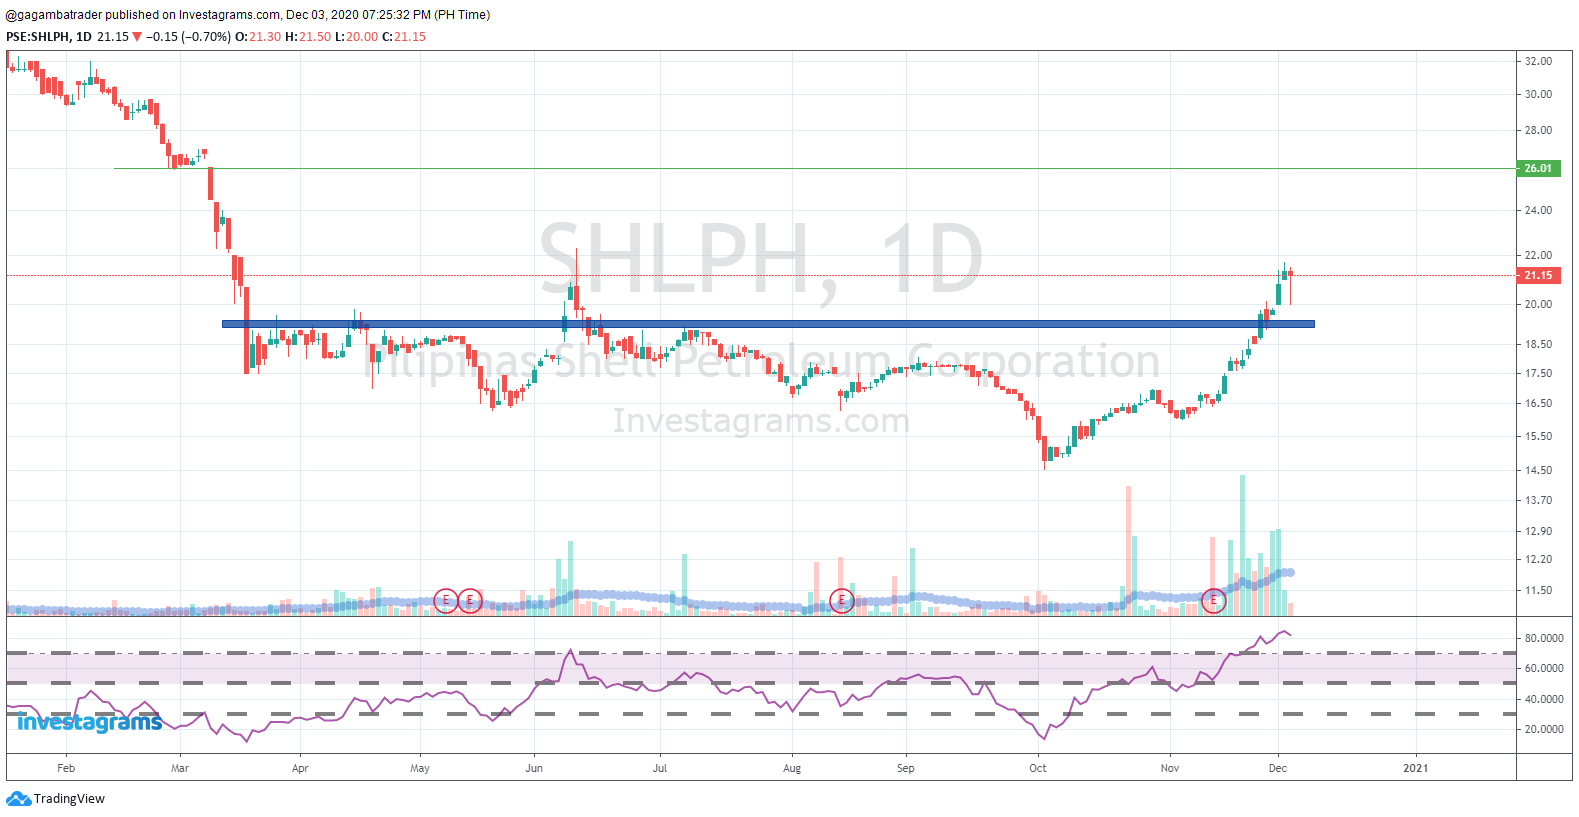
Along with this, numerous names have emerged and one of which is Pilipinas Shell Petroleum Corporation or $SHLPH. Iskidrow (@iskidrow) successfully traded the stock before his analysis. This trader is an active member of the Investa community who boundlessly delivers his breakdown of local stocks with the use of Technical Analysis.
This trader specifically highlighted the bigger picture play that recently materialized. The said stock managed to break the 19-peso structural resistance of the said underlying base that had a build-up of 9 months prior to the breakout. The said consolidation pattern was supported with below-average volume, although before its initial move, it is seen that its volume was picking up.
The initial breakout was also supported with massive volume, along with the RSI (14) 70 breach, which indicates that the stock is currently in a parabolic state. The stock must maintain the 19 to 20-peso levels to further proclaim its stance.
Moreover, it is a low-risk, high-reward trade, as the stop loss levels for the said breakout point of the consolidation pattern is around 18.5 (-5.3%), and the take profit areas could be the structural resistance at 24 to 26-peso area (23% to 33%).
In the bigger picture, it is observed that the stock is badly beaten. For a reversal to occur, the stock must rebreak and hold its previous 52-week high levels. Else, its down move may still occur. Although note that the price targets are merely based on technicals, which means that we must be prepared whenever the stock goes against our bias.
Congratulations to those who were able to maximize $SHLPH’s big up move. Lastly, kudos again to Iskidrow (@iskidrow) for sharing his trade analysis. Your FREE 1-Month InvestaPRO is on its way!
Never Miss A Moment with InvestaWatcher+ Alerts! Experience it for FREE. Click on the photo to get your FREE 14-DAY ACCESS!
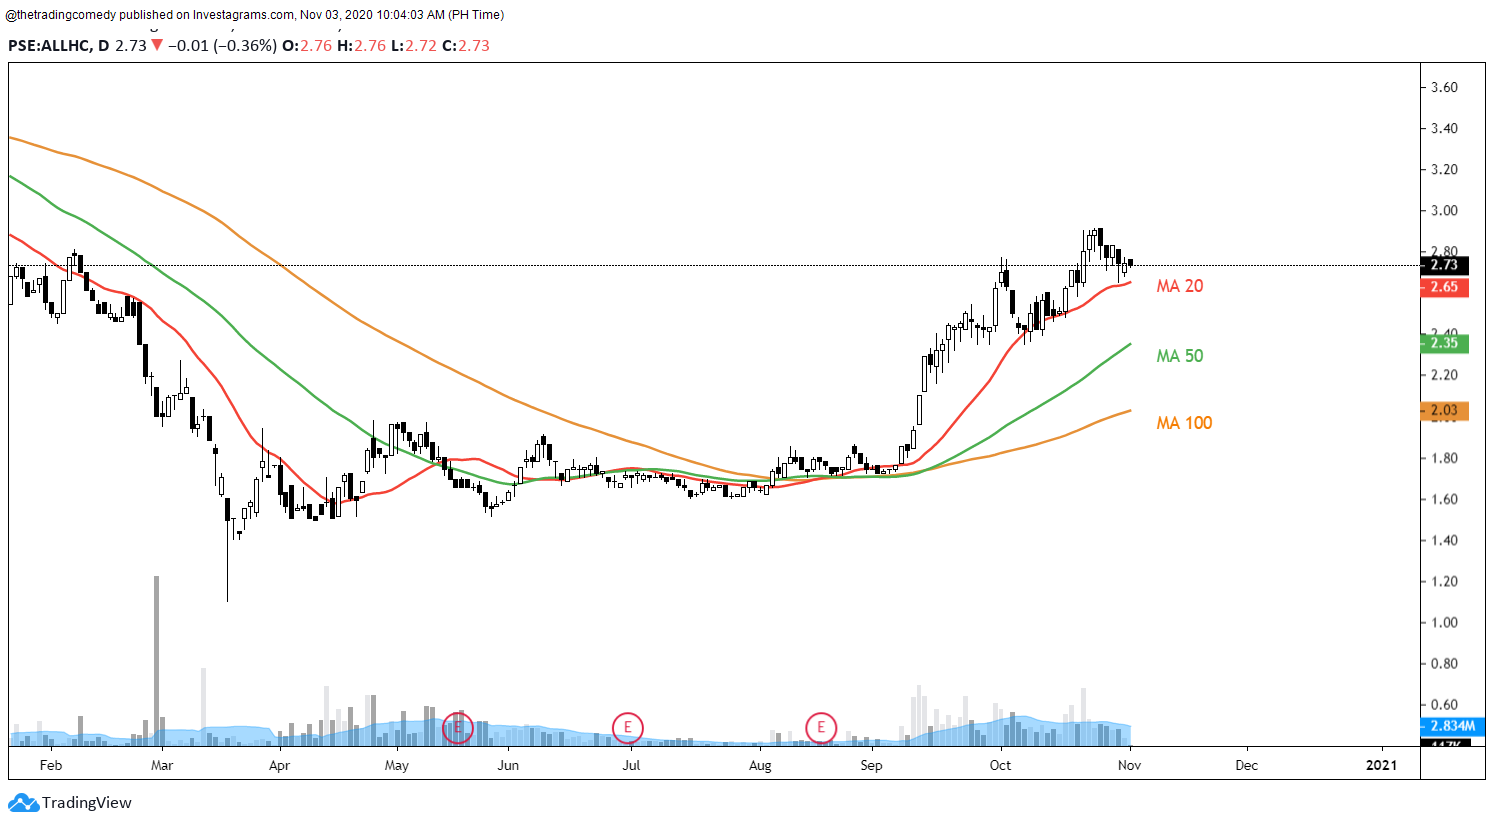
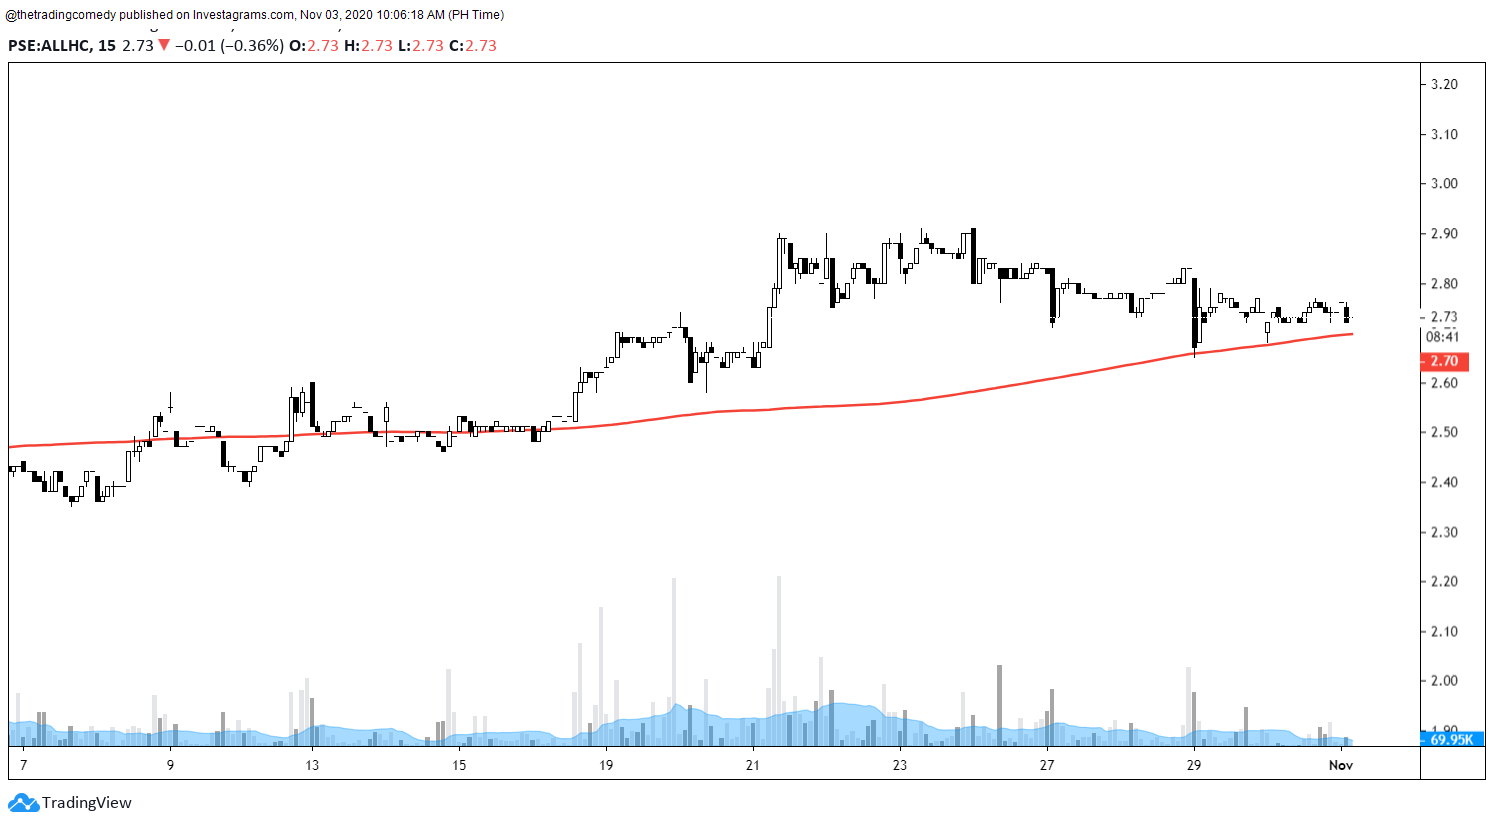
First, I’m going to tell you right off the bat after reading this you might get inclined to getting rid of the usual Moving Averages that you would use in your chart view.
So instead of looking at all of these lines in one chart…
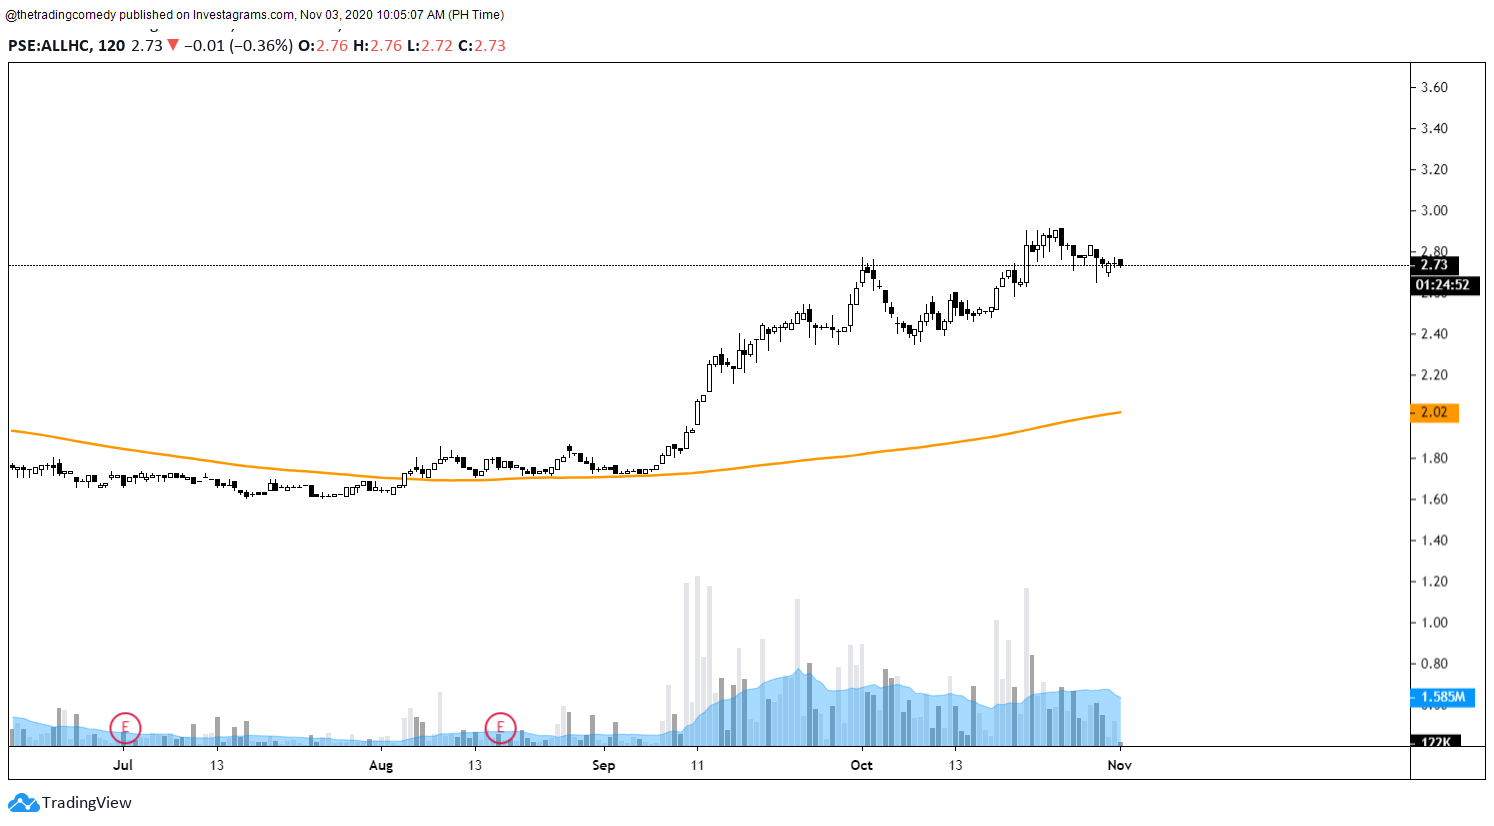
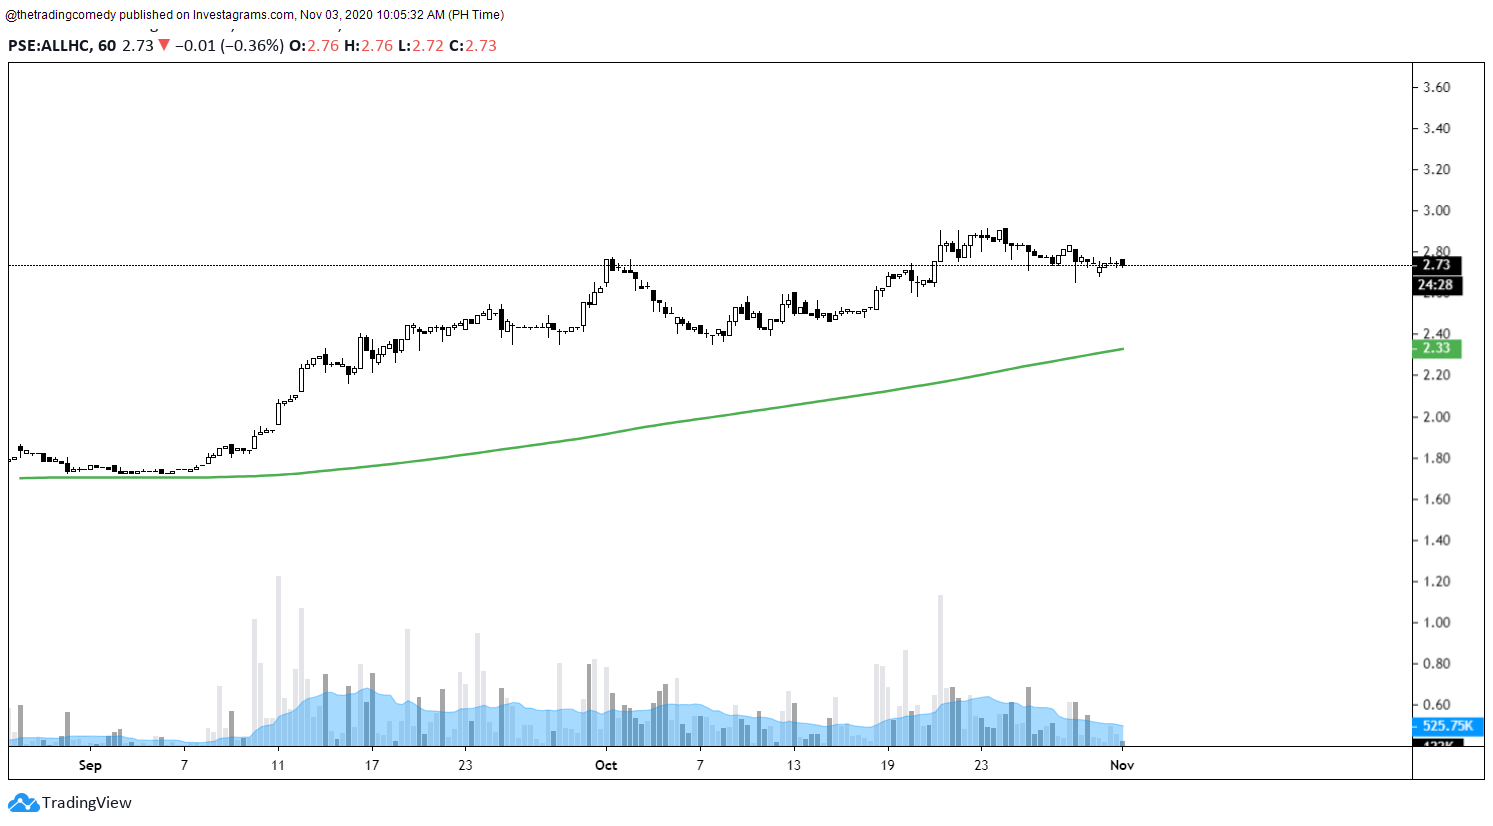
We’ll break it down into time frames using only one Moving Average. This way, you get a clearer picture on how you would approach a certain trade and you can confidently approximate how long you will hold on into that certain stock.
If you try to go back to the first picture of this post you would observe that each colored line is almost identical to each other.
Why breakdown a chart into more time frames when the Daily is already enough?
I know some of you would already ask this question. Let me share to you a typical scenario that I would always encounter whenever I traded using only the Daily time frame. Some traders can fall for this trap as well.
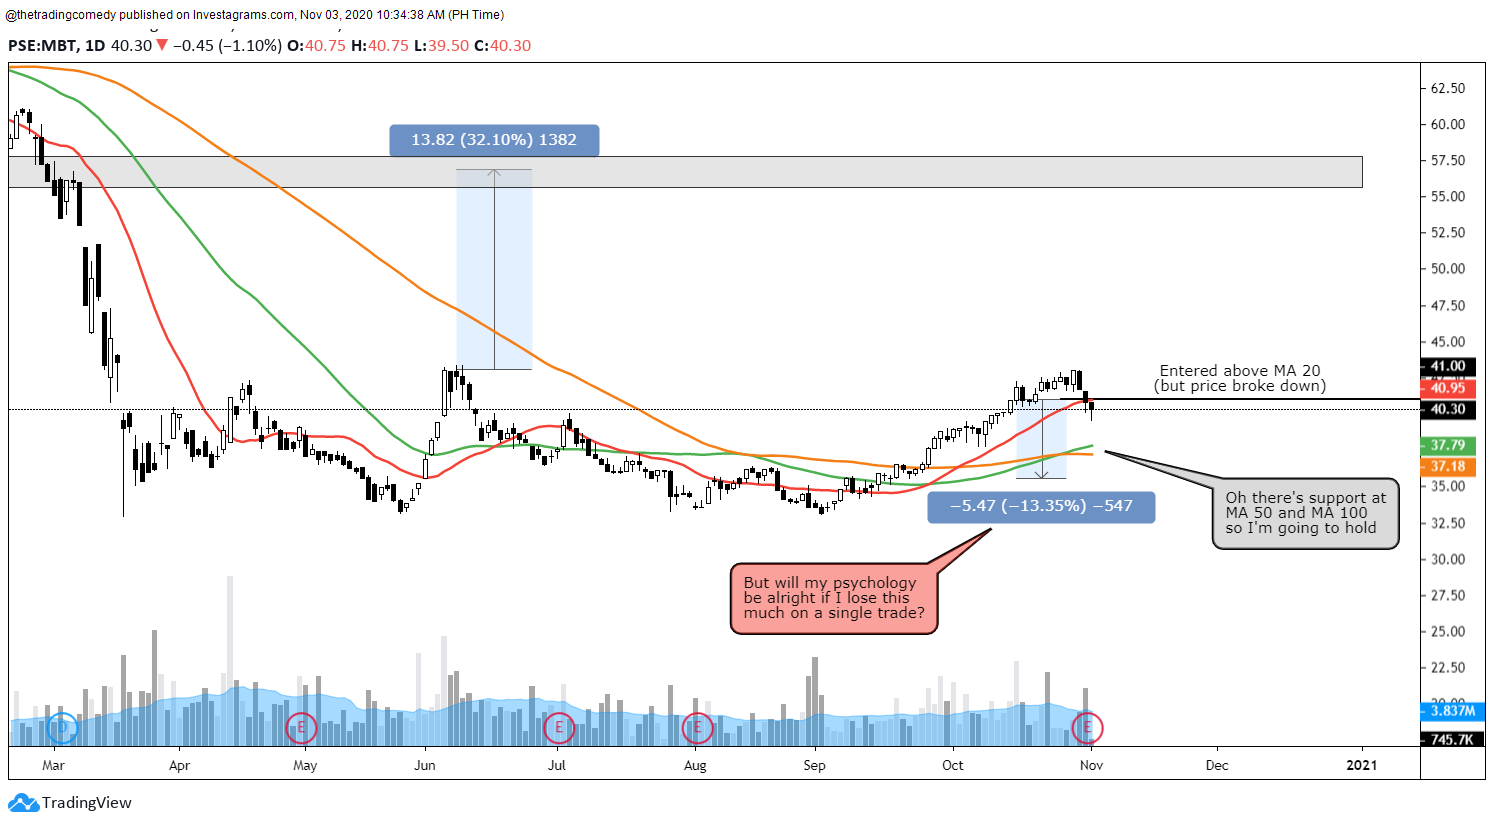
The chart above is an example of a simple trend following strategy wherein you buy above the MA 20 (red line) and say you only have a risk tolerance of 5% to 7% per trade.
However in this case, the price broke down MA 20. But because the MA 50 and MA 100 are acting as a dynamic support and the last candlestick is giving you a hint of hope that it might bounce because of the wick, you suddenly decide to hold without realizing that you could potentially lose 8% to 13% in the process.
Aside from checking if your psychology would be alright with the scenario, you should also check if it’s worth the time to wait for your trade plan to materialize or should you move on and look for stocks with a trade plan that has a shorter time to materialize .
From a trend follower’s perspective, there are times where you’ll get tempted to hold longer that you lose your awareness that you are already beyond your risk threshold. The worst thing that you could do is cling to that false hope that the price would hold above your remaining moving averages
Should you want to proceed with fully immersing yourself in line charts with the possibility of “unlearning” candlesticks in the process (because yes they generate a lot of noise too if you think about it), then this guide is for you.
We will talk about the only Moving Average that you’ll only need especially if you’re the type who has the tendency of switching time frames —the 200 period average!
What time frames to analyze when screening stocks?
From a line chartists perspective, we approach moving average screeners differently compared to the candlestick chartists wherein they can just use the Daily time frame to plan their trades in most cases.
Also, there are times that we can get impatient whenever we look at a higher time frame praying that the price should move quickly.
If you’re looking at a Daily chart, align your expectation to that time frame and DON’T LOOK AT ITS BEHAVIOUR LIKE A 5-MINUTE CHART! (unless there is momentum)
To solve this time frame anomaly, we’ve tabulated these time frames to set your expectations as well as making your time frame jumping easier (more about this later) — and you don’t even have to show the other Moving Averages in your chart view as long as you memorize these by heart whenever you’re looking at a specific time frame:
Time frame (w/ SMA/EMA 200)
Daily SMA/EMA Counterpart
2 hours
100
1 hour
50
15-minutes
20
5-minutes
10
So when filtering your stocks whether it be by 20-day, 50-day or 100-day moving average, you already have an idea which time frame to look at whenever you want to analyze some stocks regardless of the time objective.
Personally, I don’t use the 2-hour timeframe or the 5-minute time frame but if your trading system involves using a Daily 10-period or 100-period moving average then feel free to use the time frames.
Additionally, you will also have a rough idea of how long you’ll probably hold on to that position and yes, we also roughly estimated it for you so you know what to expect (at least based on my trading experience)
Time frame (w/ SMA/EMA 200)
Estimated Holding Time
Daily
Weeks to Months (or Years)
Hourly
Days to Weeks
15-minutes | 5-minutes
Minutes to Hours | Hours to Days
200 in action!
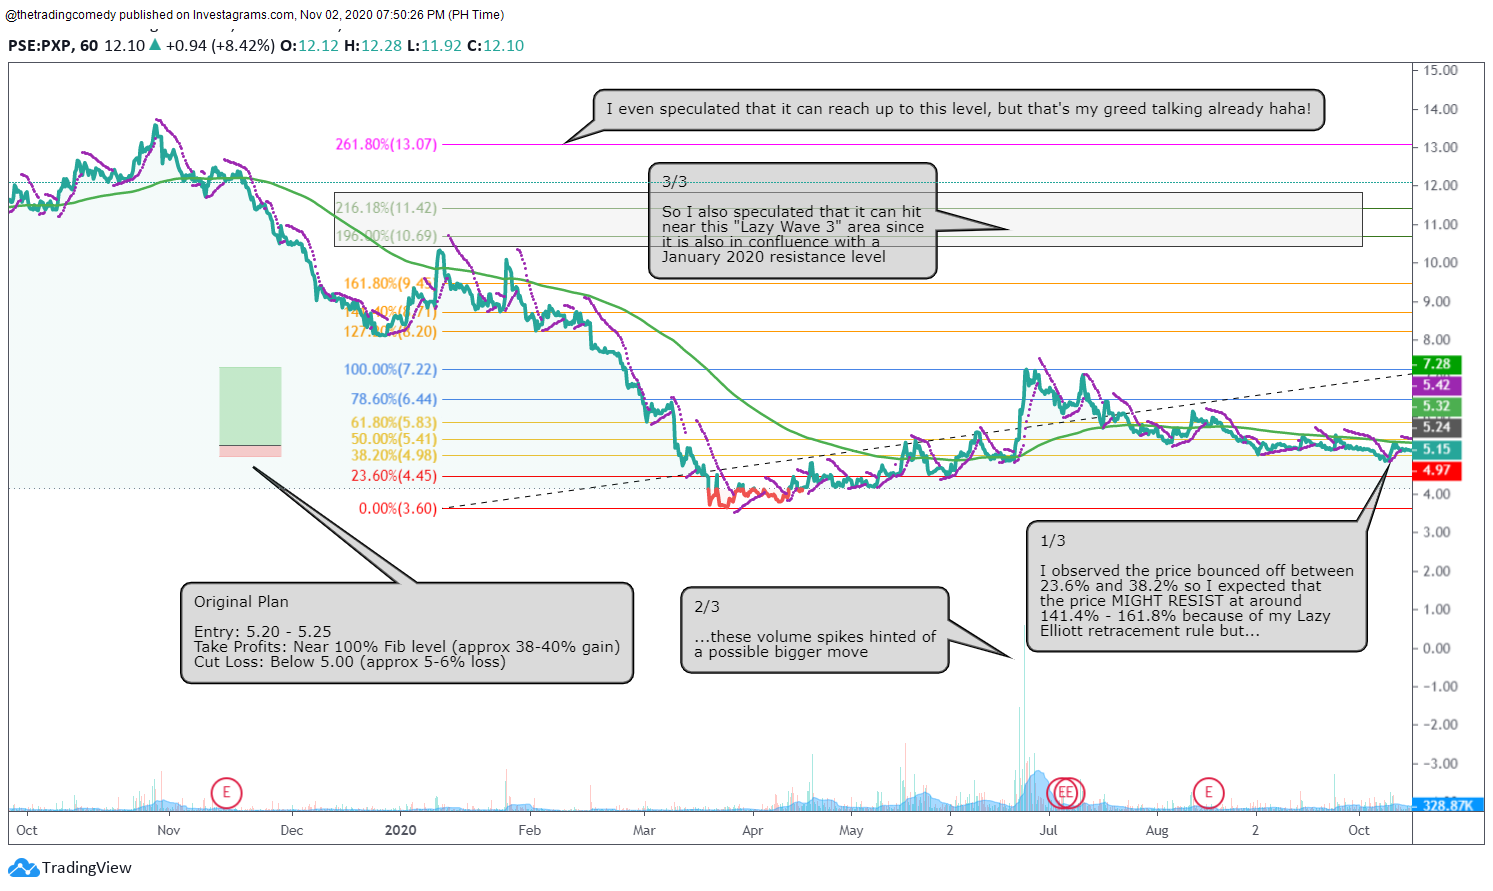
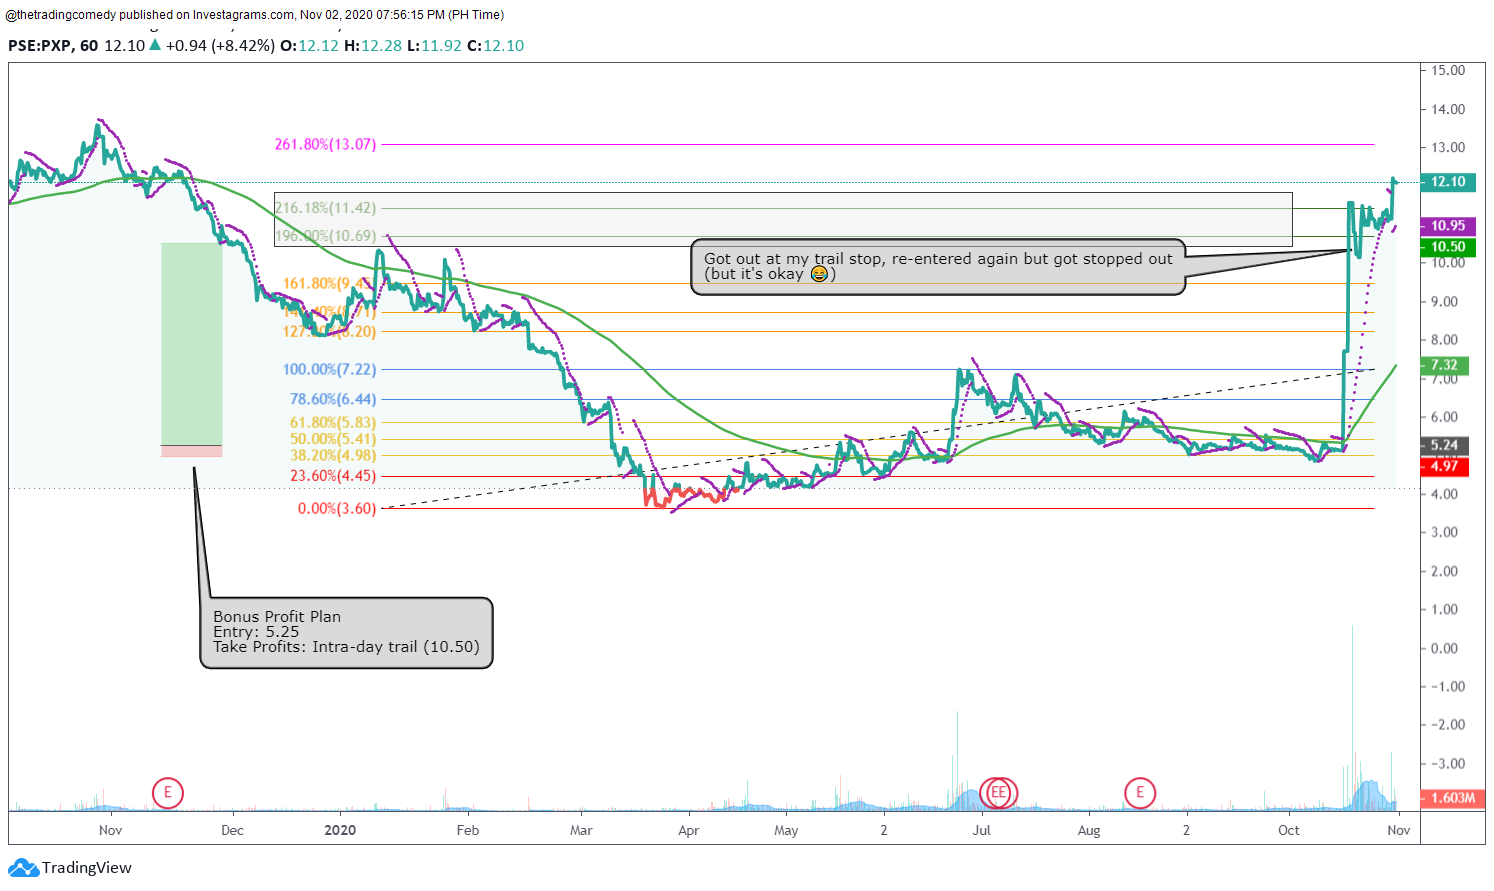
Let’s take a look at an example. Here’s a recent trade that I attempted using only the Hourly time frame with an EMA 200 and Parabolic SAR (also consult the estimated holding time and the expected Daily counterpart on the last table)
$PXP Hourly Chart w/ EMA 200 (EMA 50 view at the Daily) + PSAR
With my noted estimated holding time, I did not have to guess on how long I will have to wait for the trade to materialize given the conditions.
But I know some of you will ask why I still entered despite the EMA 200 and PSAR showing downtrend signals. This is where the art of switching time frames comes into play!
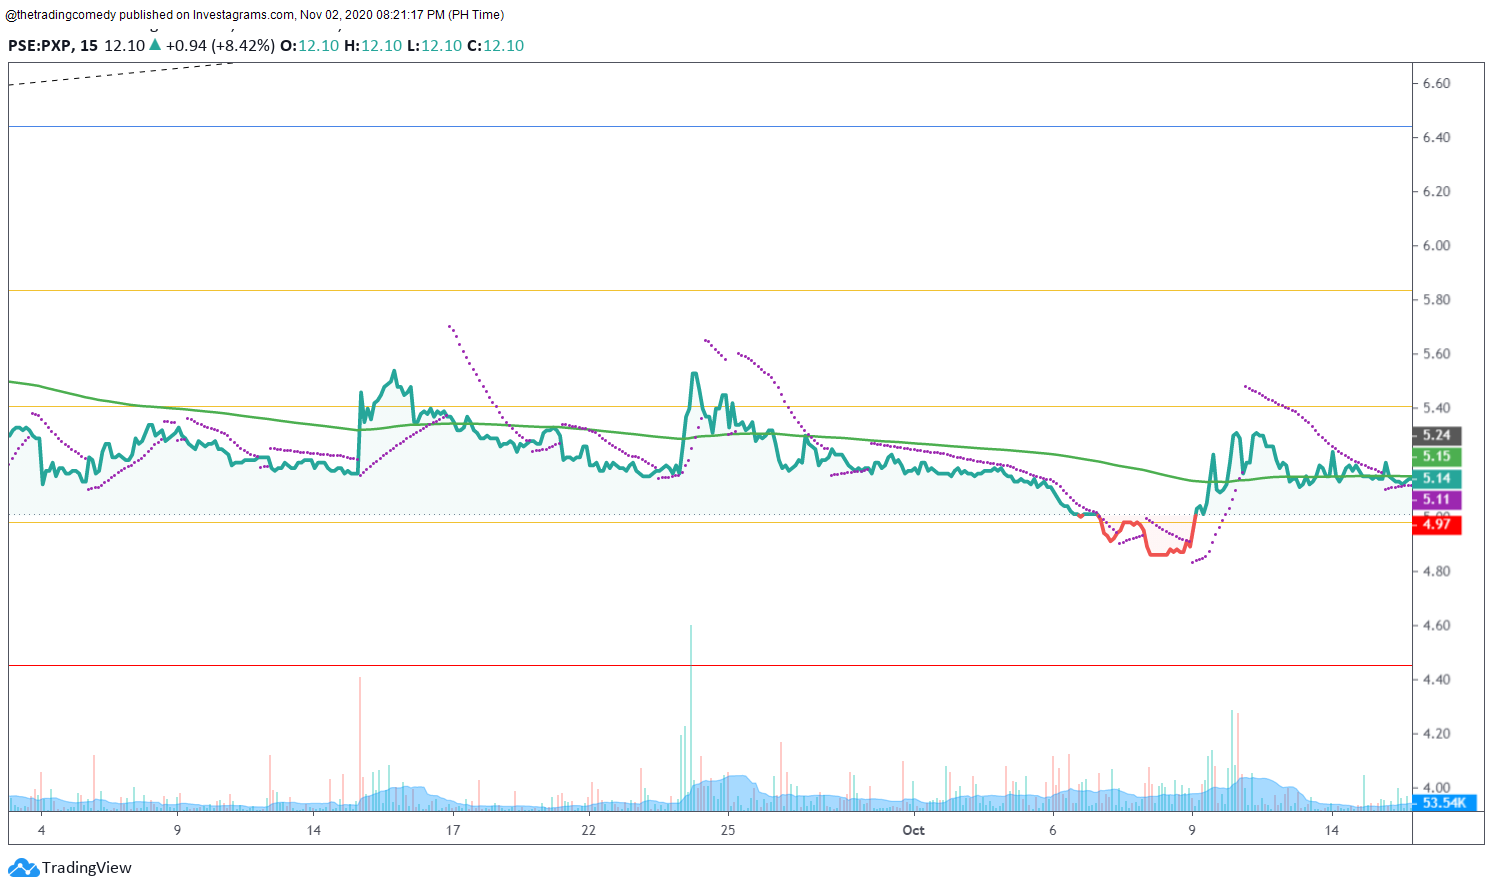
I switched to a 15-minute time frame (or my “Daily MA 20 view”) to check if there is an early opportunity to enter the trade and I saw this PSAR made an uptrend signal which convinced me to enter.
Don’t worry about the time frame switching for we’ll cover it in depth in our next post. Anyway, going back to the trade, here’s what happened after a few days…
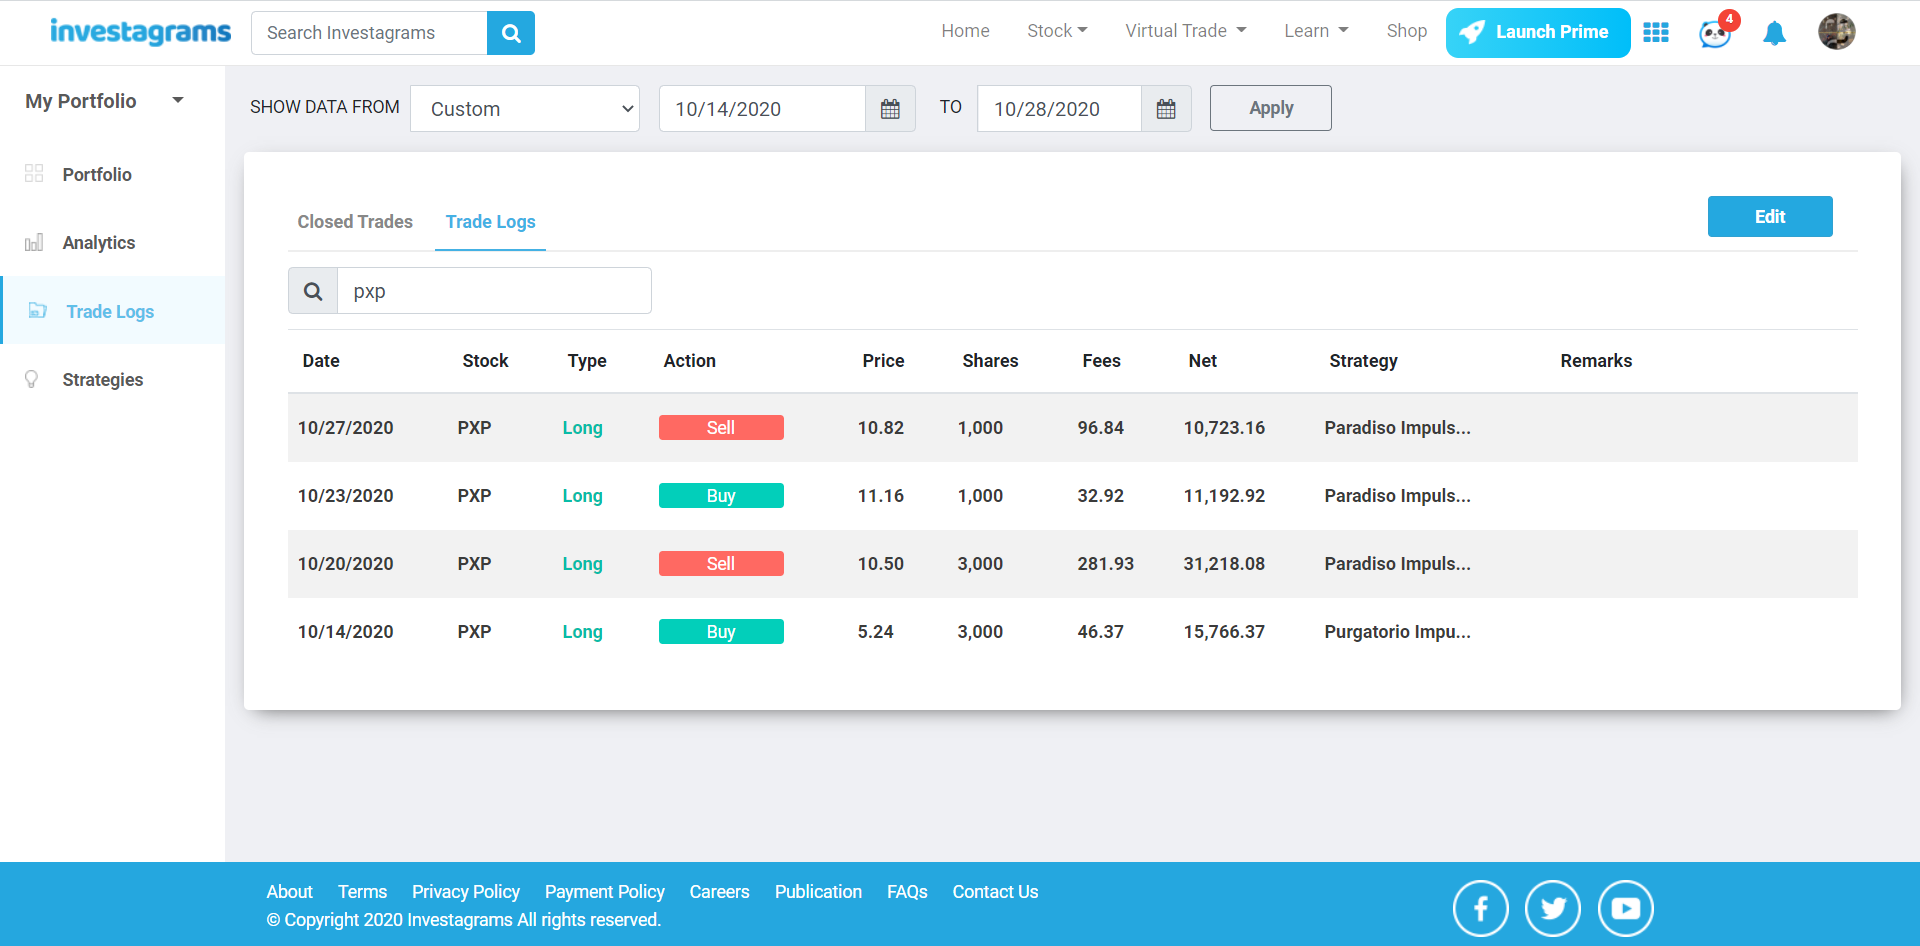
Yep that’s almost 100% gain because the stock went ceiling for a few days! And we only used the hourly time frame to create the trade plan. Here’s what my Investa Journal recorded.
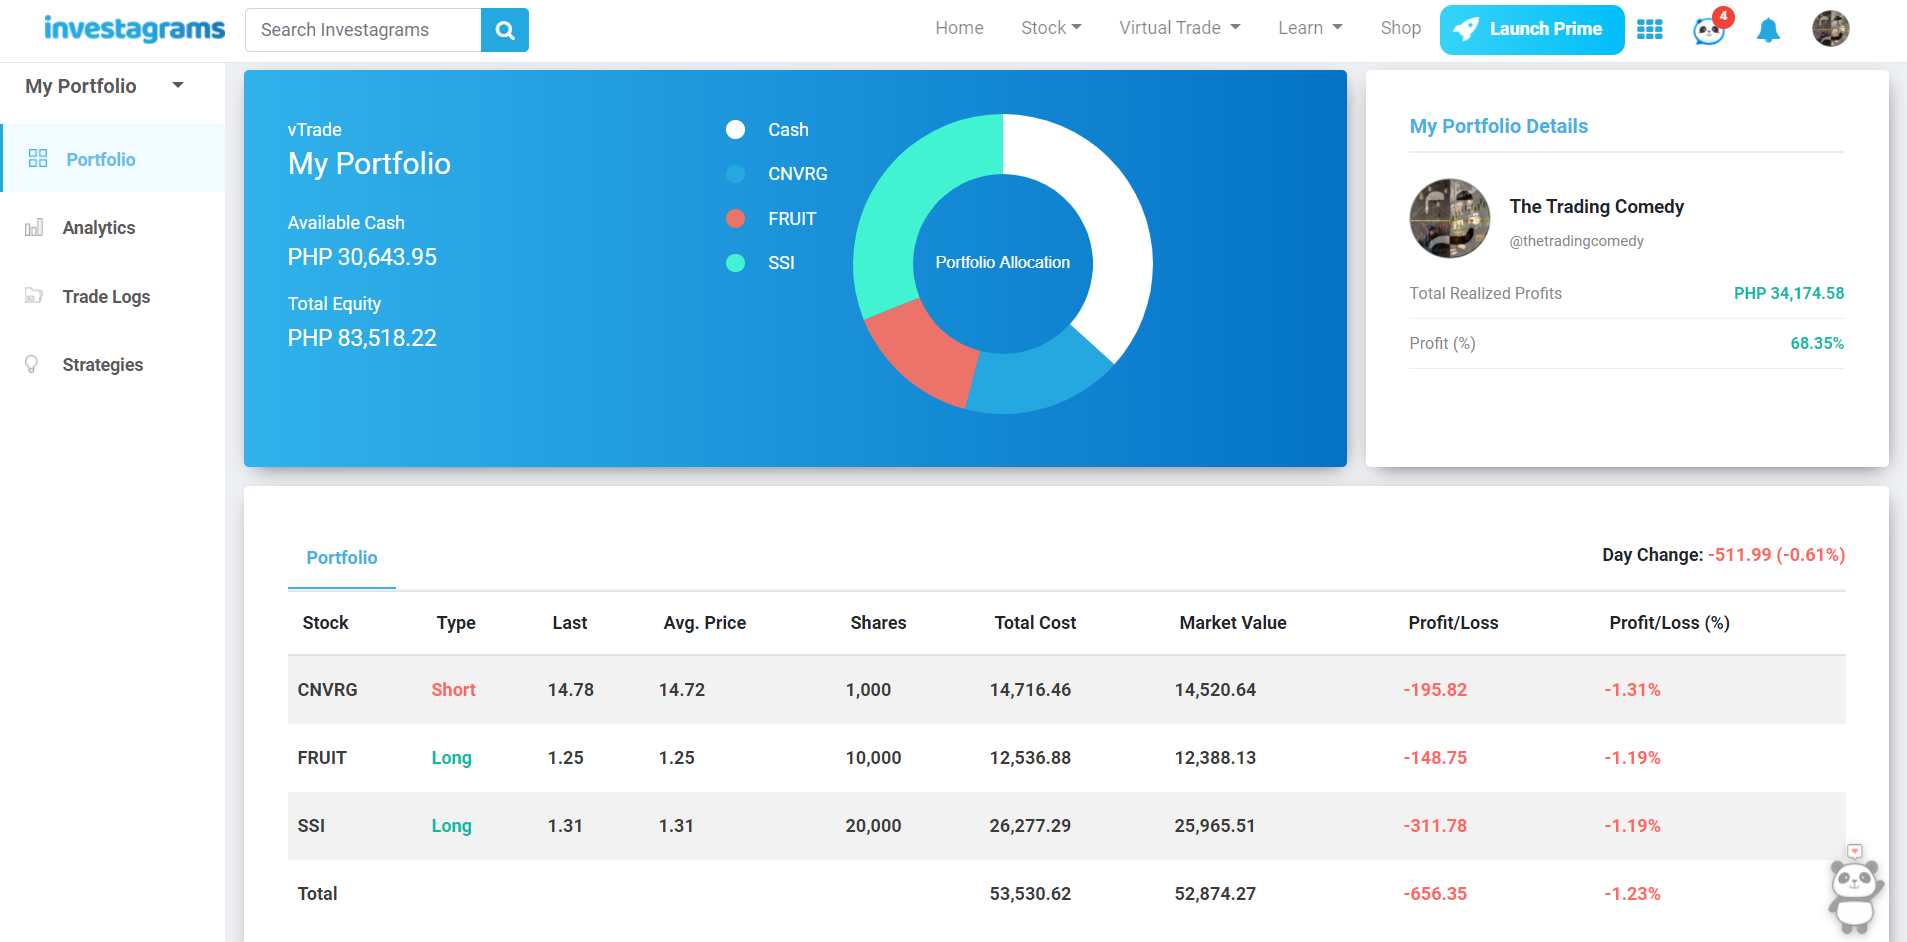
Based on the journal data above, I only held the stock for less than a week which is roughly 4 to 6 days (at par with our estimated holding time expectations) for both my huge win and minor loss. As of this writing, My Portfolio 50K 2020 Challenge port is now up by almost 70%!
One moving average is enough
Bombarding your charts with a lot of moving averages can sometimes paralyze your executions especially if you’re on the winning side of the trade and you become too complacent. With this guide, your expectations should already be set whenever you trade on your chosen time frame.
Stay tuned for the next post as we talk about my thought process on traversing properly through these timeframes.
A self-proclaimed “Lazy Elliottician”, Alec is a former mobile app developer turned independent singer-songwriter and busker, who goes by the stage name “Alex Corner”. He has a couple of songs on Spotify and other music digital platforms. A self-taught trader, he also created his own trader persona – “The Trading Comedy”, where he documents his trading journey in the Philippine Stock Market and beyond. He is currently a finance writer for Micky News as well as a casual gamer and streamer.
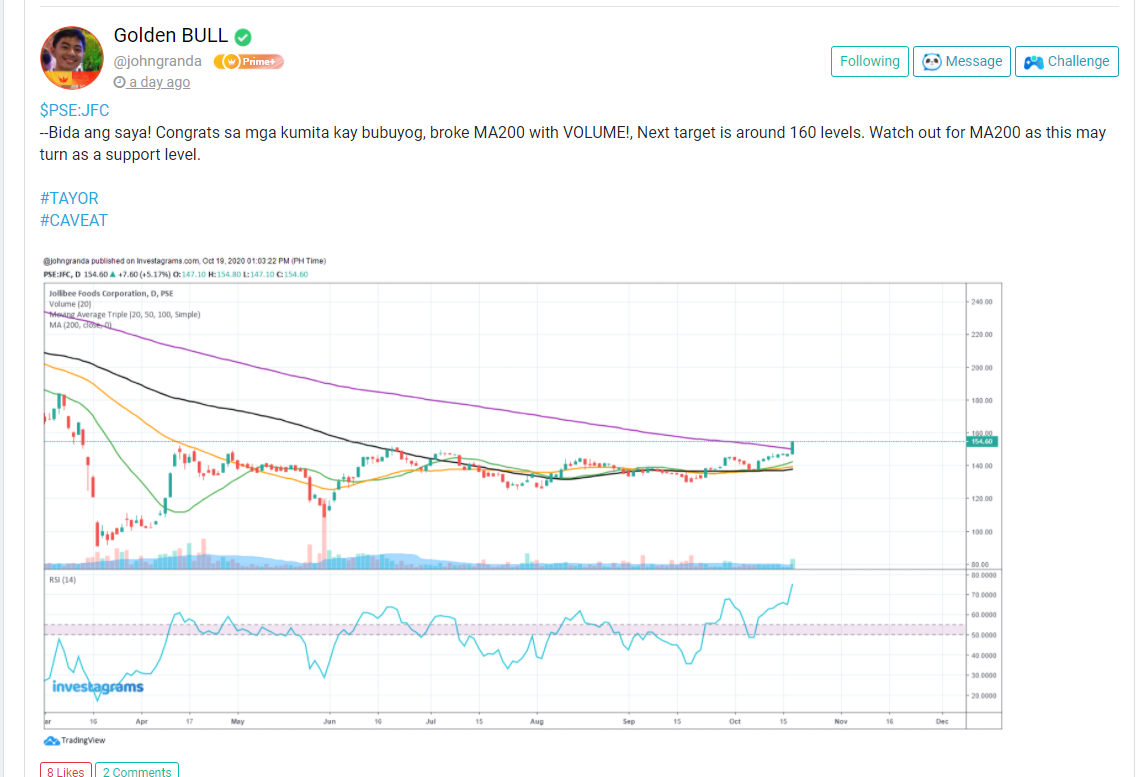
As the local index broke out of the 6000 levels in confluence with the 100-day moving average, several names have emerged, and one of which is a blue-chip company. Golden Bull (@johngranda) successfully spotted one of those potential leaders — Jollibee Foods Corp, or $JFC. This trader is an active member of the Investagrams community who endlessly provides his analysis and insights focusing on the local market.
As seen in the pattern of the said stock, it exhibits a VCP pattern. Mark Minervini coined the said pattern in his book “Trade Like a Stock Market Wizard.” This means that the said pattern displays contraction in its volatility from its previous data to the following or present data. Moreover, it consolidated for six months, which solidifies that its breakout of the underlying base may be robust. Indeed, the bigger the base, the higher in space.
Example of a VCP Pattern
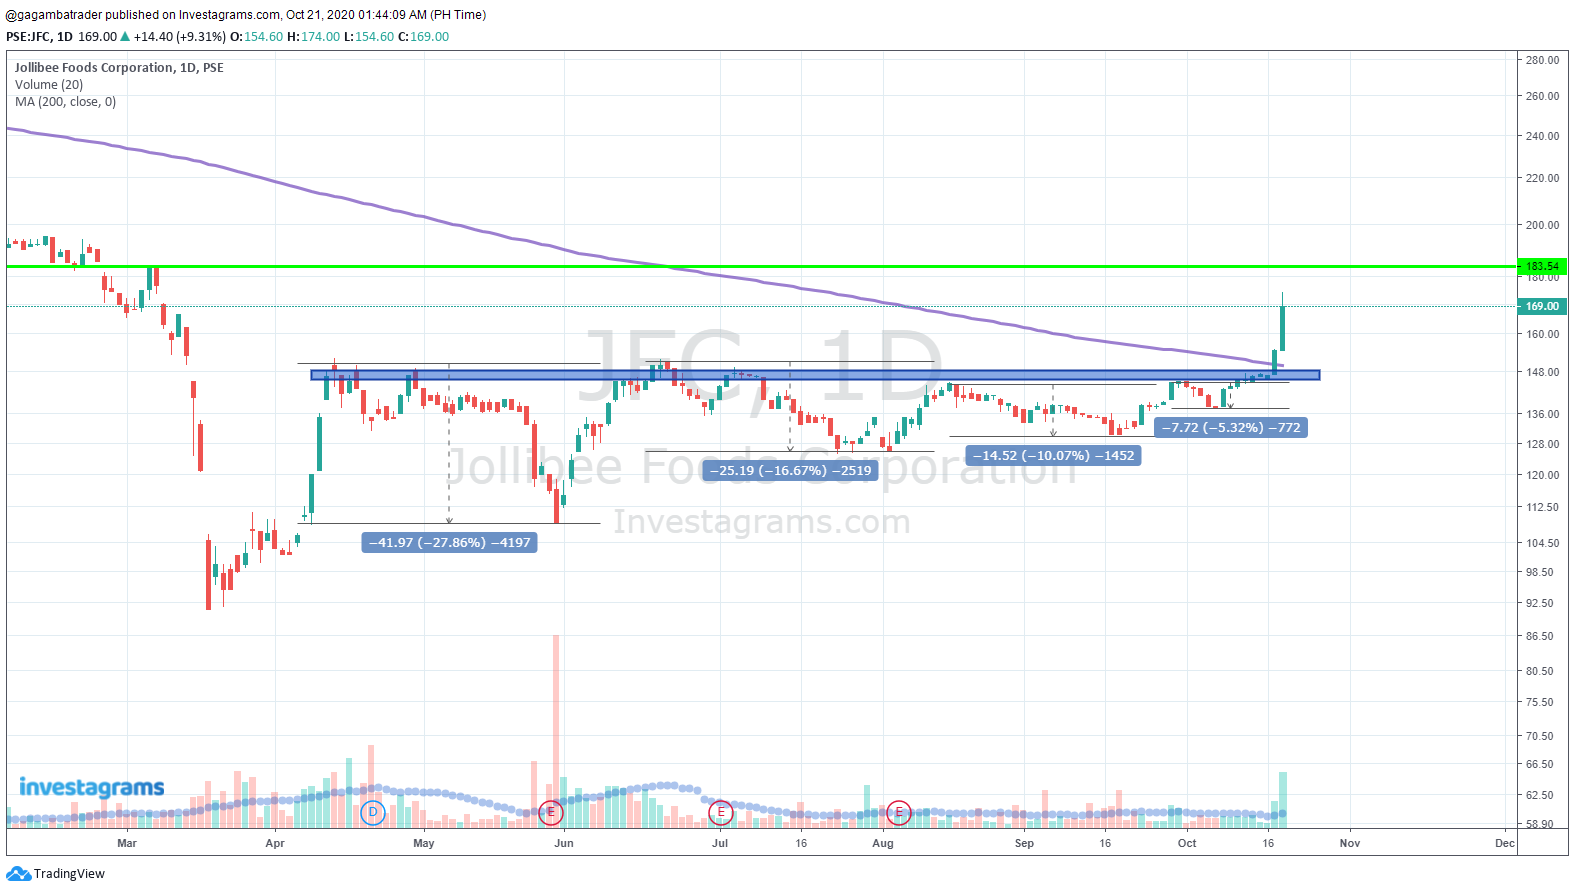
Moreover, Golden Bull (@johngranda) also mentioned the importance of also looking into moving averages as it is a form of support and resistance levels. In the book of Jason Cam named “The Trading Code,” the author explained that moving averages could be used as dynamic support and resistance. It is dynamic because merely moving averages are moving each day due to its statistical formula. Static support and resistance levels, on the other hand, are only not moving and are horizontal, just like the blue rectangle box that is representing the resistance of the underlying base in the figure above.
It is safe to say that $JFC has broken out of the pivot high of the underlying base in confluence with the 200-day moving average. Breaching the 200-day moving average is crucial as it is in a long-term horizon, which ultimately makes it more significant than that of the 20-day, 50- day, and 100-day moving averages.
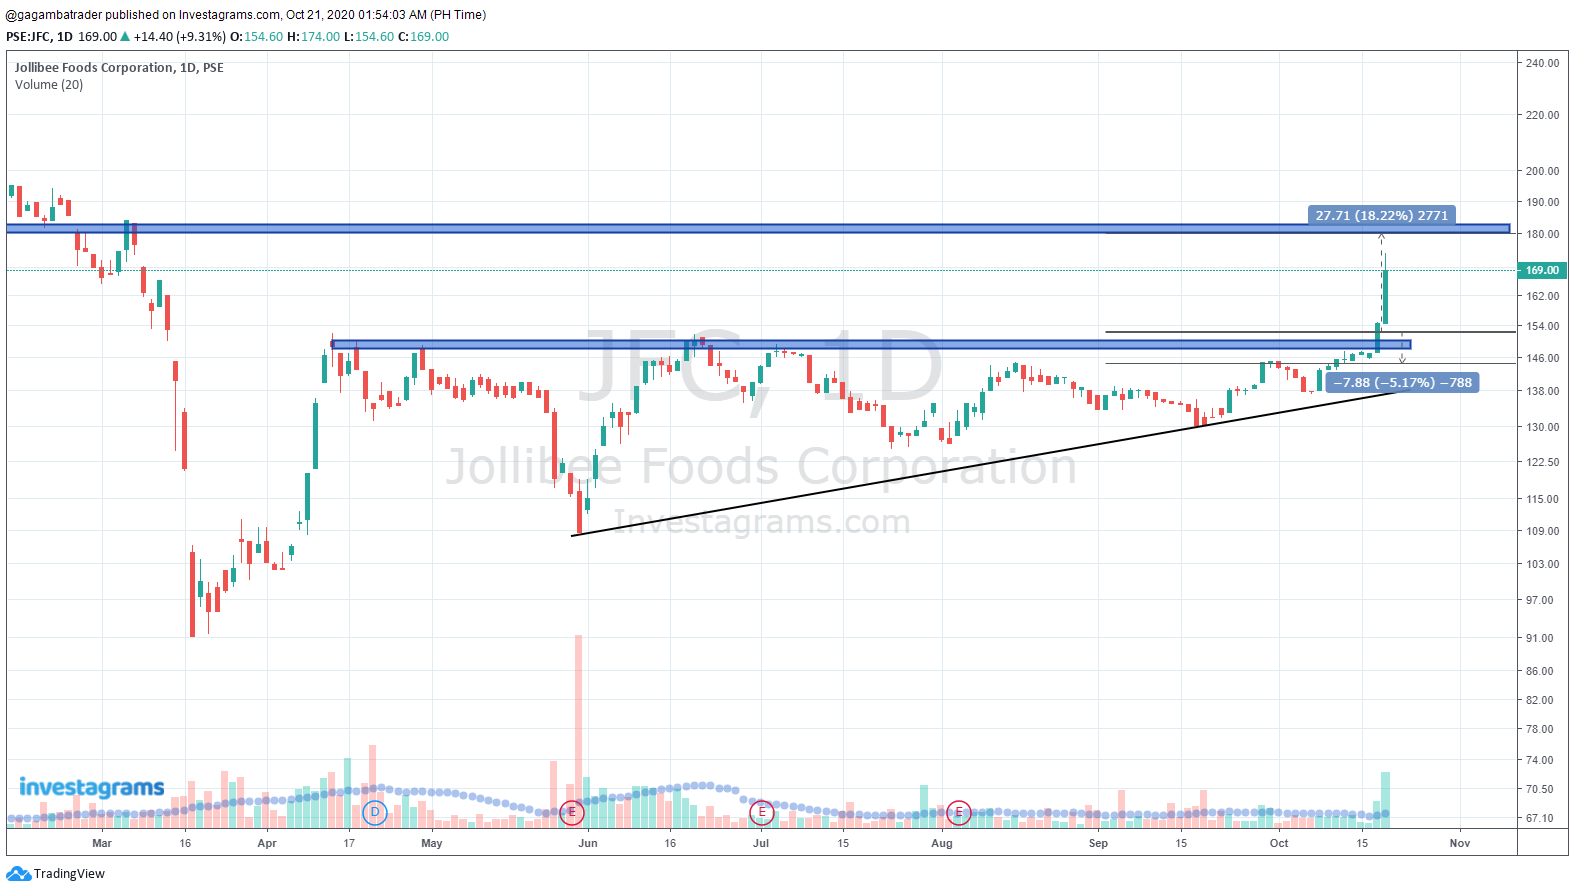
A breakout of the 150-peso pivot area was an ideal buy point as it was the confirmation of the ascending triangle breakout accompanied by massive volume. It is a low-risk, high-reward trade, as the stop loss levels for the said breakout point is around 144 (-5%), and the take profit areas could be the structural resistance at 180 (19%). As of this writing, the stock ended the trading session strong. Let us see if another constructive base will be formed to place our ideal 2nd tranche.
The said stock needs to break and sustain the 180-peso levels to assert its dominance further. Although we can also expect the displayed name to pullback on the old resistance turned to new support in confluence with the 200-day moving average. At the very least, the 150-peso levels should hold. It is also expected that since the $PSEi is increasing, $JFC should, and it is a bluechip stock.
Congratulations to those who were able to maximize the momentum of $JFC. Lastly, kudos again to Golden Bull (@johngranda) for sharing his execution. Your FREE 1-Month InvestaPRO access is on its way!
READY TO GET SERIOUS ABOUT YOUR TRADING?
JOIN THE EXCLUSIVE LEARNING AND COACHING SESSION WITH BEARYOTRADES!
For most people, the moment they start learning strategies and demo trade here and there, they can’t wait to put their money in their brokers ASAP.
But another question arises…
“Should I trade with the extra money?”
“I don’t have any source of income, how should I get capital?”
“Should I go all-in with my savings to trade the stock markets?”
So, in this guide, I’ll be sharing with you different ways on how you can start (and grow) your trading business.
It doesn’t matter whether you are a student, an employee, or an already consistently profitable trader.
But first…
Let’s be clear
If you want to start a trading business because you need to pay your lifestyle, or immediately want to replace your full-time job…
Then I highly suggest you don’t, as the worst time to start a business is through desperate times.
Yes, having a business can give you exceptional rewards, but it does not guarantee you a fixed income all the time, or even a return of investment.
Which is why trading is a business that should not be approached with an employee mindset.
But if you will approach this trading business in such a way that you’re…
going to build a personal and financial empire, instead of trying to survive
acting from your vision instead of your fears
ready to learn the skills needed (and to pay the price) to become an exceptional trader
Then I can almost guarantee you that you will enjoy this amazing journey of a lifetime.
So let’s start…
#1: Your Most Supportive Investor
This may not sound like a grown-up move but they can be your #1 supporter and first investor even if you don’t have any track record.
But you have to let them be aware that trading in the financial markets is not a get rich quick scheme.
So never make promises or guaranteed returns to them. Another thing that you should do is to show them that you are going to trade the markets with a plan and not just enter and exit randomly.
Your trading plan may constantly change as a newbie, but let them know that you are not starting with “lack” as this is good for you and your “investor” Finally…
Make sure they won’t sacrifice important payments or be in debt to give you capital.
Because IF the worst happens, you don’t want your decision to trade the markets affect your whole family.
Next…
#2: Using Your Hard-Earned Cash Properly
As an employee, it’s easy to say that you should save money and invest extra funds.
But trading is not just a side hustle or a part-time job, it is a business that requires commitment and energy.
So one thing you must do first is to…
Build a safety net
You must have a 3-6 month emergency fund in case something happens, and eliminate consumer debts.
Because the last thing you ever want to do is to trade because you need to pay the hospital bills or pay your debts as it puts your mind in an environment where you will be forced to perform and expect guarantees in the market.
Have a budget plan Always remember that a budget plan is goal-oriented.
So there’s no such thing as a fixed rule or percentage on managing your money, it is up to you!
But having it will always set your priorities straight, fulfilling responsibilities and personal goals at the same time.
As an example, you can allocate your monthly income to the following • 25% = Needs/Expenses • 25% = Wants/Self-Investment • 15% = Passive investing • 35% = Trading capital Again, this is just an example.
So you want to ask yourself what you want and adjust the percentages accordingly.
Overall, I want you to know that what we are doing here is to put you in the right environment to trade.
Moving on…
#3: Taking Your Trading Into The Next Level
I highly suggest that you choose this step once you have found consistency in the markets, and not when you’re just starting, but here are some sources you can consider…
1. FTMO (Paid):https://ftmo.com/en/welcome/#objectives You must complete their challenge of profiting at least 1% and not lose more than 1% within 30 days You can get funded up to $100,000 but this will depend on the challenge FEE you will pay
If you are someone who trades the forex markets as a momentum or day trader, then this is for you, as the challenge and time required is quite short. 2. PSYQUATION (Free):https://psyquation.com/ To qualify, you must have a PQ score above 75 with a 6-month track record on their platform.
You can receive funding up to 150,000 AUD and 20% of profit is yours, all you need to do is to use your trading capital and build a track record.
Again, if you are someone who trades the forex markets, then this is for you. 3. FUNDSEEDER (Free): https://fundseeder.com/home It is a platform led by Jack Schwager, but conditions and funding amount is not disclosed.
You can also trade any financial markets in the world with their accredited brokers, so if you are someone who trades global markets, then this is for you.
Now…
The reason why I mentioned that you should only choose this step if you’ve already found consistency is because pursuing institutional funding or managing other people’s money with an inconsistent and self-destructing trading habit is like pouring fuel over a fire.
So if you haven’t found consistency within yourself yet, then the chances of you finding consistency with other’s money are unlikely.
Finally…
Bonus: Controlled “Tuition” Fee
If you want to start your trading journey with having “low risk” and “high reward,” then this method is for you. Let me give you an example…
If you are dedicating a ₱100,000 trading capital to trade the markets, only put ₱20,000 (20%) on your trading account as you start trading. Once you gain consistency in the markets and not lose everything for the first 3 months (depending on trading style)… Place another 20% of your initial budget capital into live trading. If you mess things up early but only put 20% of your budget into live trading, then you have experienced a learning opportunity (the reward) at a low cost
On the other hand, if you managed to allocate 100% of your capital budget, then you’ve reached the stage of consistency that’s above the majority! Remember, confidence comes from competence and something you must prove to yourself gradually.
So…Which Option Should You Pick?
Overall, every person is unique and has different circumstances.
So, you can choose an option on how you can raise capital, and then improve on it, or tweak it in a way that’s appropriate to your situation.
With that said…
What are the other ways on how you can raise trading capital (legally)?
Let me know in the comments below.
Contributor:Jet Toyco
Investagrams Username: @Jet_Toyco
About the Contributor:
Jet Toyco is a private executive trading coach and a systematic trading portfolio fund manager at TradingwithRayner.
He is also a public helper of the trading community that is always open to questions anytime to give the knowledge people deserve at no cost, and no hype.
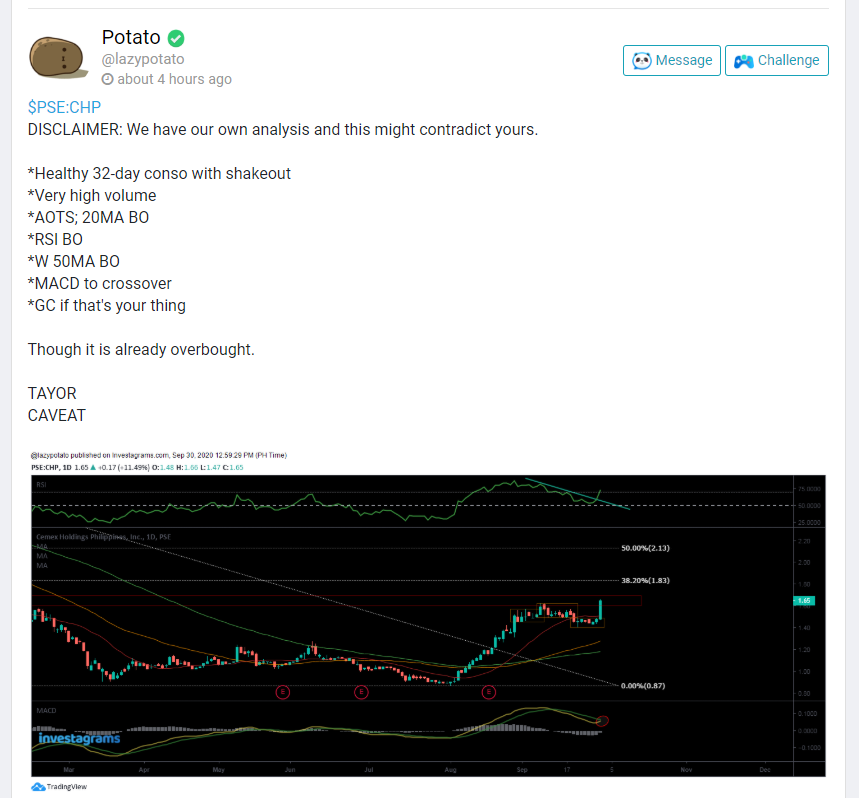
This trader was able to spot one of the market leaders of the local market – $CHP or CEMEX Holdings Philippines Inc. Potato a.k.a. @lazypotato is a new and active member of the Investagrams community, yet already ceaseless in providing his analysis and insights focusing on the local market.
Along with his analysis of his stock selections, he also highlighted that a trader must take things with a grain of salt. When it comes to grasping ideas of other market participants, he said that a trader must be careful in following or absorbing their ideas. We will never know if other’s analysis were made purely because of goodwill or because of hyping/bashing. Thus, it is always important to trade at your own risk (TAYOR) and with caveat.
As the said stock rose from its initial base, the stock consolidated for more than a month. The consolidation phase was also supported by below-average volume. Moreover, he also shared that the recent breakout of the said stock was in confluence with heavy volume, RSI (14) breakout of its trendline channel, MACD bullish crossover, and alignment of the stars (AOTS) in the form of moving averages.
Having multiple indicators confirm a buying signal indicates better chances that the move will continue its ascendancy. However, let us not forget that anything can happen in the markets. As traders, we should respect our stops if any unforeseen event occurs.
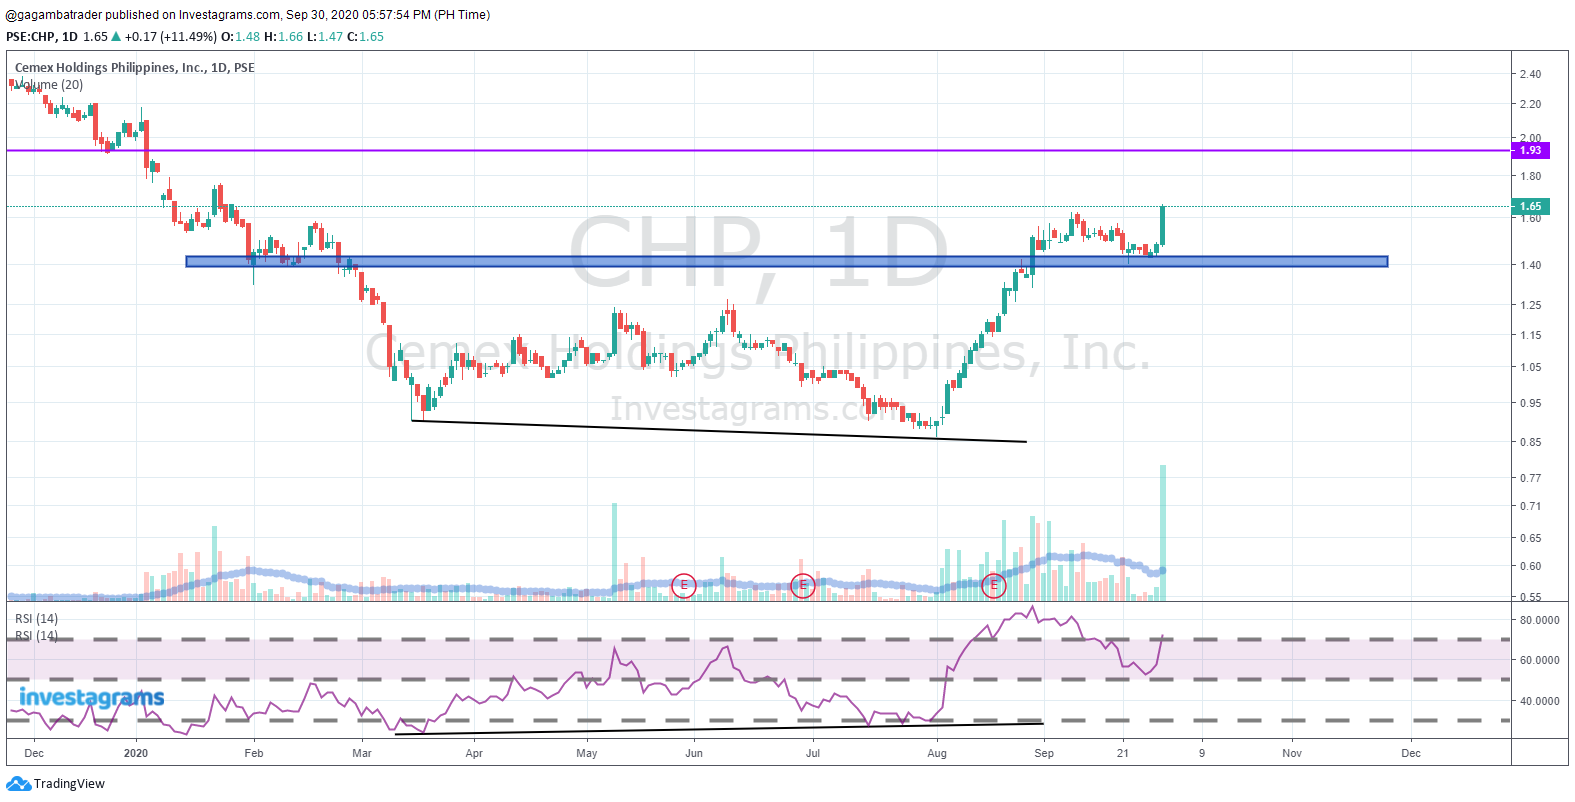
Moreover, there was a bullish divergence in the RSI (14) in its initial base prior to its rise. If you missed out on this trade during its rise last August 5, 2020, an opportunity reemerged when the stock was able to hover above the previous resistance which turned to the new support at the 1.4-peso levels.
The ideal buy point was the 1.4 (support) or the 1.5 (trendline breakout) peso levels. It is a low-risk, high-reward trade, as the stop loss levels for the said breakout point could be below 1.42 (-5.5%) if you bought it on its trendline channel pattern. On the other hand, the stop-loss levels for the said structural support levels could be below 1.34 (-4.4%). Take profit areas could be the structural resistance at 1.9-2-peso area (30%-40%).
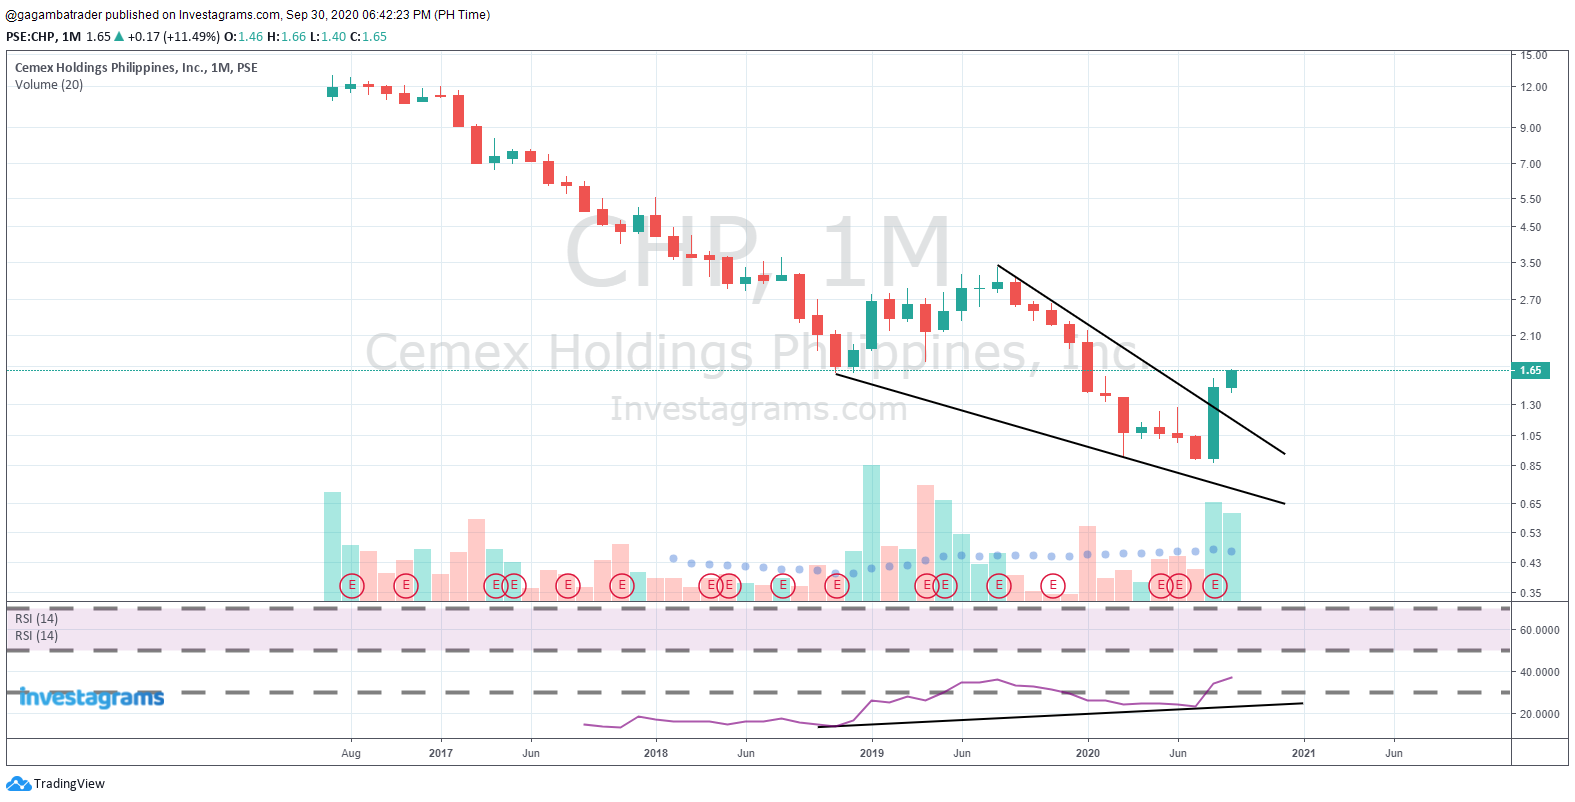
In the bigger picture, the monthly chart also exhibits a bullish divergence along with a triangle breakout. $CHP must sustain and consolidate above the 2-peso levels to further assert its dominance.
Market participants should not feel lonely when they miss a trade. Given that the financial markets offer a multitude of names from various asset classes that are operating in different timeframes, the markets are bound to give an endless stream of trading opportunities to those individuals who make themselves available for whatever the market is offering at any given moment.
Congratulations to those who were able to maximize the reversal play of $CHP. Lastly, kudos again to Potato a.k.a. @lazypotato for sharing his trade analysis. Your FREE 1-Month InvestaPRO Access is on its way!
Are you up to the Challenge of Investa Cup 2020? Registration is STILL OPEN UNTIL OCTOBER 4.
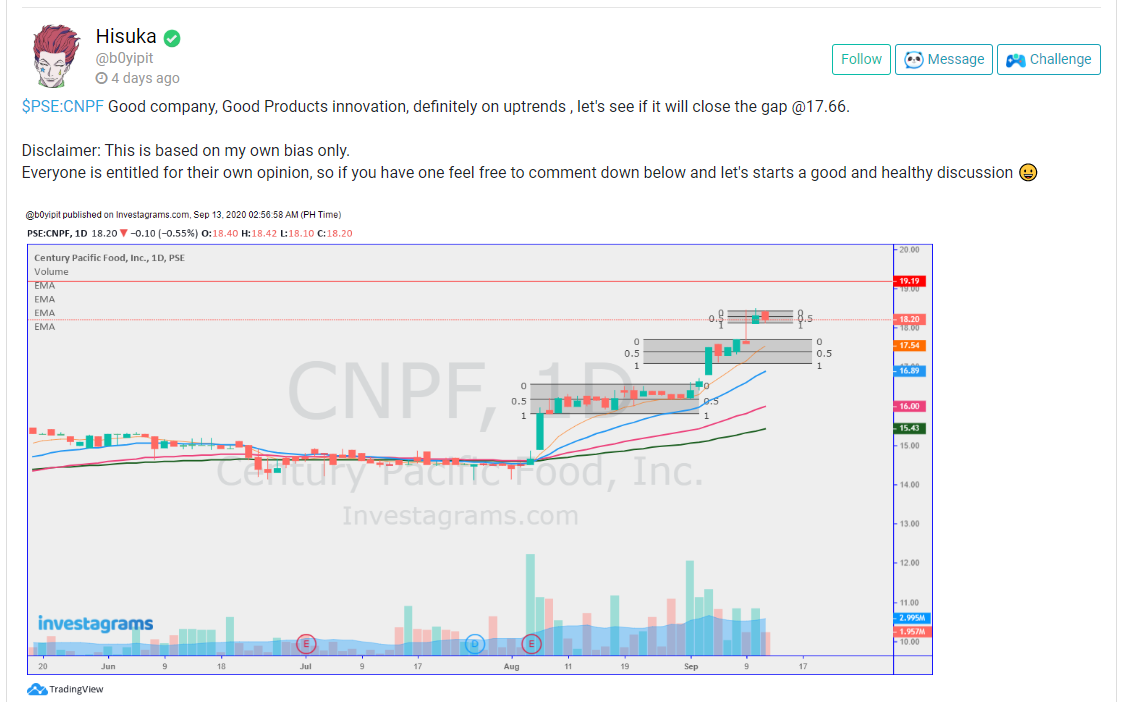
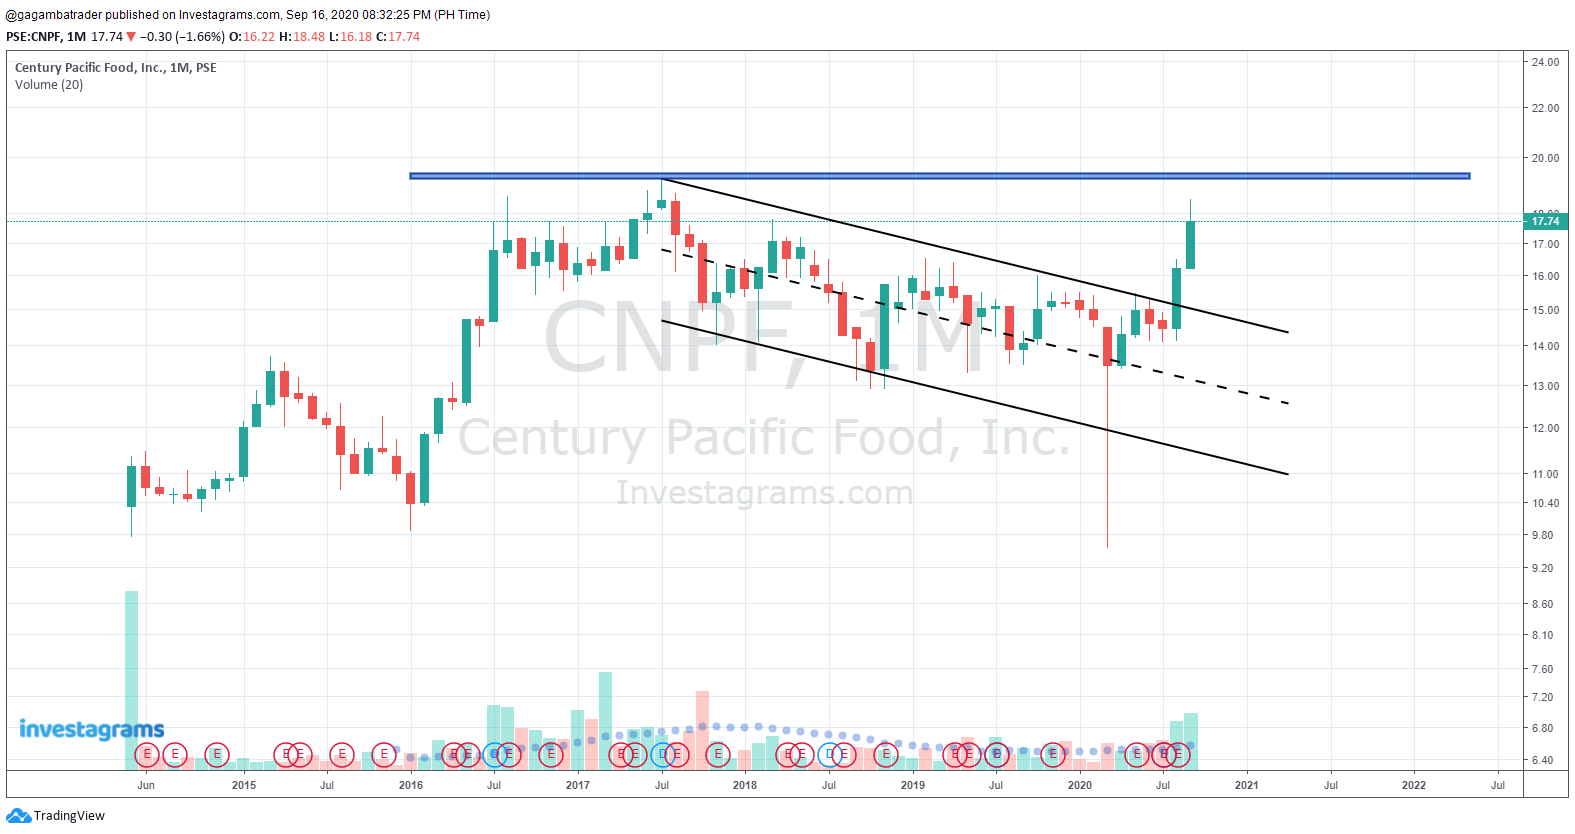
Even if the local index may look like it is consolidating from here given its current price structure, various names have emerged. Hisuka (@b0yipit) was able to depart the world of HunterxHunter to further solidify the use of his Nen to spot potential market leaders such as $CNPF or Century Pacific Food, Inc. Hisuka a.k.a. @b0yipit is an active member of the Investagrams community who endlessly spreads his knowledge on the local market with the use of Technical Analysis.
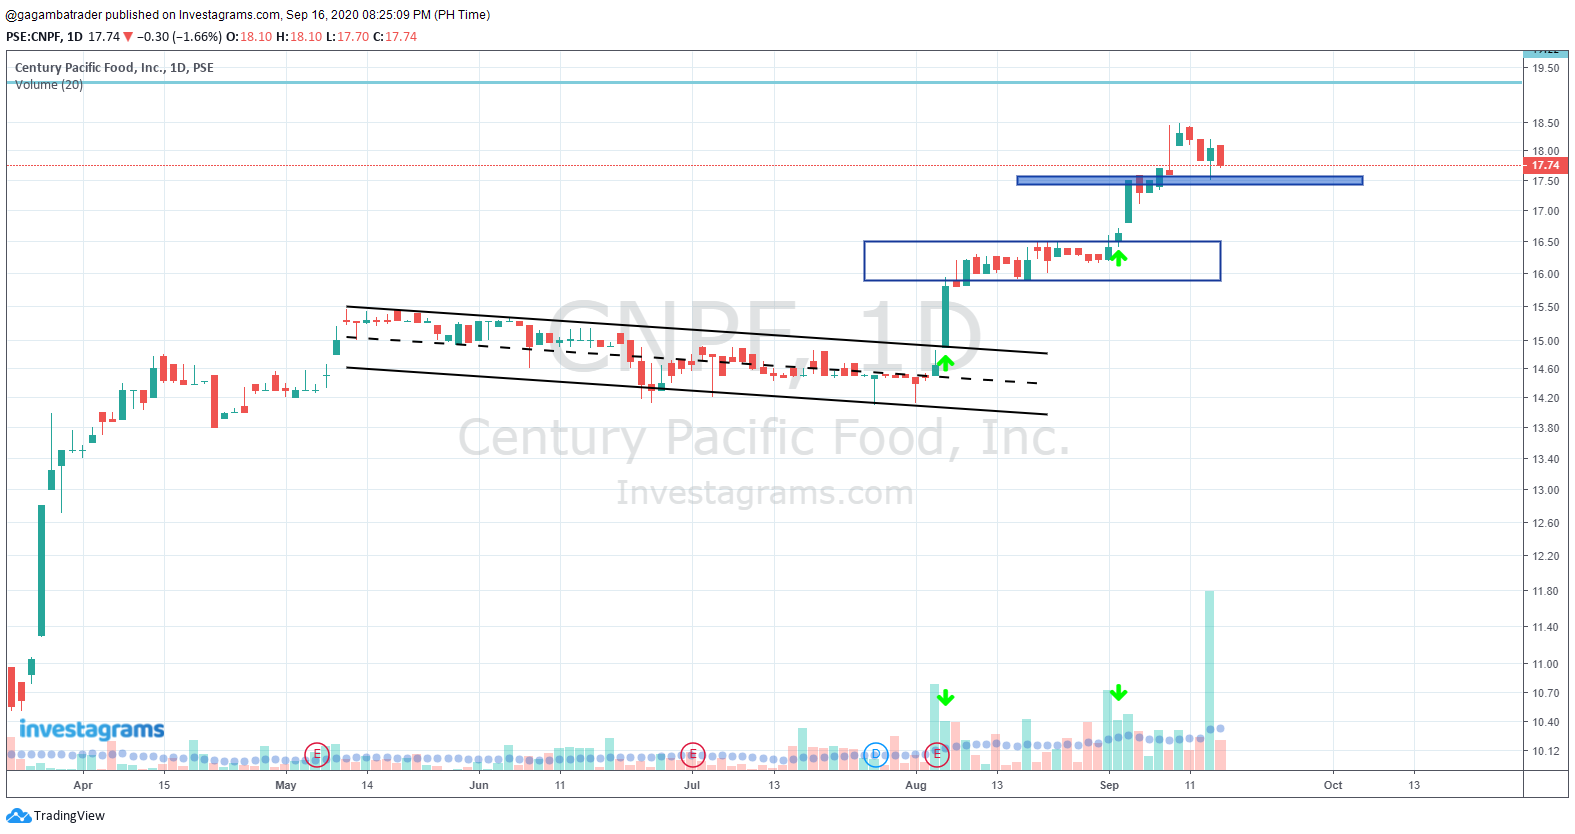
Even if this stock is quite illiquid, it still presented opportunities on the daily chart. Moreover, this stock is nearing all-time high levels. During its consolidation phase, the sideways movement was supported with dried-up volume. Upon its breakout of the underlying base, the move was supported with above-average volume.
A breakout of the 15-peso area was an ideal buy point as it was the breakout of the parallel channel line supported with above-average volume. It is a low-risk, high-reward trade, as the stop loss levels for the said breakout point could be below 14.5 (-4%), and the take profit areas could be the structural resistance at 17.5 (17%). Another tranche opportunity also emerged when the stock formed a small base ranging from 16 to 16.5-peso area. The breakout of the said mini base was also a good opportunity to add to your position as the stop loss levels for the said pivot area could be below 15.8 (-4.5%).
Looking at the bigger picture, the monthly chart of this stock is also pleasing. The previous breakout of the 15-peso area proved to be significant as it broke out of the long-term parallel channel line along with immense volume.
It is best for $CNPF to consolidate below the All-Time high levels with dried-up volume to form a constructive base. A break above the 19-peso area in confluence with massive volume is superlative for this stock to continue its dominance.
As Hisuka (@b0yipit) stated in his post, everyone is indeed entitled to their own opinion. Everyone may view a chart differently from that of the latter. If you have formulated and followed your concise trading plan, then there should not be any problem. Take it with a grain of salt, the decision, in the end, must come from your own bias. Relying on the opinions of other individuals will lead you to financial ruin. Great traders such as Jesse Livermore and Nicolas Darvas have experienced this the hard way.
Congratulations to those who were able to maximize the up move of $CNPF. Lastly, kudos again to Hisuka a.k.a. @b0yipit for sharing his trade analysis. Your FREE 1- Month InvestaPRO access is on its way!
Take your Trading to the Next Level. JOIN THE INVESTA TRADING CUP 2020: BOUNCE BACK CHALLENGE — Prize Pot now over PHP 500,000