In the realm of investing, data is an invaluable resource. It guides decisions. It offers insights. But raw data can be overwhelming. This is where data visualizations come in. They transform numbers into narratives. They turn complexity into clarity. For investors, this is crucial.
What are Data Visualizations?
Data visualizations are tools. They present information graphically. Think charts, graphs, and maps. They reveal patterns, trends, and outliers. They make data digestible. For an investor, this means better decisions.
Why are visuals so powerful? The human brain processes images faster than text. Visuals help us spot relationships quickly. They highlight what matters. In investing, time is money. Quick, informed decisions are vital.
Visuals also aid memory. We recall images better than words. This helps investors remember key information. It supports strategy development. It keeps important details top of mind.
The Different Forms of Data Visualizations
Data visualizations come in many forms. Line graphs show stock performance over time. Bar charts compare different assets. Pie charts display portfolio diversification. Each type serves a purpose. Each type offers unique insights.
Investors face a sea of data daily. Market reports. Financial statements. Economic indicators. Visuals cut through the noise. They focus attention on what’s important. They simplify the complex.
Use Cases of Data Visualizations
Consider trend lines. They show direction. They indicate momentum. Investors use them to spot opportunities. They also reveal risks. This helps in timing the market and aids in entry and exit decisions. Furthermore, data can be visualized in different ways to help show a clear picture of what’s happening in the market.
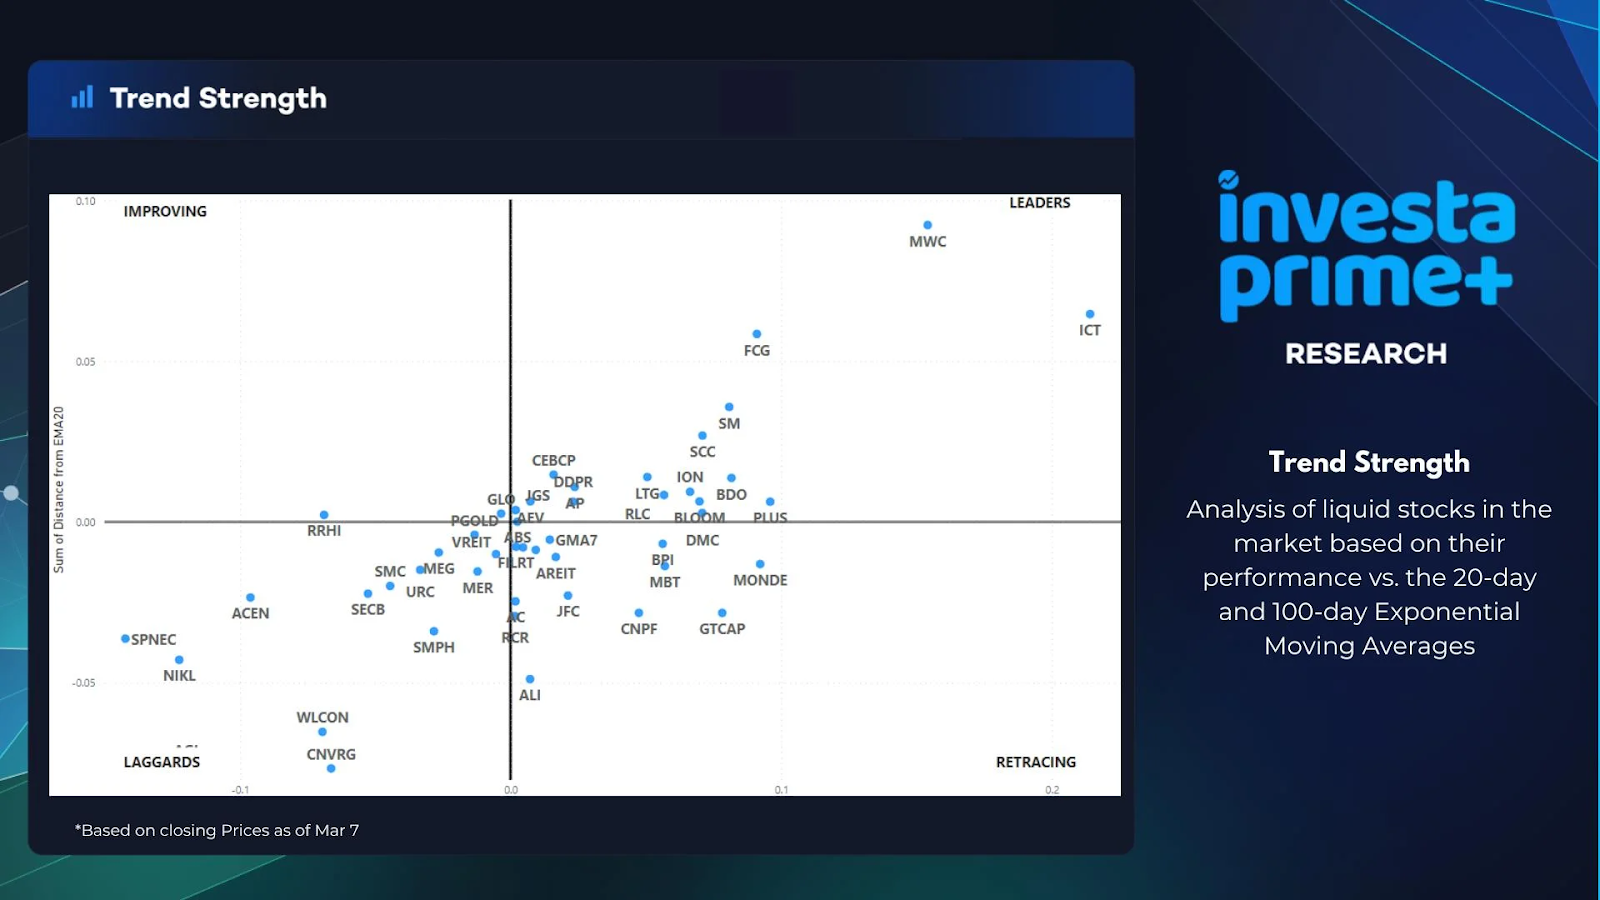
For instance, the scatterplot that we frequently share to InvestaPrime subscribers simplifies how a basket of stocks in the local market are doing. In just a glance, it’s already easy to tell which stocks are the clear leaders, and which ones are currently consolidating but were once the hottest stocks.
There are countless ways to visualize data. Each one serving different purposes, but all aim to help you make better decisions.
Things to be Wary of
Data visuals are not without challenges. Misinterpretation is one. Not all visuals are straightforward. Investors must learn to read them correctly. They must understand what they represent.
Another challenge is overreliance. Visuals are tools, not answers. They support decision-making. They do not replace analysis. Investors must still do their homework. They must still assess fundamentals.
Lastly
In conclusion, data visualizations are invaluable. They empower investors, clarify data, and support smarter investing. But they must be used wisely. They complement, not replace, thorough analysis.
Investors who master data visualizations gain an edge. Data can be navigated with ease which helps in making informed decisions.