
@nard_diaz takes the spotlight for this week’s featured trader as he used Keltner channels, Stochastics, and identifying support areas to spot a surge in price in $FCG!
Zooming out and identifying support is crucial in trading because it gives traders a larger picture of the market and helps them identify significant support and resistance levels.
Let’s take a look at how @nard_diaz utilized these indicators to his advantage.
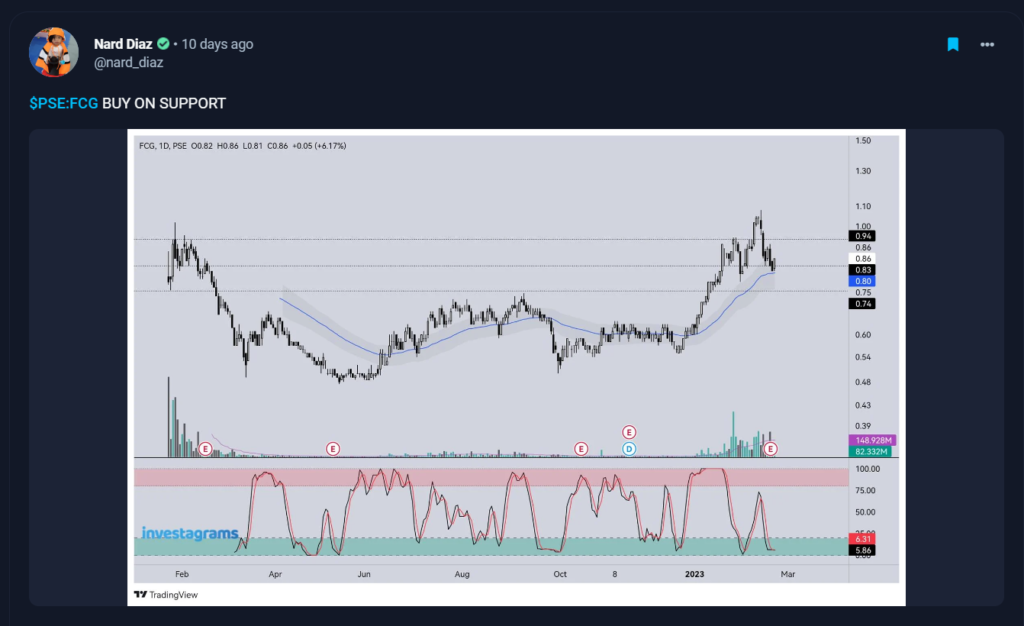
With enthusiastic energy, @nard_diaz encourages the community to buy on support as he spots FCG nearing its local support. This is because support levels represent a price level at which a stock or asset has historically had difficulty falling below. This is why it is common for traders to utilize support to spot buying opportunities. It could also be seen that the stochastic is in an area indicating the stock is being oversold and could be due for a price increase. The price action is then made further convincing due to the price falling near the Keltner channel, which may act as a price floor and prevent the stock from falling further.
From the day of his post, $FCG surged in price and is still going strong, amounting to a peak of 19.16% increase if you bought alongside @nard_diaz’s call to buy on support.
TECHNICALS OF THE TRADE
The three essential factors that made this trade successful were @nard_diaz’s ability to make the most of the information provided by the different indicators he used.
Keltner channels feature the typical EMA that we regularly use. However, the main difference is that the KC indicator also includes volatility bands. This adds robustness to the indicator as it will provide not just specific prices, but a whole range to work with.
@nard_diaz also used stochastics, which is a technical analysis tool that compares an asset’s closing price to its price range over a specific period to determine the price’s momentum. The stochastic oscillator uses two lines: %K and %D. The main line is %K, while the signal line is %D. %K denotes the current price with respect to the price range throughout the selected time period, whereas %D is a moving average of%K.
Lastly, as emphasized in his caption, @nard_diaz recognized support to identify the trend in $FCG and make informed decisions about when to buy or sell a stock. Recognizing support lines in stocks is a valuable tool for investors and traders because it allows them to make informed decisions based on market movements and reduces risk. However, it is crucial to remember that support lines are not perfect indicators and should be used in conjunction with other types of analysis, as we have also seen in @nard_diaz’s usage of other indicators.
FUNDAMENTALS OF THE TRADE
Monde Nissin (MONDE) recently bought into the Figaro Coffee Group (FCG), as it eyes the food service sector as an “attractive avenue for future growth.” Figaro Coffee Group Inc. jumped to a record as Philippine’s largest instant noodle maker Monde Nissin Corp. acquired a 15% stake in the company, giving the local coffee chain and restaurant operator more funds to expand its store network. On Thursday, January 26, MONDE disclosed its subscription to 820,268,295 new unissued common shares of stock FCG, equating to a 15% ownership holding, in a filing with the Philippine Stock Exchange.
FCG said it will use the transaction’s proceeds to “finance its expansion plans.” It currently operates and franchises Figaro Coffee, Angel’s Pizza, Tien Ma’s, and Cafe Portofino.
MONDE’s chief executive officer, Henry Soesanto, stated: “We are excited with the opportunity to become shareholders in the Figaro Coffee Group as it provides a greater exposure to the food service sector, which we view as a potentially attractive avenue for further growth both here in the Philippines and abroad.” He added that the ownership in FCG could boost the procurement capabilities of the restaurant and cafe operator as it expands further.
WHAT SHOULD BE YOUR NEXT MOVE
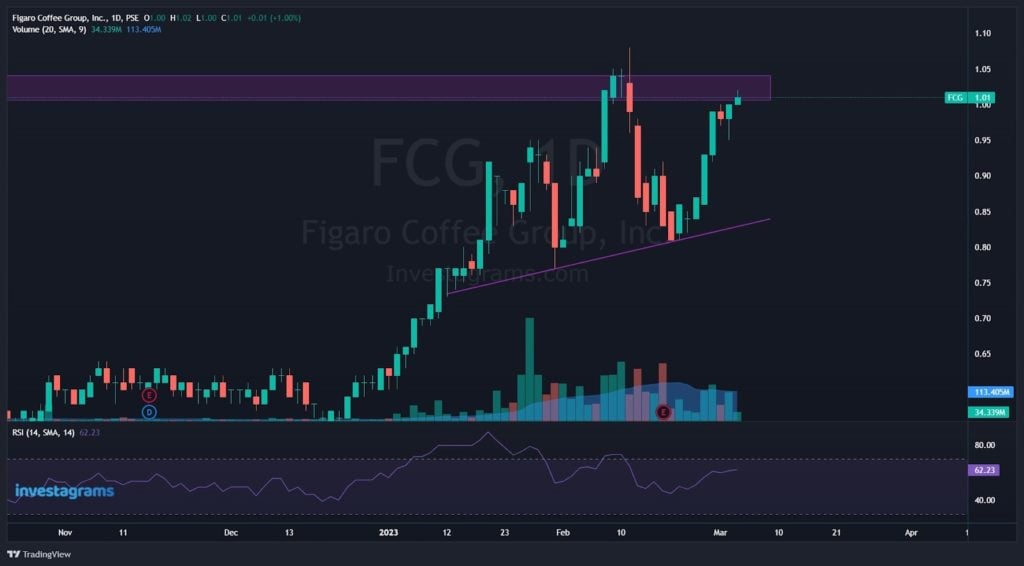
Right now, $FCG is slowing down as it reaches a local resistance level. It can also be seen forming higher lows. To prevent the danger of a potential pullback, it is best to wait for more confirmation of where the stock will go.
Once again, KUDOS to @nard_diaz for being this week’s featured trader! Enjoy your 14-day InvestaPrime Access and continue to be an inspiration to the trading community.
Nahihirapan ka ba sa trading?
Improve natin ang trading experience mo with our SULIT PSE Data + Prime Access! Get access to:
Real-time PSE Data Level 1
Easy stock picks through our market leaders
Signals sa breakouts, breakdowns, volume spikes at iba pa
No hassle payment na din dahil may 3 and 6 months plans available na! For as low as P324/month only