
@bluecheats takes the spot for this week’s featured trader! @bluecheats used price action to identify the triple bottom visual pattern and paired it with the symmetrical triangle and basic support and resistance (also known as S/R) to spot the surge in the price of $MER.
Let’s take a look at how @bluecheats used these indicators to his advantage.
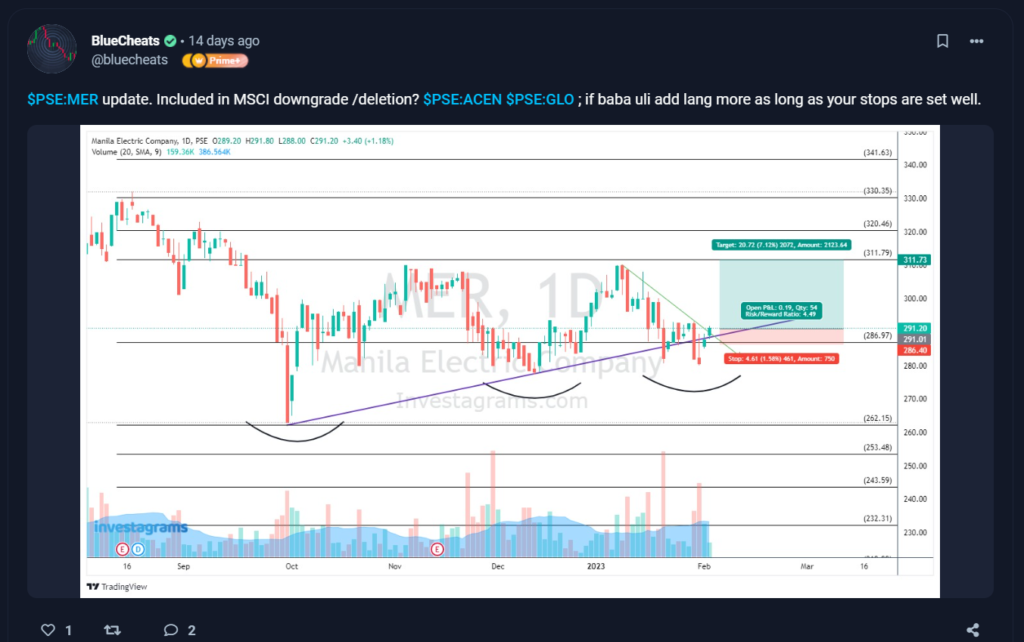
By zooming out, bluecheats was able to spot the triple bottom visual pattern that $MER was forming. The triple bottom pattern is a technical analysis pattern that traders frequently use to identify probable bullish reversals in the price of a stock. Bluecheats also used support and resistance to not only set his initial target profit but also to form a symmetrical triangle that serves as an additional indicator of where the stock’s price is going next. The stock breaking out upward in the symmetrical triangle supports the triple bottom pattern in indicating a potential upward momentum for the price.
At the time of the bluecheat’s post, the stock was trading at the 291 level. The stock surged in price 8 days later, not only hitting the trader’s initial target profit at the 311 level (for a gain of around 7%) but also peaking at the 317 level, for a potential gain of around 9%
TECHNICALS OF THE TRADE
The three essential indicators @bluecheats used in this trade are the triple bottom visual pattern, the symmetrical triangle, and S/R.
The triple bottom is produced when the price of a stock falls three times to a support level and bounces off of it without breaking it. When a stock produces a triple bottom pattern, it suggests that there is considerable buying activity at the support level, keeping the price from falling below it.
The symmetrical triangle is created by drawing two converging trend lines that connect a stock’s price action series of highs and lows. Traders might look for a breakout in either direction after the symmetrical triangle pattern has formed. If the stock breaks out to the upside, it might imply that bullish momentum is building and that the stock is positioned to rise. If the stock breaks out to the downside, it might imply that bearish momentum is building, and the price is likely to fall.
Traders commonly use support and resistance levels to identify potential areas of buying or selling interest in a stock. It’s crucial to remember that support and resistance levels aren’t always good predictors of future price moves. Traders should always employ other types of research to back up their trading decisions. Nonetheless, support and resistance levels may be a valuable tools for traders attempting to discover probable entry and exit points for their trades, as well as control risk by setting target profit levels.
FUNDAMENTALS OF THE TRADE
Lately, Manila Electric Co. (Meralco) has begun the building of a new substation in Kawit, Cavite, to meet the area’s expanding power demand. The new substation is expected to be finished by April 2024. It will hold three transformer banks with a total capacity of 249 megavolt amperes (MVA), each capable of providing around 83 MVA.
“This Meralco Island Cove Substation will be an integral part of the Meralco Distribution System in Cavite, supporting not just Island Cove’s power requirements but also that of the communities around Kawit and Bacoor, Cavite,” said Ferdinand O. Geluz, Meralco’s first vice-president and chief commercial officer for customer retail services, in a media release.
Meralco stated earlier this month that it had commissioned a 115-kilovolt switching station at the Light Industrial Science Park 2 in Calamba City, Laguna. The project is anticipated to improve the area’s system dependability and electricity quality. The La Mesa switching station will handle an increase in power demand of around 13.5 megawatts (MW) this year, rising to 20 MW by 2027.
WHAT SHOULD BE YOUR NEXT MOVE
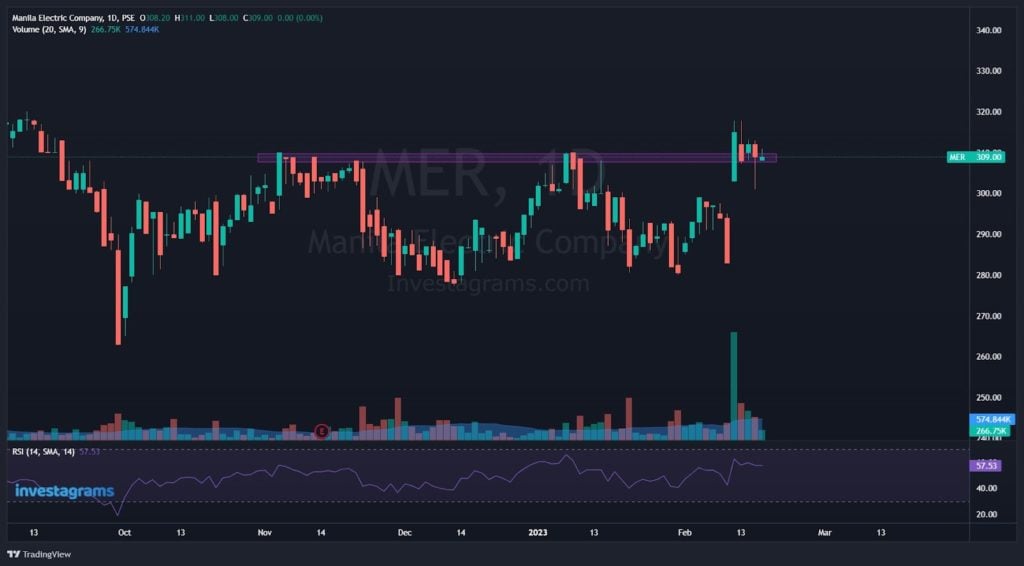
Currently, $MER ranges in its support level around 309. It is advisable to wait to see if this level would hold or would break down. The RSI also shows overbought signals. This further supports the risk of a potential drop in price. As a result, it is advisable to evaluate strategy and wait for other multiple signals of where the stock will go. When multiple confirmations align, it can aid decision-making and reduce the risks of potentially going against the trend.
Once again, KUDOS to @jprados for being this week’s featured trader! Enjoy your 14-day InvestaPrime Access and continue to be an inspiration to the trading community.
Everyone’s retirement story is different.
You may be planning to retire at a certain age, or need to be retired earlier than you thought, or even plan to keep working well past retirement age.
Whatever your story is, we want to help you build your retirement financial goals that are right for you and make the most of your retirement with your loved-ones.
Start your retirement journey with the Investa app today: http://invs.st/DailyInvestMFfeb