
If you have even just a little bit of experience trading any market, you would know that the bigger funds or individuals with a big portfolio are the ones that tend to cause major movements. Often called whales, they are able to push markets higher if they aggressively buy a stock and can cause selloffs if they dump their shares. We don’t need to be whales to be successful traders, but it pays to know what the big money is doing in the market.
With the Investa Stock Jockey, you can precisely track who is pushing the stock up, what their average price is, and you can also see when they start selling!
Let’s take a look at one of the strong moves in the Philippine stock market back in 2019 – ABA.
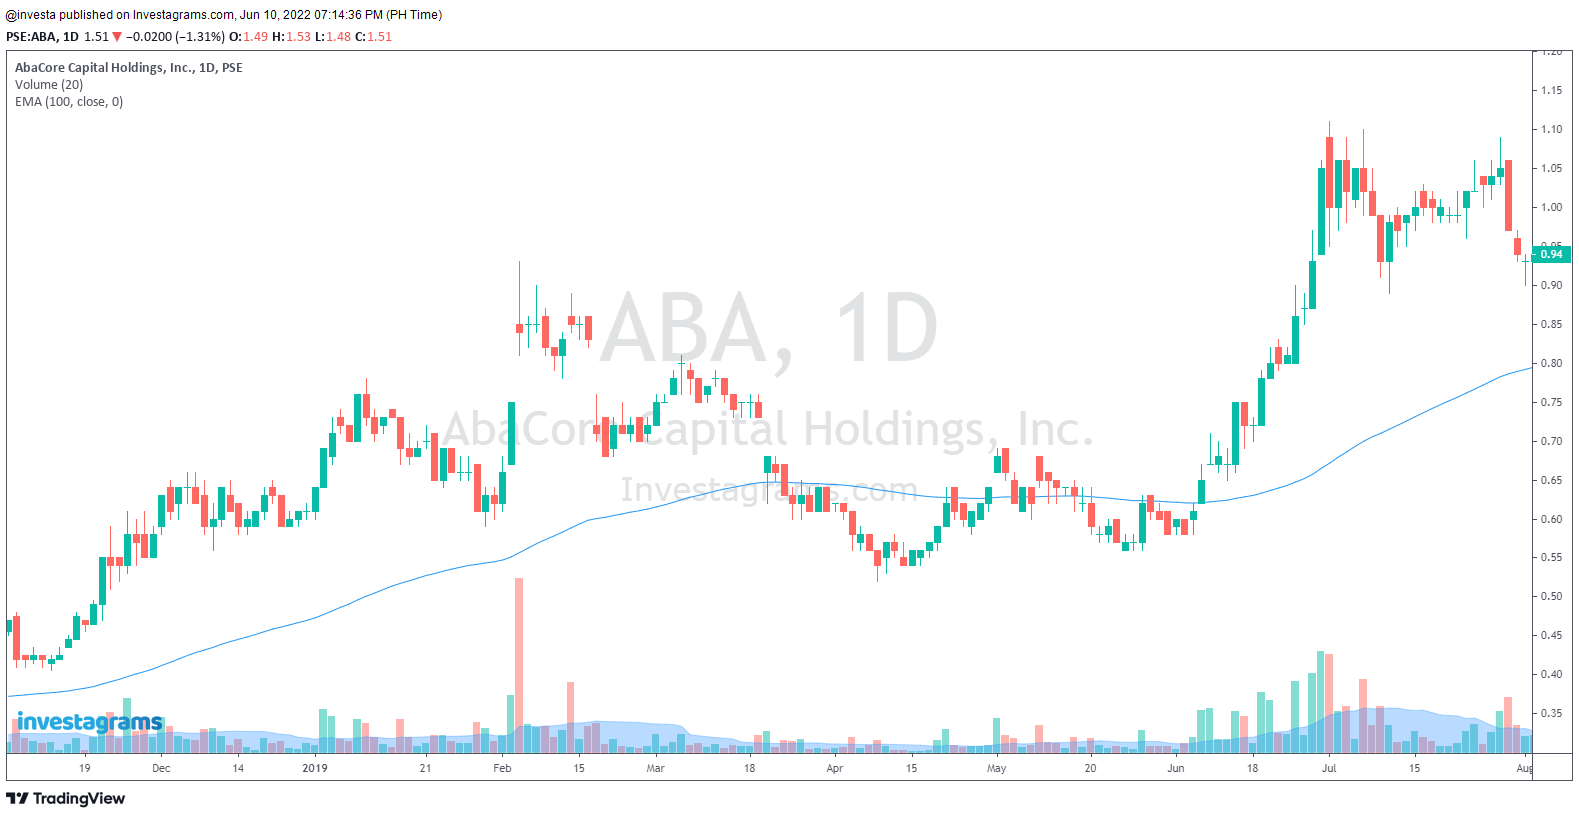
As you can see from the chart, ABA made a double bottom before going on a strong rally. Just by using technical analysis, we know where we should’ve bought and would most likely have plans to sell. However, using the Investa Stock Jockey, we can gain more insights that could help us be prepared for even more situations. Here’s one of the ways you can use it:
- Pick the stock and select the date
Once you launch the Investa Stock Jockey tool, you would just need to input the stock and set the filter to custom.
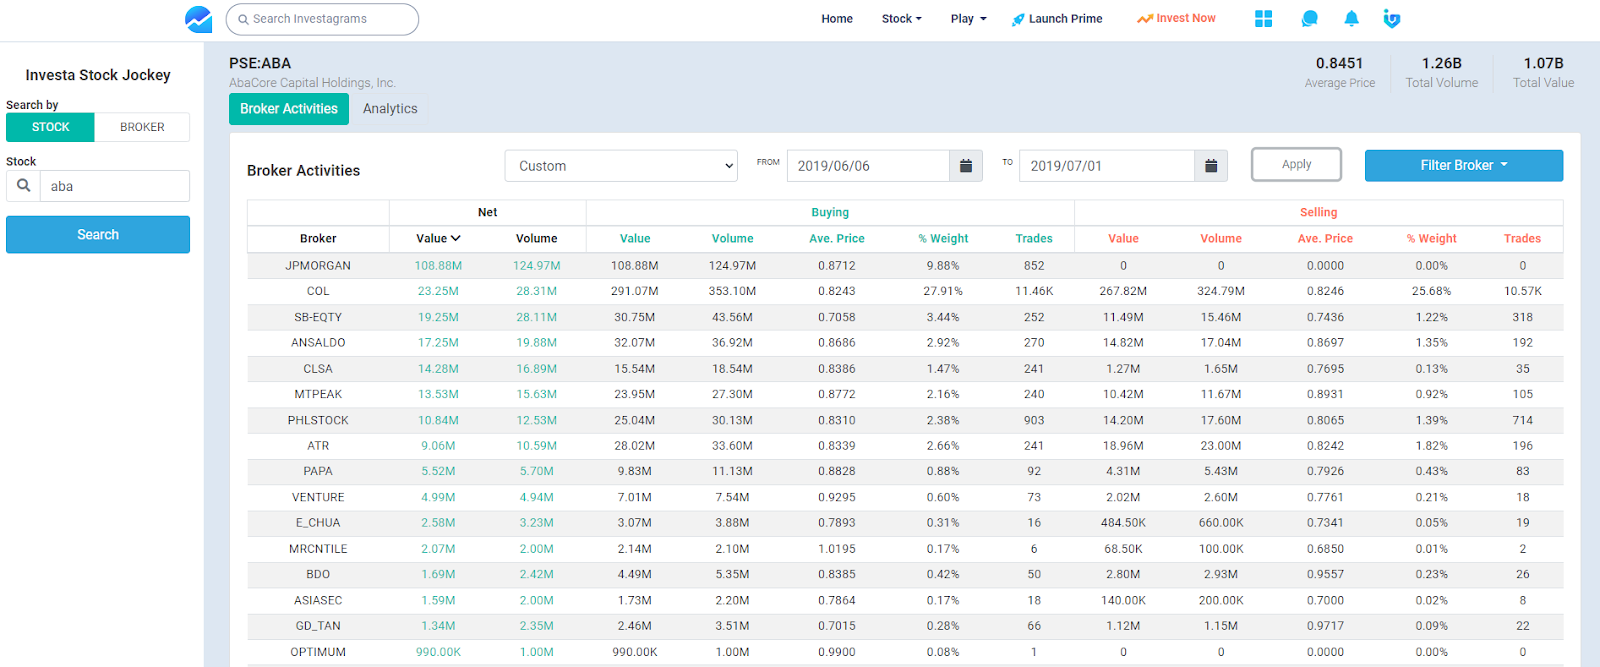
Set the dates to the trading days that you want to check for broker activities, and apply the filter. It should show who bought the most and what their average price was.
- Use the filters to get a better view of what’s happening in the stock
You can use the different filters within Investa Stock Jockey should you want to organize your data if there is specific information that you want to get.
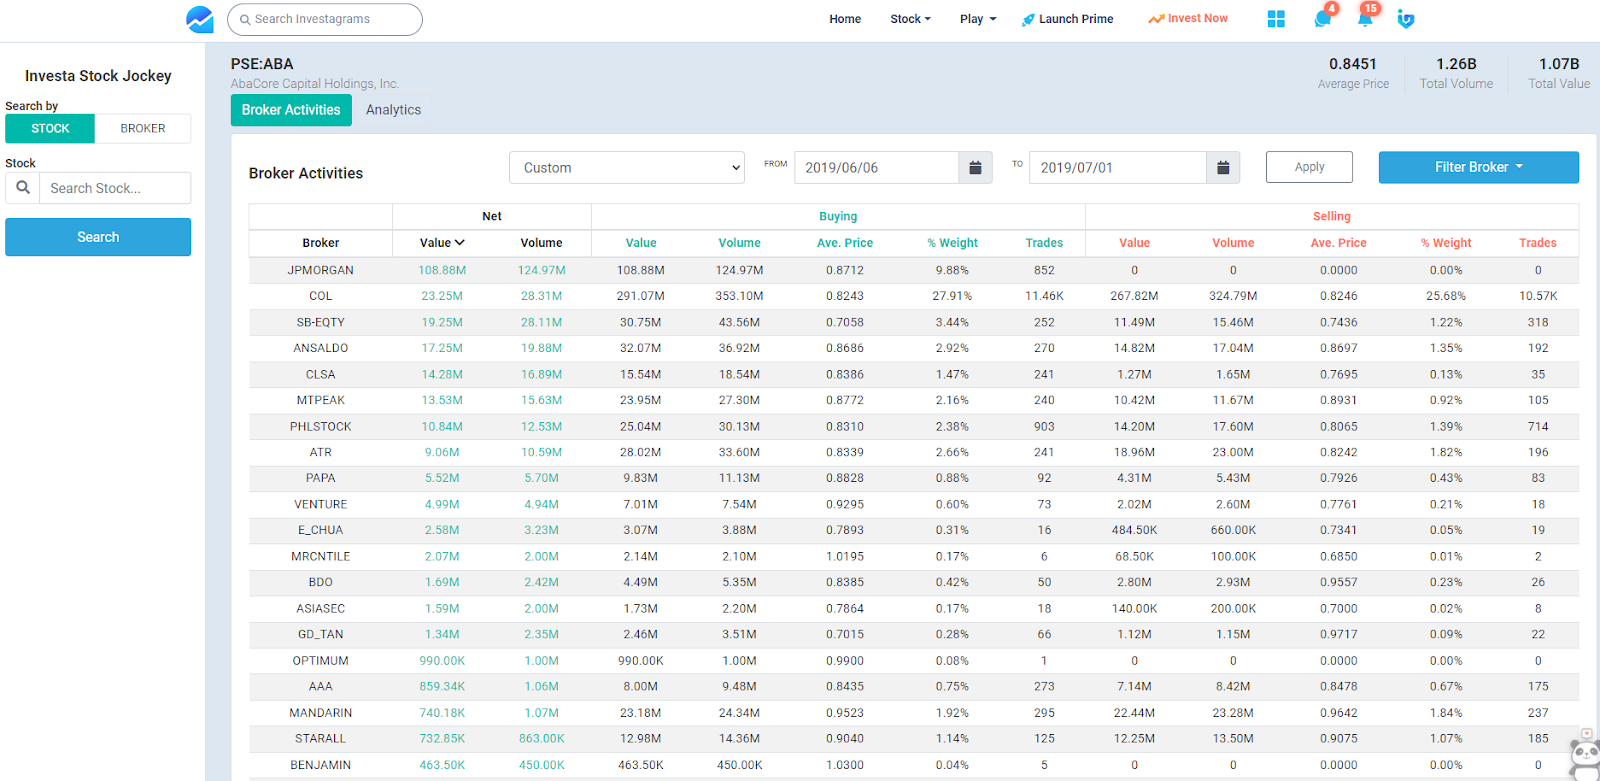
For example, you can use the net value filter to see who the biggest shareholder is. Also, you can filter by broker just to see what a specific broker has been doing for the specified dates. There are many ways you can tinker with the filters, you just need to be creative should you want to get a better view of the stock’s transactions.
- Deduce what happened and make your plans
Since you would see the big transactions that came in, you can easily figure out what happened during that time span.
For ABA back in 2019, it is noticeable that JP Morgan was the main shareholder that pushed prices upward. Hence, it would make sense that you would be warry with what they do. For example, if they started selling their shares, it might be safer to switch to a tighter stop since JP Morgan was the one that bought up the majority of the shares that caused ABA to rally.
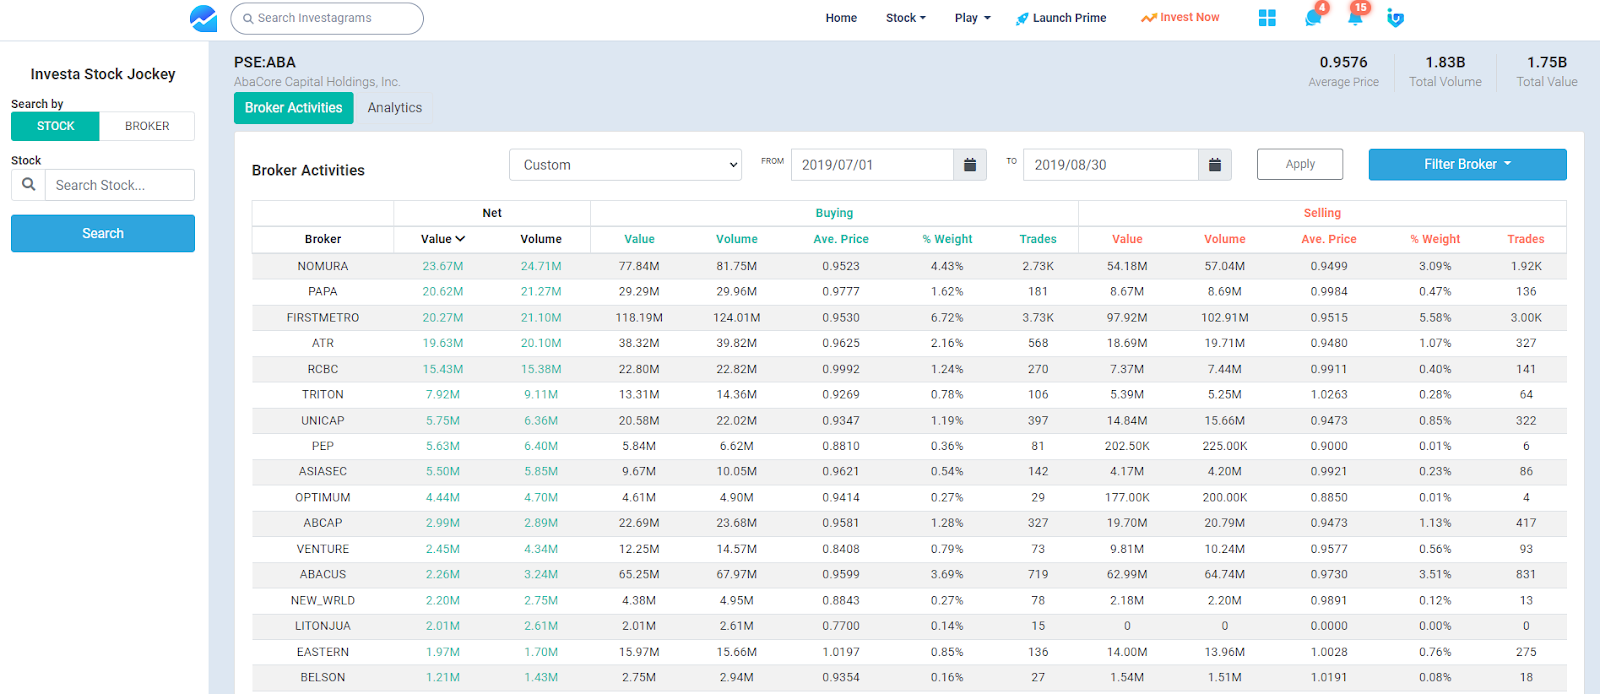
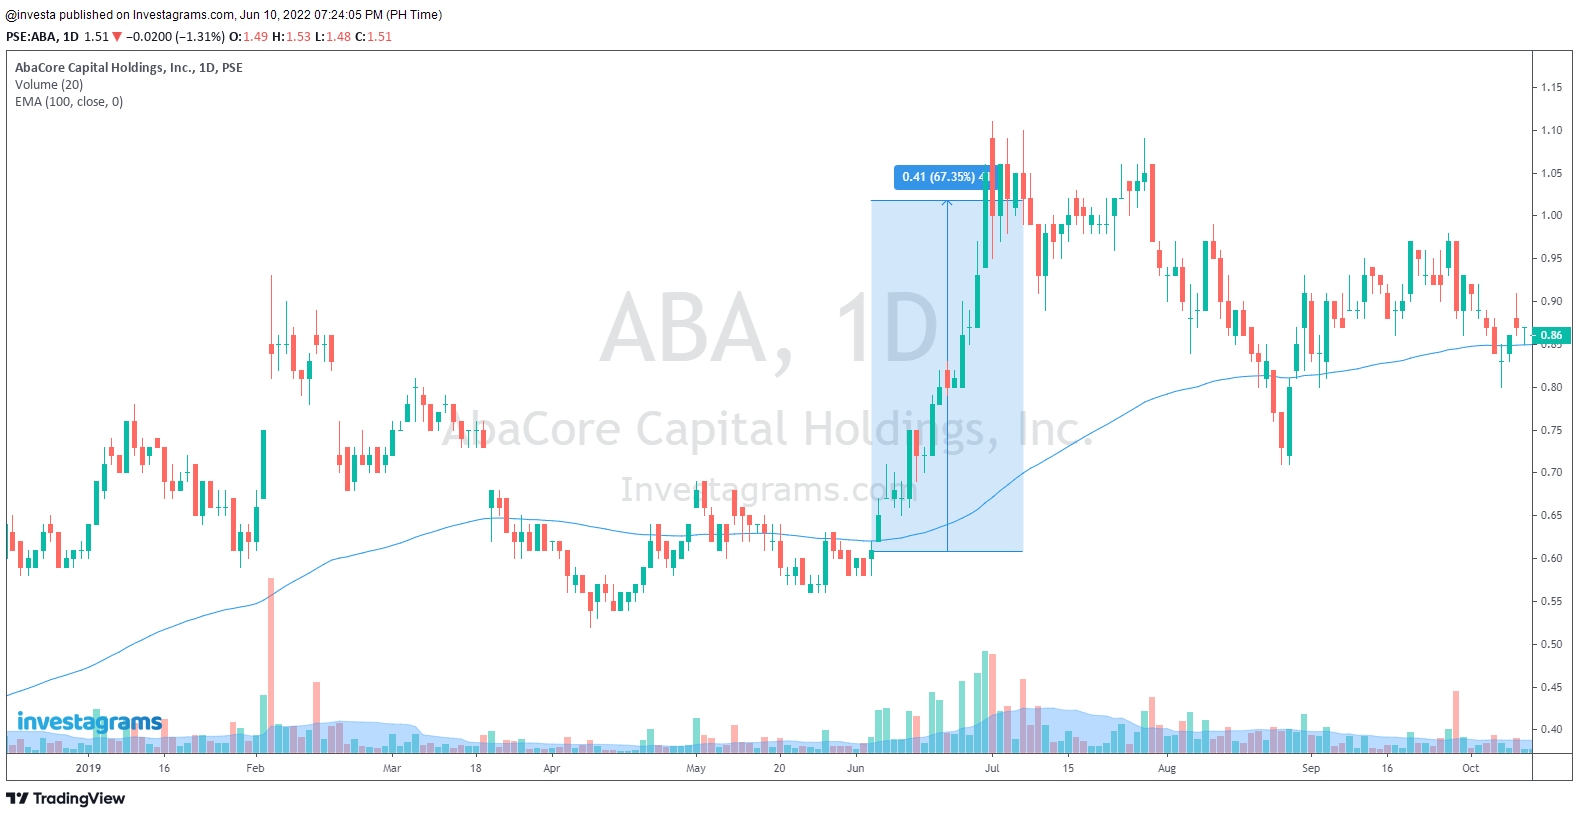
Although JP Morgan wasn’t the main seller during the selldown for ABA back then, you would see that there was a significant drop in volume. When JP Morgan stopped aggressively buying, there wasn’t enough demand from other buyers to even just sustain share prices. The takeaway here could possibly be that for short-term trading, aside from big shareholders dumping their shares, you also need volume to come in and participants to hold net positive amounts of shares in order to sustain rallies.
There are a lot of things you can learn by just learning how to read broker transactions. When paired with technical analysis, you can gain helpful insights into what others are thinking about the stock. You just need to take the time to gain experience and to know how different situations can play out.
Aside from having access to the Investa Stock Jockey, having an InvestaPrime subscription lets you gain access to a lot of other powerful tools and educational material that can help you progress no matter your current skill level. Want to know more about what we offer? Head on over to the InvestaPrime landing page to look at all the features that we provide to our subscribers!