On June 24, 1987, a baby boy was born in a town in Argentina. While he was perfectly healthy by normal standards, he grew up much smaller than kids his age. Later on, he was diagnosed as having GHD or Growth Hormone Disorder and wasn’t expected to become taller than 150 cm in height.

Source: Google CTO
As soccer in Argentina and in most of Latin America was as close to people’s minds and hearts as their religion, the child inevitably became hooked with the sport.
His coaches of course thought that while his obsession and dedication to practice was admirable, he is not likely to become anything more than one of the countless youths that took on the sport and enjoyed the competition.
The limitations posed by his GHD was an obvious hindrance to whatever future he may have in soccer. After all, this is a sport where size mattered, and it would be unthinkable for anyone of such small stature to become of some significance. But while the odds appear bearishly insurmountable at this point in his life, a fast forward will reveal otherwise. We’ll come back to his story a bit later.
On a parallel but alternate universe, this man we all remember by the name of Michael Clarke Duncan was a familiar face in Hollywood movies. His imposing physique lent credible personas to a few memorable characters that am sure a good many may have seen.
At a glance he is an epitome of health, strength, and everything fit and muscular that many men can only dream of becoming.

Source: PETA
Michael Clarke Duncan was as bullish as any representation of what we aspire for and his conversion as a VEGETARIAN was to become a welcome endorsement to the healthy lifestyle movement.
But as fate would have it, it was not meant to be. He died of a heart attack in 2012 at age 54. Not exactly the story book ending that we may have expected.
As for the kid from Rosario, Argentina who for his “shortcomings” wasn’t given much of a chance by coaches and soccer fanatics, he is at present worth around USD400M and is considered one, if not the greatest in the world of soccer. His name, LIONEL MESSI.

Source: Google CTO
So what is my point?
In life, as it is in TRADING and INVESTING, what we see is not always what we get. As most who dabble in the realm of Technical Analysis (TA), the quest to find the next best trade lies in identifying if a stock is BULLISH or BEARISH. And since the PHL is a long only market the only option is to find one dominated by the bulls and avoid names where bears tend to prowl.
Hence the problem, how do you get into that trade where the end result is one that leaves a smile on your face from locking in gains or profits? Does TA really provide good probabilities in searching for that prospect?
The answer: IT IS ALL A MATTER OF PERSPECTIVE.
As in the above examples, what may look bearish may actually be a sunken ship with long lost treasures. Or bull-strong moves to new all time highs might already be the top of a cliff with bottomless chasm as you take the next step.
Let’s take for example this chart of Jollibee Foods Corp ($JFC). Since it was introduced in the stock market in 1993 at a little over 6 per share, it never looked back as its value grew by leaps and bounds.
Even after the 2007 crisis, it merely consolidated for a couple of more years before we saw it breakout from around the 50s level and into the triple digits. And up to until early 2019, $JFC found the zenith at 328+/share. For the last decade, it was the most bannered company highly regarded by many as the ultimate corporate success story for the country.
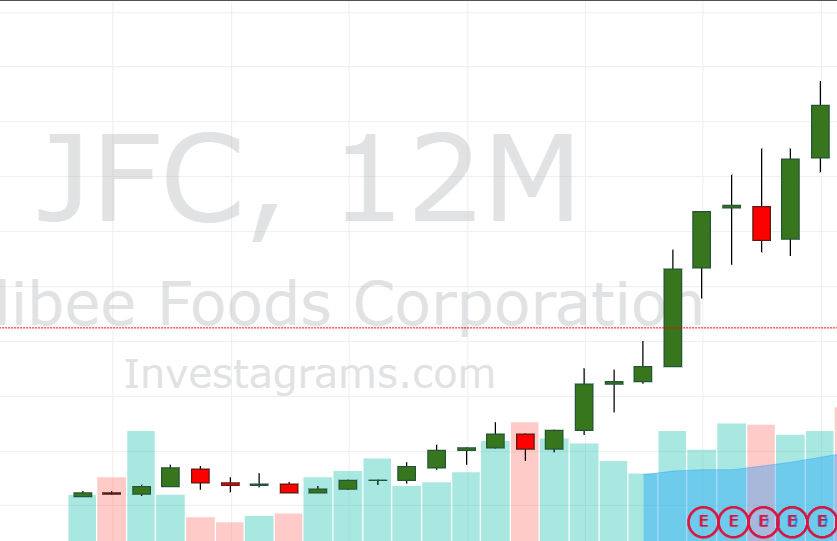
And of course, this yearly CHART says it all.
And for INVESTORS, the long term promises more rewards and the continued local and international expansions appeared as very good prospects. That was what many thought. In hindsight, the market was already then factoring certain “value-challenged” acquisitions, such that in February 2019 it started to hold back the bulls from charging higher.
Of course , and now also an afterthought, many were of the mind that $JFC was again just consolidating gains; a pause before resuming the trek to the stars. After all a stellar past performance and this long term chart speaks for itself.
As a personal flashback, I distinctly remember certain conversations with relatives and friends on a Christmas occasion in 2018 where I was asked if JFC would make for a good long term investment. Knowing what I saw in the monthly frame chart, I politely told them that upsides were already limited at that point.
Of course there were exchanges as to how the fundamentals are great and all those similar praises, but having my faith in technicals, I simply smiled off from getting into any argument.
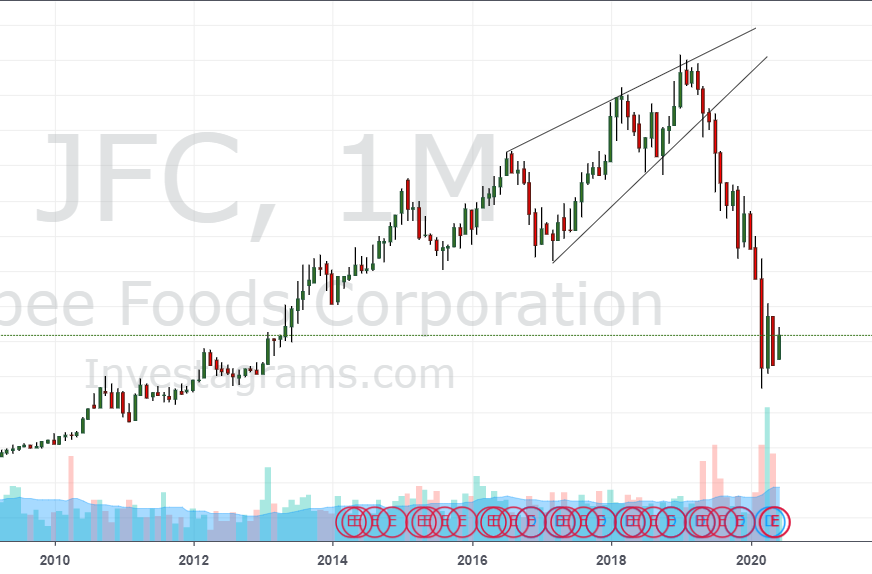
Because for TA believers as myself, there can only be very little doubt that a BEARISH RISING WEDGE had already formed in the near term perspective.
And as can be seen clearly in this monthly frame chart, its post effect was simply catastrophic.
MULTIPLE TIME FRAME ANALYSIS
In the mid 80’s, now a renowned trader and book author Dr. Alexander Elder made popular the concept of TRIPLE SCREENING. Being a man of science in the medical field, the standard practice was to have a patient go through a series or a battery of tests. This is obviously done for the purpose of correctly diagnosing a disease or simple ailments that a patient may be going through. As only after all proper examinations are run and cause identified, can prescriptions and or interventions be given to a patient.
Dr. Elder translated this simple idea into the realm of technical analysis. He espoused that looking at a chart in its different TIME FRAMES, specifically in the daily, weekly, and monthly frames can give a trader the objectivity to make a plan on how to trade that name. Dr. Elder’s bestsellers TRADING for A LIVING, and COME INTO MY TRADING ROOM are must-read books for beginners and intermediate traders.
And as we are now more advanced in our charting capabilities, we take this TRIPLE SCREENING concept a step farther and add other layers of INTRADAY frame charts to give us more in-depth views of price behavior and action. Thus without a doubt, our ability to make MULTIPLE TIME FRAME analysis, immensely and especially enjoyable using INVESTAGRAMS charts, are indispensable tools that can provide us with the most reliable information.
BULLS AND BEARS LIVE IN ONE ECOSYSTEM
Markets or stocks are usually labeled as either bullish or bearish. Both go through range-bound price action which we call and mark as areas of consolidations; In plain speak, PAUSES before it resumes to the path or whatever the trend it is on.
Corrections happen in bullish names, as bounces also occur even in a bearishly trending environment. The practical reality is that there are bears in a bull market and bulls in a bear market. The only question is who dominates the majority of the time.
Multiple time frame views will almost always correctly tell us how to formulate and manage expectations. As the analyses and conclusions will differ in each time frame (intraday, daily, weekly, and monthly) it is IMPERATIVE that one must focus on the time frame from which your trade is taking place in. The patterns that show up in the different time frames will have its own probability of realizing its potential. In the long term however, the ongoing trend should also likely prevail.
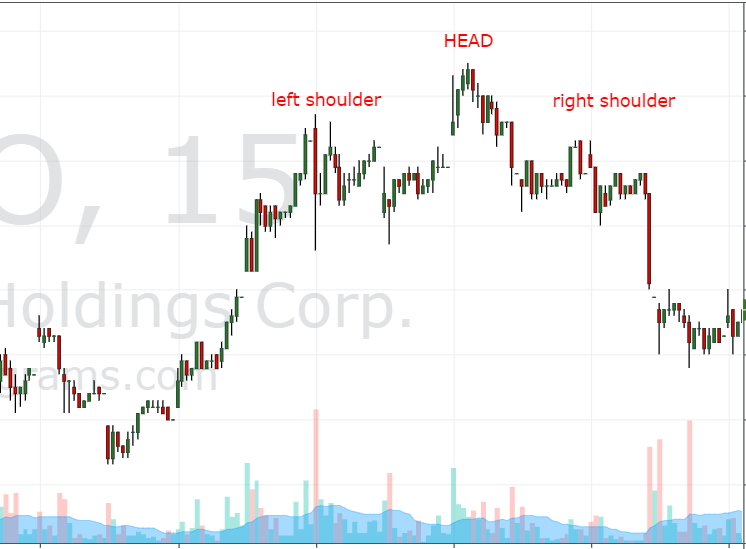
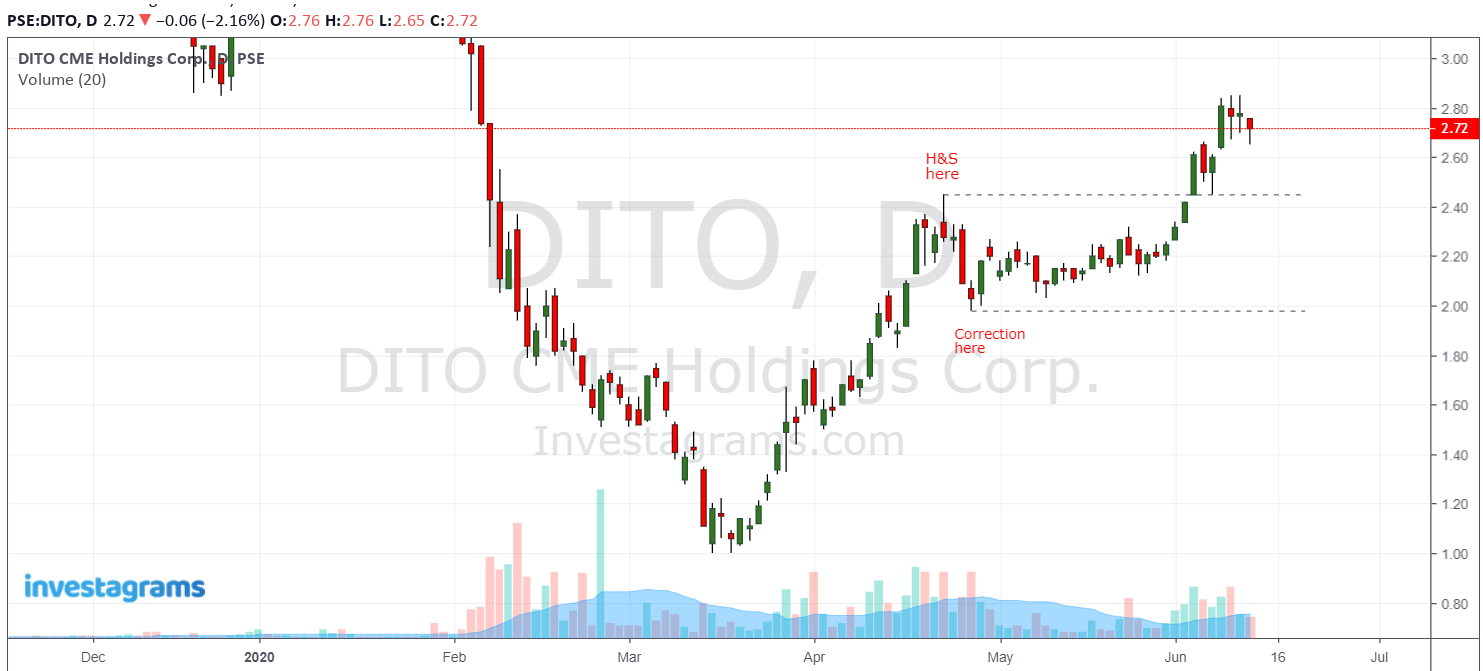
Take for instance this illustration of a 15-minute chart for DITO CME Holdings Corp. ($DITO) recently.
While this bearish head and shoulders pattern attempted and successfully achieved the expectation, the correction in this shorter time frame view presumably only spurred more participants to enter at the lower price points during this pullback.
Eventually, the bulls took over and the uptrend resumed as can be seen here:
To sum up, here are the key takeaways, we must all remember:
1. Technical analysis must always be FLEXIBLE, as patterns will occur in different time frames. While forming a bias is necessary to commit to a trade, it should never be rigid that it rejects what price action is actually saying.
2. The higher time frames will at most times be more significant. Most corrective pauses or consolidations will likely just become CONTINUATION patterns to the prevailing trend.
3. Multiple time frame analysis is essential in framing one’s expectations. It gives an objective basis to formulating trading plans and creating strategies.
Playing the market means learning to live with the bulls and the bears. It is most important that we recognize that they both lurk in the backstage. And when they each make an appearance to find the spotlight in moments we may least expect, we should all be ready to welcome them with open arms.
Although not necessarily with open positions since ours is a long-only market.
At present, the idea of short-selling being finally allowed might be as far-fetched as finding mythical fire-breathing DRAGONS sweeping through the ticker.
Oh well, nothing wrong with DREAMING. Hope springs eternal.
Contributor:

Name: Jojo Gaston
Investagrams Username: @JojoGaston0
About the Contributor:
Jojo Gaston is a partner/mentor at BoH Society, an online trading support group that provides traders’ education, and data-driven trading format for local stocks, forex, and other foreign markets.