
If you’ve read “Reminiscences of a Stock Operator”, which focuses on the life of Jesse Livermore, you’ll know that he emphatically states that one should focus on stocks that are near The Line of Least Resistance. A stock that is at this area is hovering near its 52-week high or all-time high levels, meaning that only a little demand can send a stock flying. By committing your hard-earned capital on these types of plays, you can expect a high probability of making the most amount of money in the least amount of time.
You may be asking yourself, “How is this possible? How can you make the most amount of money in the least amount of time?” By focusing on stocks near their 52-week or all-time high levels, you take off you watchlist all the laggard stocks and begin focusing on only the leading stocks in the market. This is especially effective during bull markets as stocks that create new highs tend to never pullback, so it’s best to get in when a new high is made.
So how does one find The Line of Least Resistance? One way to find it is too check longer-term timeframes, like a weekly or monthly chart, to plot the significant resistances that, if broken, can lead to an explosive move. Once you’ve plotted these points, you can go back to the daily chart (or whatever timeframe you prefer) and create your trading plan.
Here are some examples:
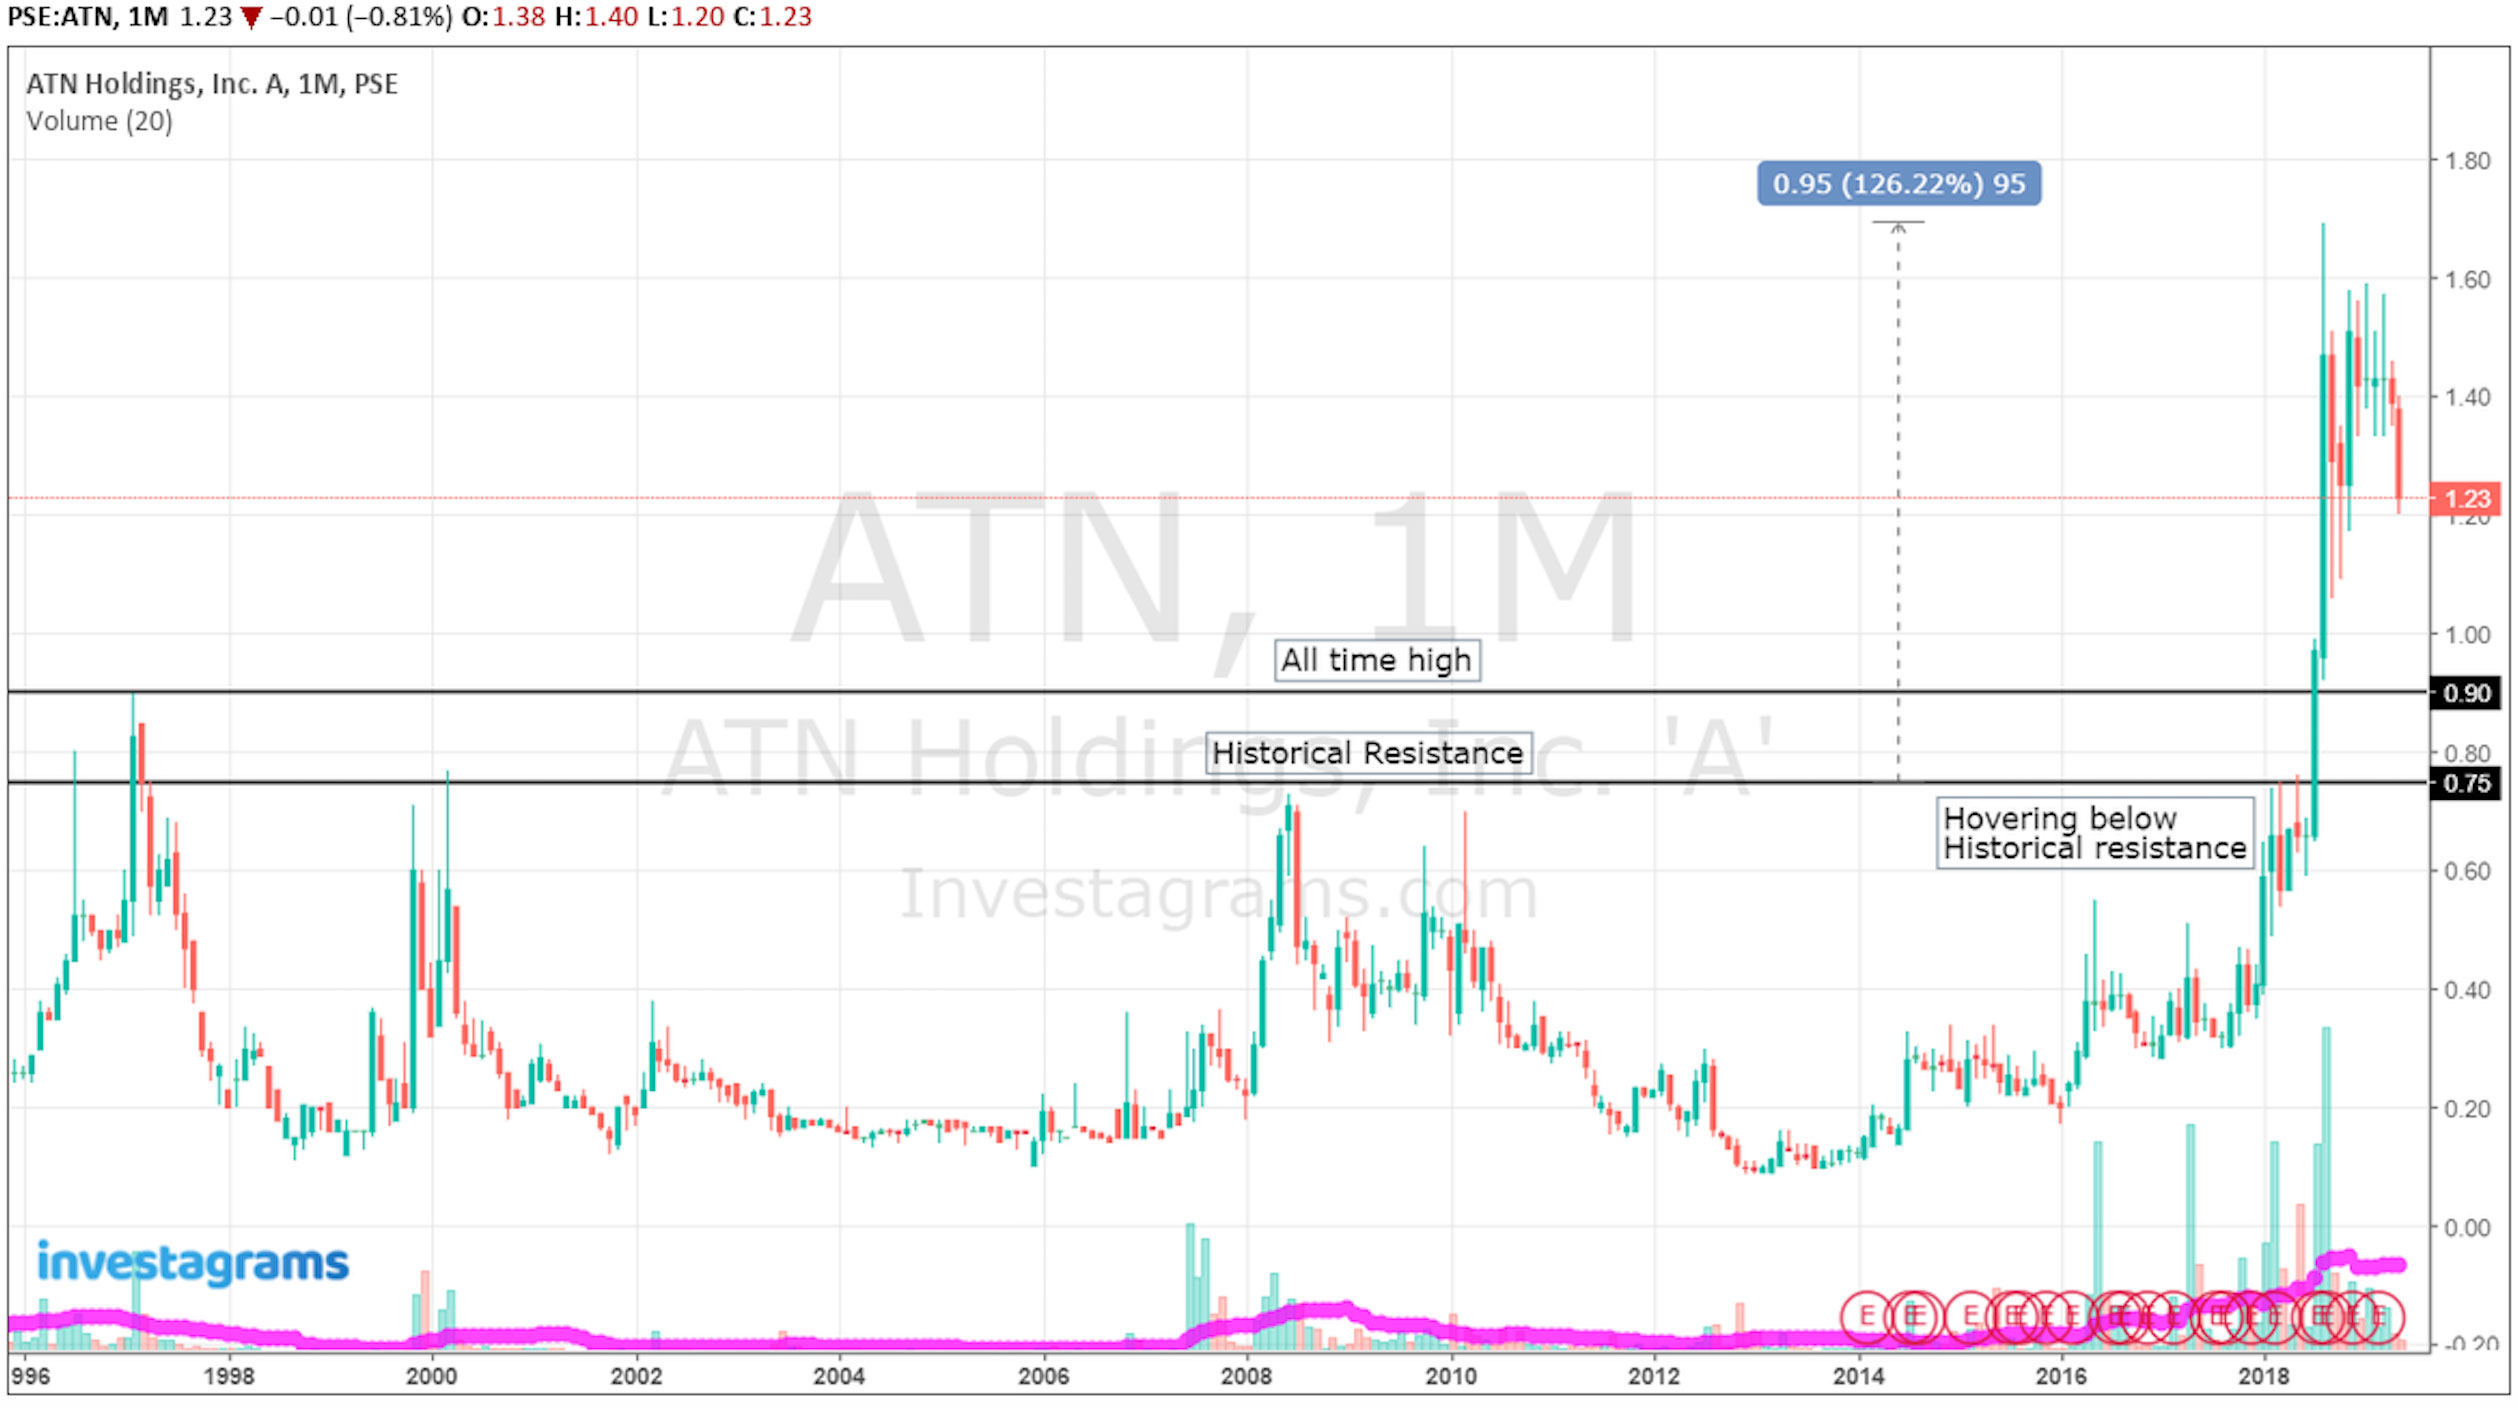
$ATN (ATN Holdings, Inc. ‘A’) was one of the alpha plays during 2018’s deep market correction. Despite the PSEi continuing to make lower lows and break all sorts of support, $ATN was simply hovering at the highs. Taking a look at its monthly chart, .75 is an area where $ATN had a difficult time breaking while its all-time high price is at .90. This means if $ATN can break and successfully close above .75, there’s a high probability for an explosive breakout.
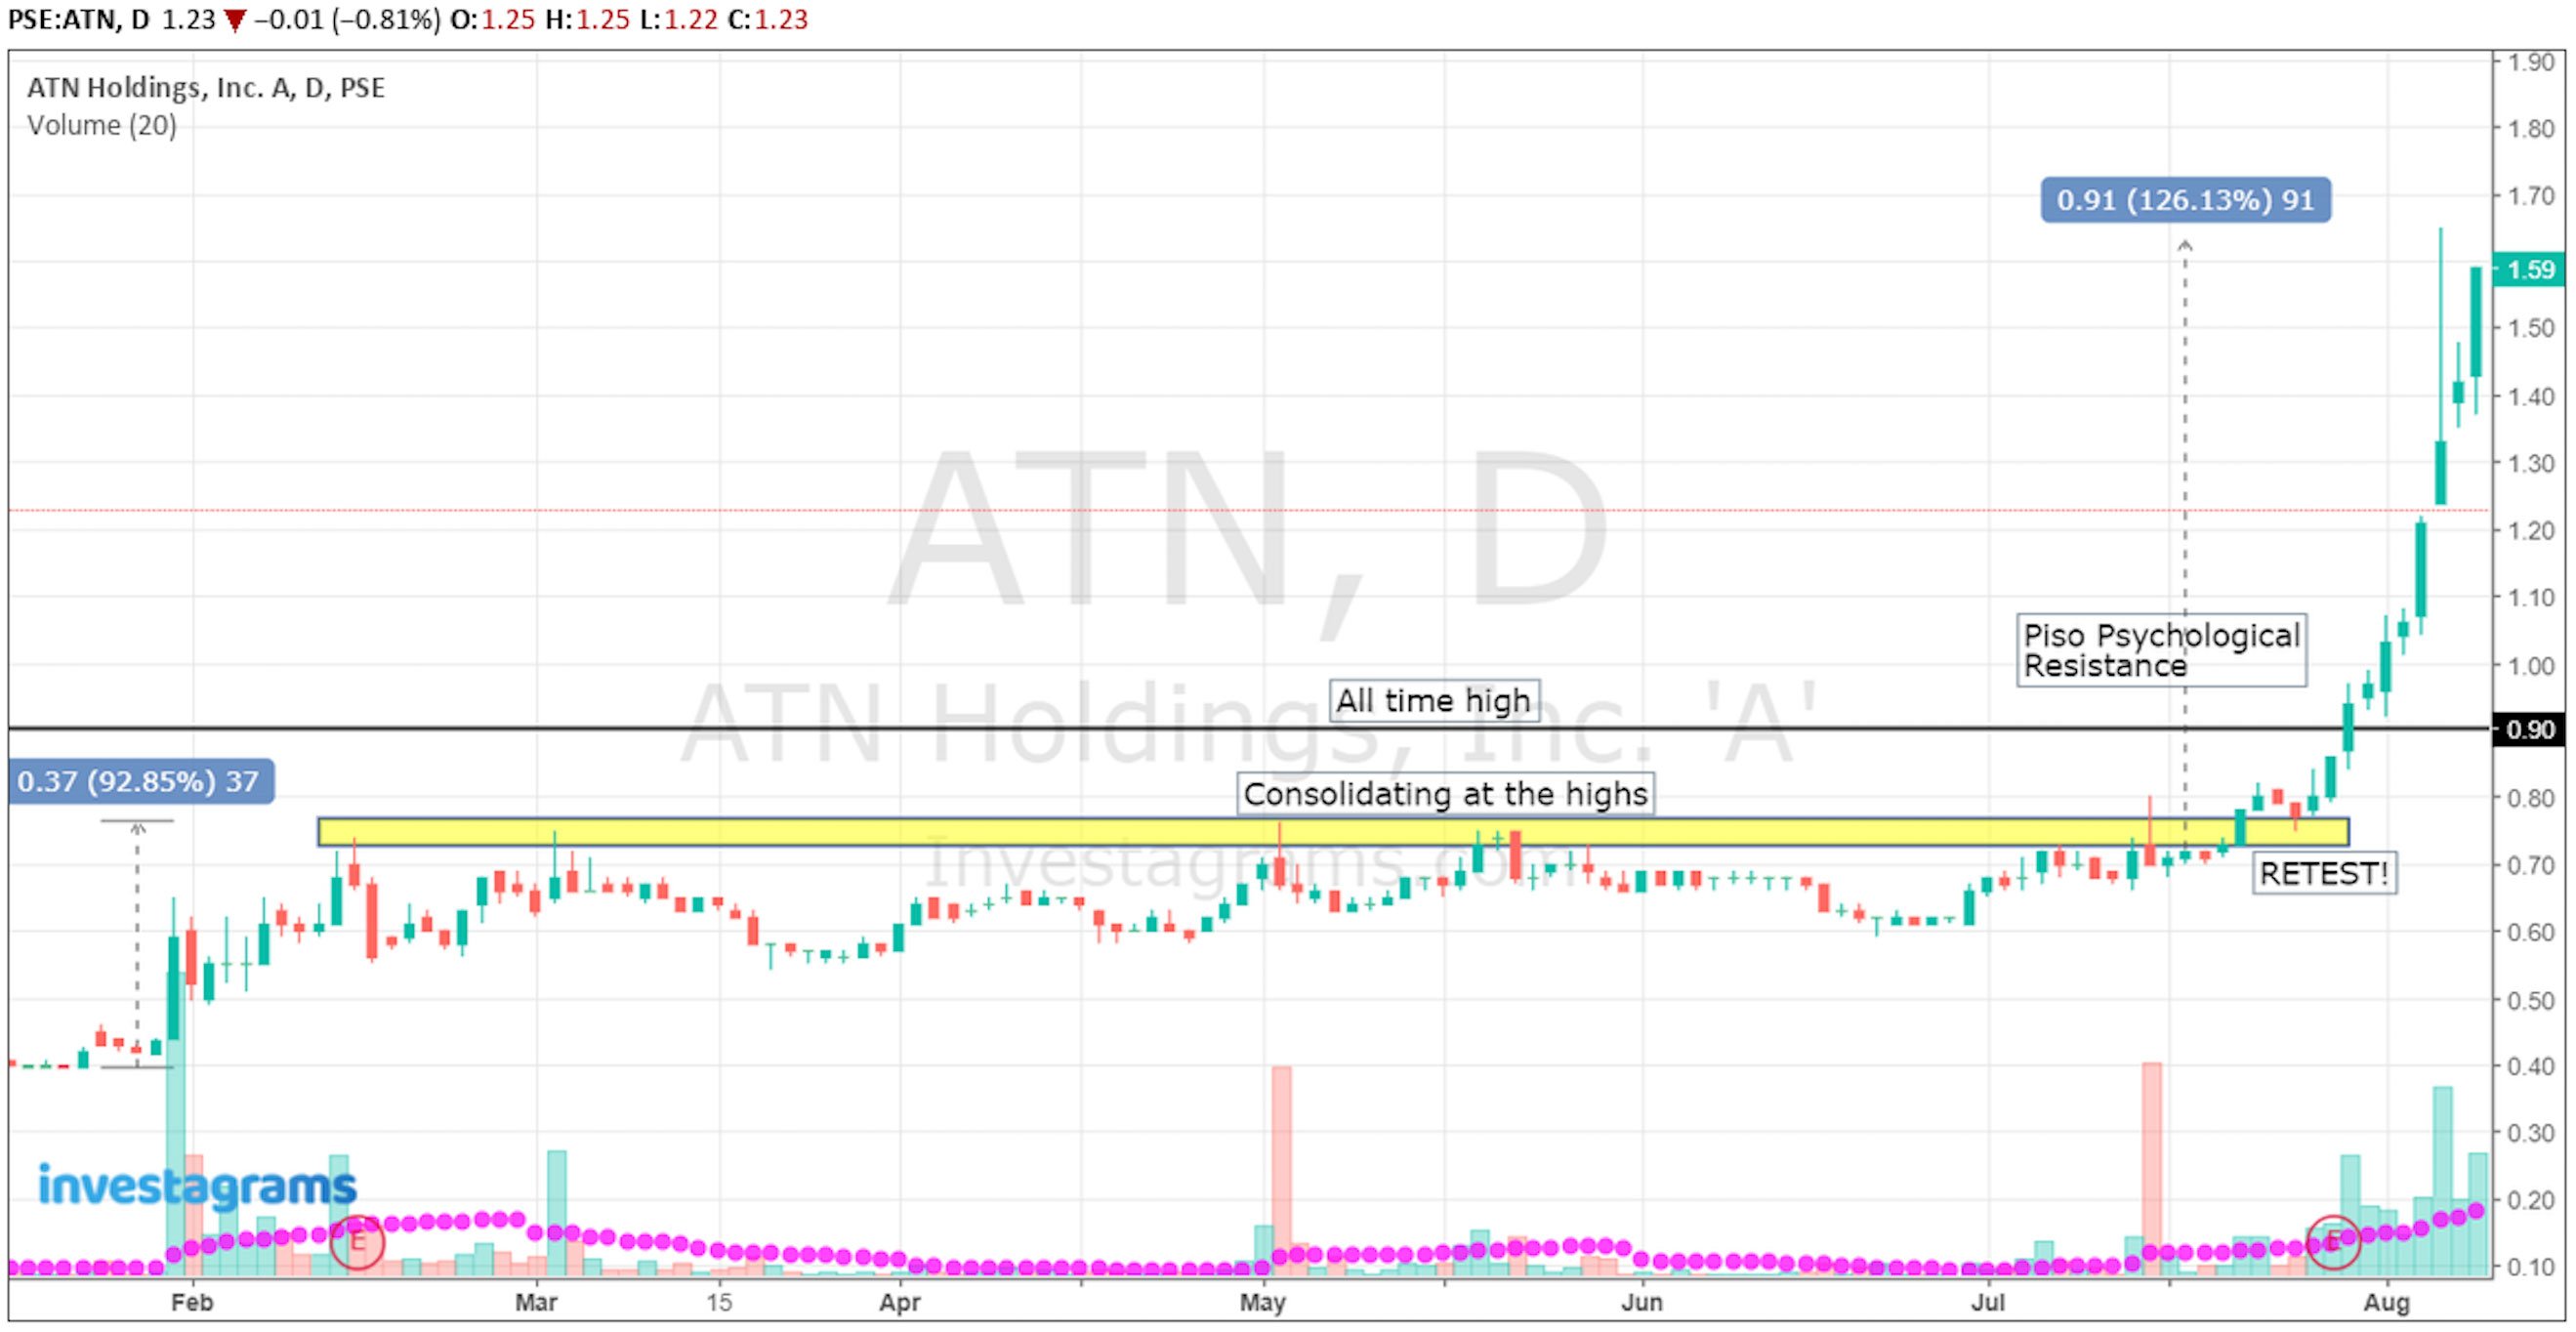
By identifying the significant area the stock needs to break, you can now create a trading plan on your desired timeframe. On the daily chart, we can see that $ATN created a six-month base from February to late July and tried to break its historical resistance five times before successfully doing so on the sixth attempt. After breaking out, $ATN gave those who missed out an opportunity to buy on the retest. After this, the stock skyrocketed to new highs and made a 126% move in only eight days!
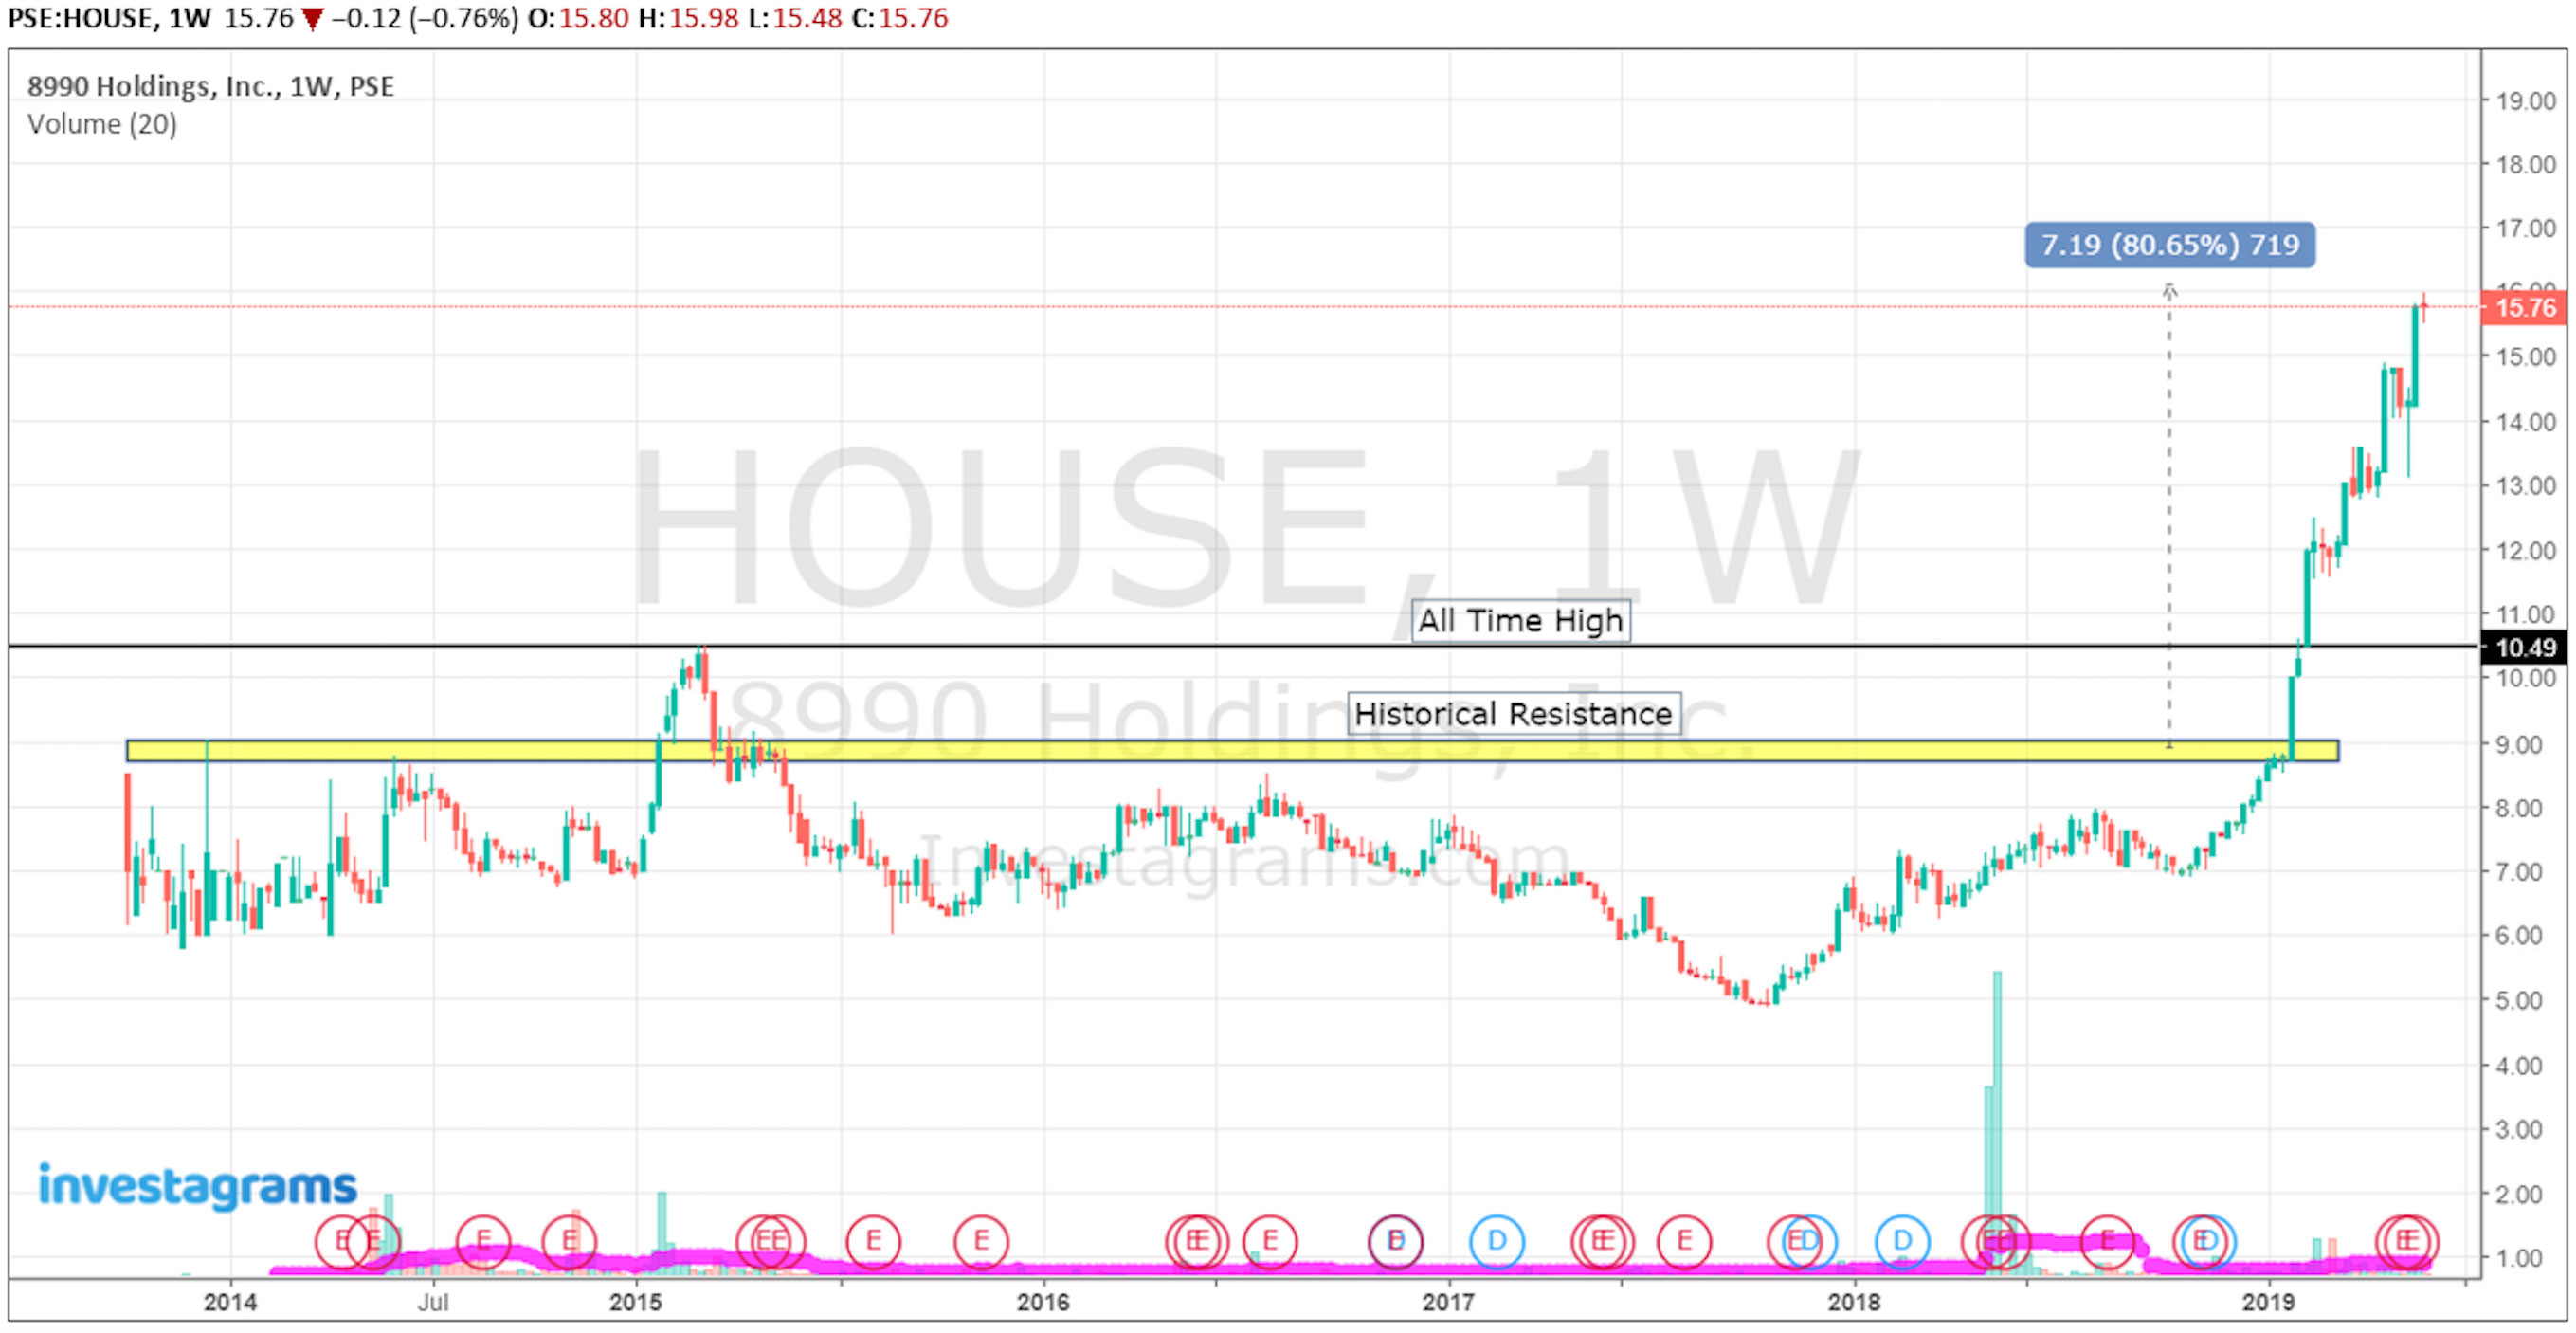
$HOUSE (8990 Holdings, Inc.) is one of the outliers in last year’s market, especially considering the bearish sentiment since the first quarter of 2018. Looking at its weekly chart, we can see that at the beginning of 2019, $HOUSE was right below its significant resistance at 9 pesos. While its all-time high price is at 10.50. After plotting these points, you can now create your trading plan on your preferred timeframe.
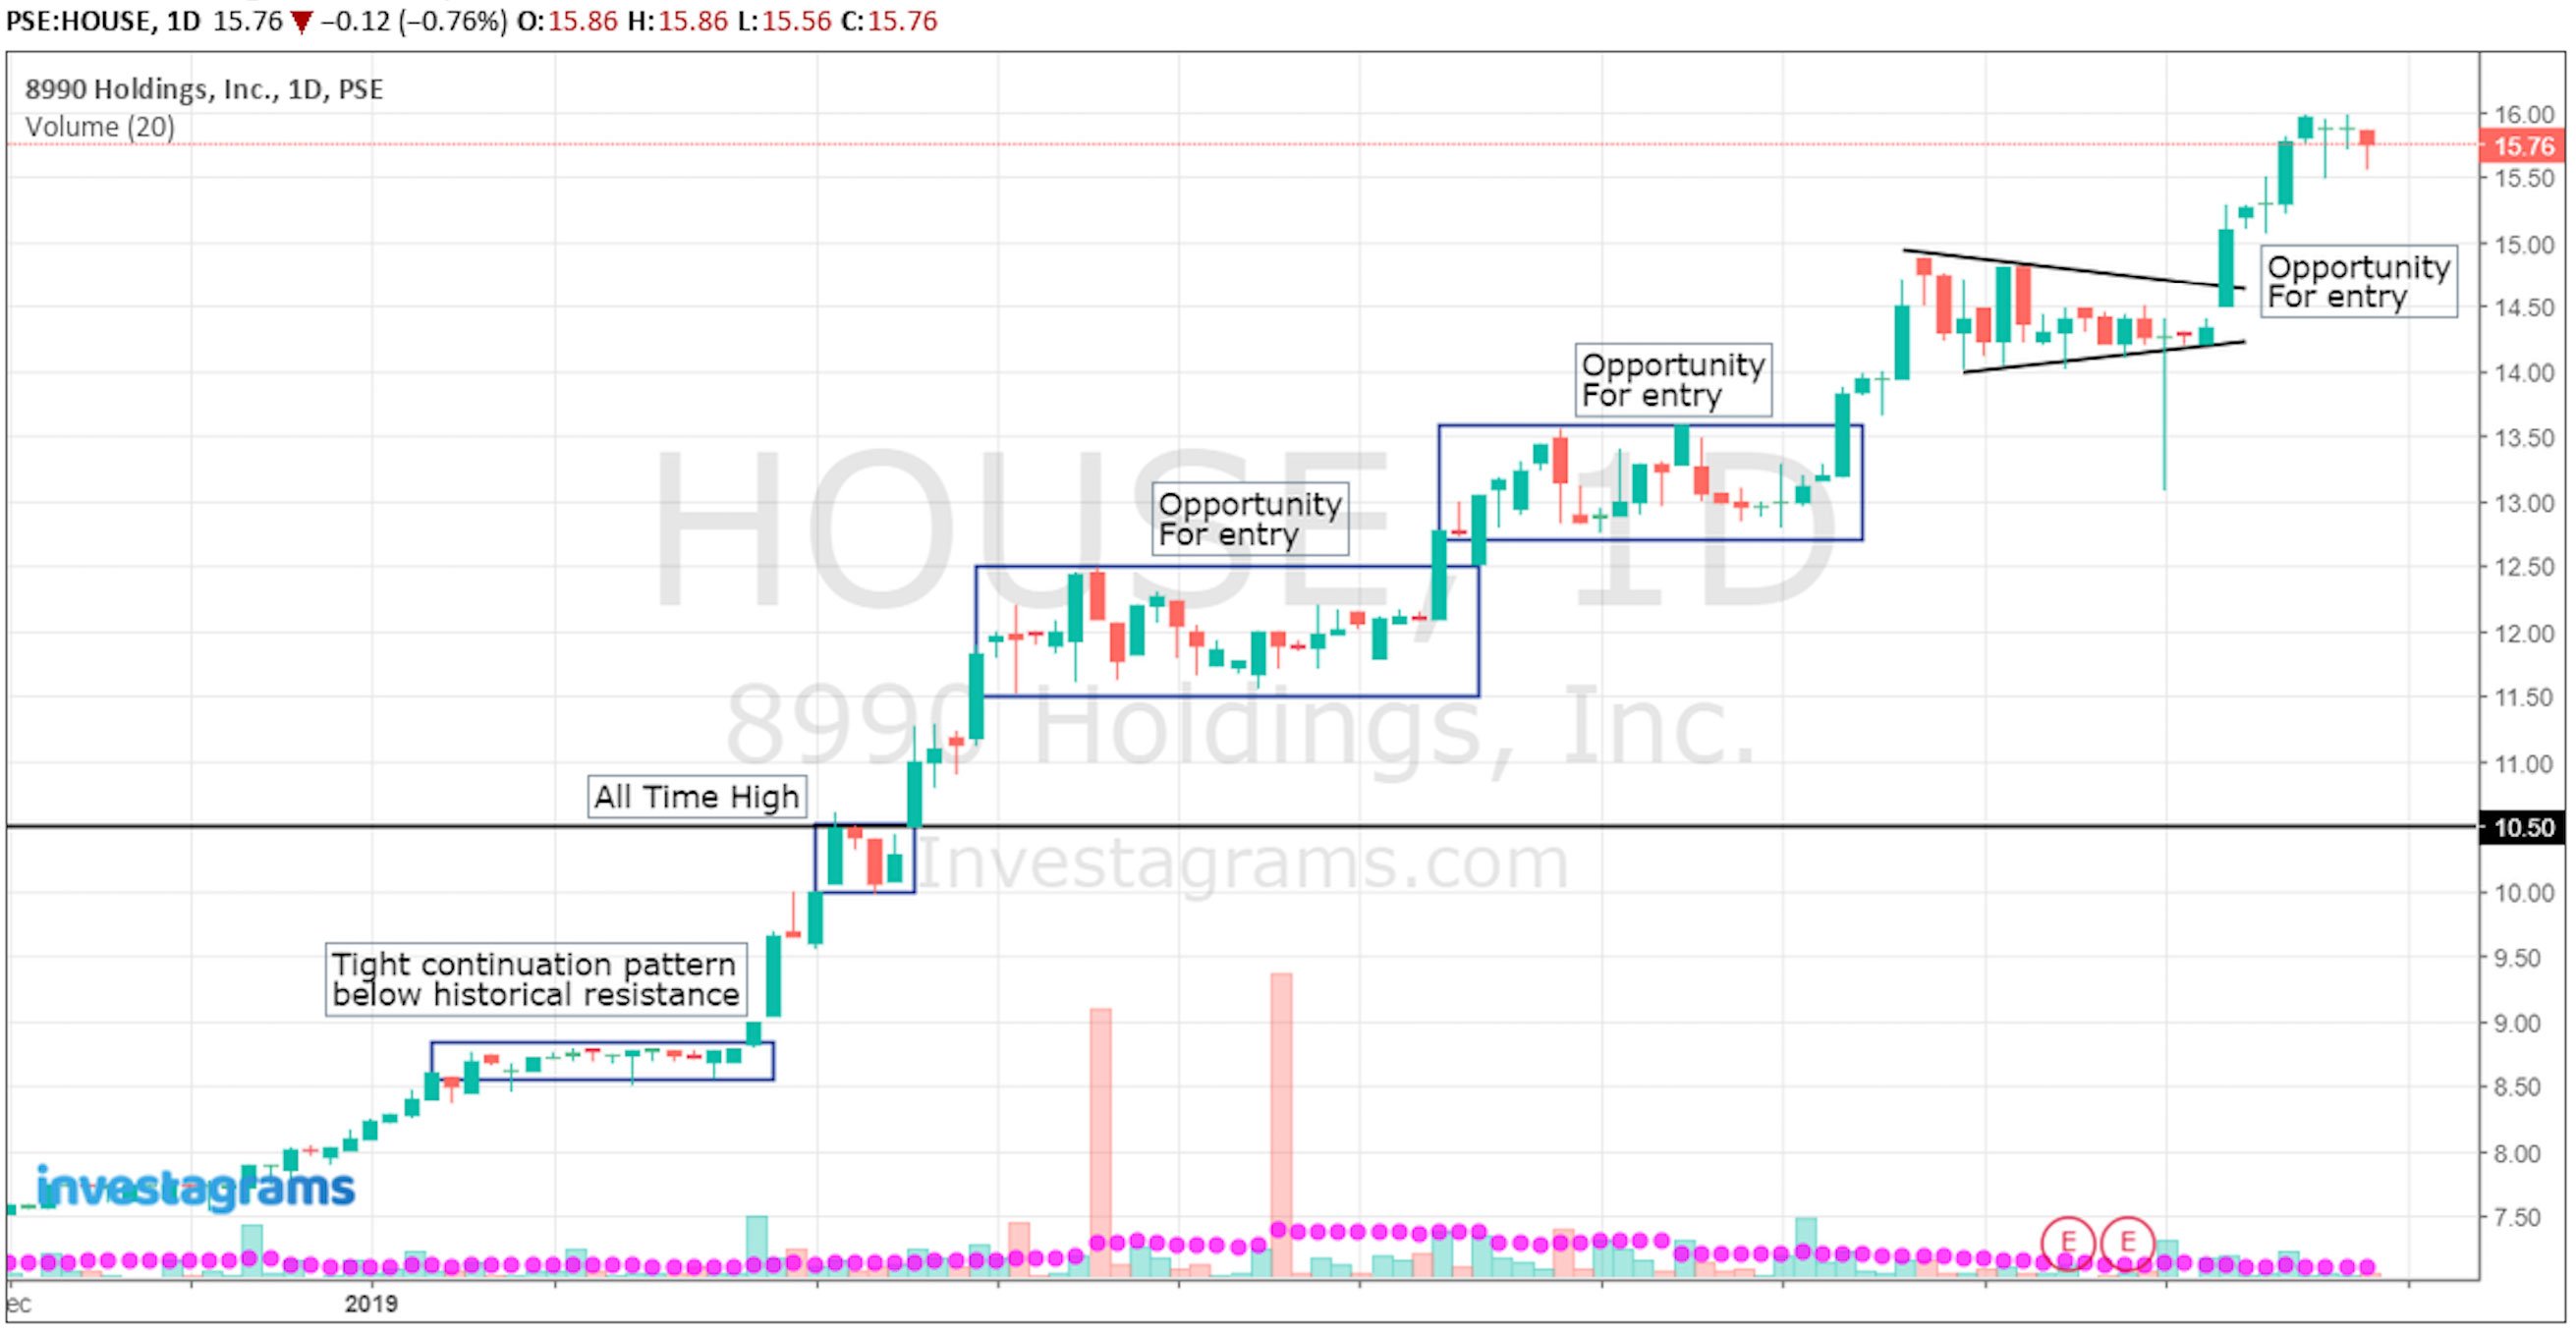
By looking at the daily chart, we can see that $HOUSE made a tight continuation pattern just below its historical resistance at 9 pesos. After breaking out of this pattern successfully, $HOUSE went through the roof and never looked back locking in an 80% gain for those who were able to purchase during the first breakout. The stock also gave several buying opportunities during the 80% move.
In conclusion
Just by knowing the importance of identifying The Line of Least Resistance can do wonders for your trading, especially if you focus on stocks hovering below their respective highs. By zeroing in on the market leaders, you effectively take out all the laggards that continue to drop while taking positions on stocks that remain in strong uptrends. The ability to identify and execute on The Line of Least Resistance will be a significant weapon in your trading arsenal, use it to your advantage!