Stochastic and Stochastic RSI are some of the most commonly used indicators of all time. Used by various traders, these indicators are oscillators that oscillate between 0 and 100 to change from periods of oversold to periods of overbought levels. They help determine the strength of the move and can give different entries and exits depending upon the scenario.
What are Stochastic and Stochastic RSI?
Stochastic and Stochastic RSI (let’s call them Stochastics collectively for simplicity’s sake) have two lines: the Stochastic line, commonly called as %K which measures the strength of the current move relative to the range of the previous n-periods, and a second line called %D which is a simple moving average of the %K.
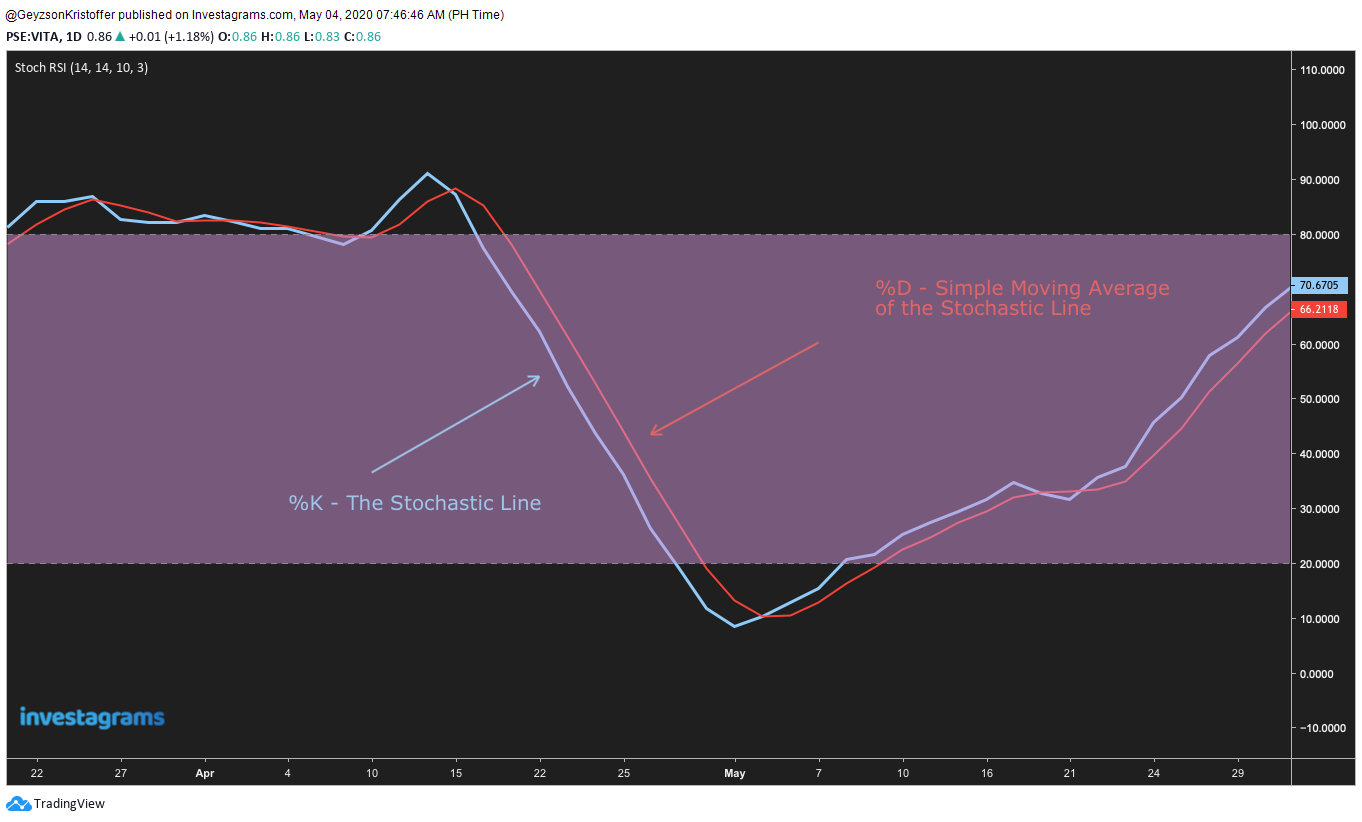
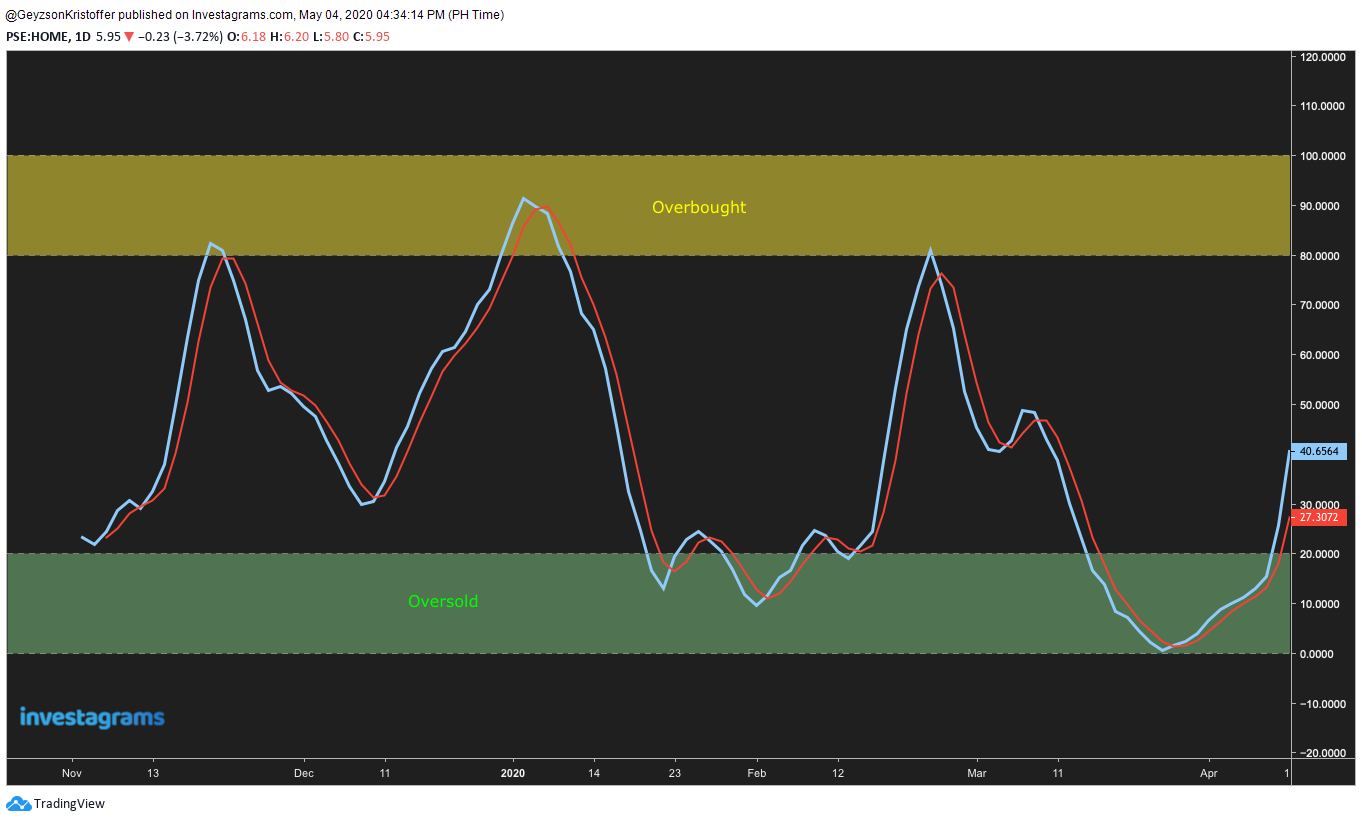
In addition, levels of interest are oversold levels which are values below 20, and overbought levels which are values above 80.
The standard configuration of a Stochastic Oscillator is a 1-period Stochastics line computed for the last 14-candles with a 3-day simple moving average on top of it. If you want a detailed computation of the values, click here.
The Difference between Stochastic and Stochastic RSI
The difference between them is that the Stochastic measures the strength of the current CANDLE relative to the previous candles, while the Stochastic RSI measures the strength of the current RSI VALUE relative to the previous RSIs.
Popular uses of the indicator:
1. THE CROSSOVER
A crossover happens when %K and %D intersects one another. If %K crosses ABOVE %D, the setup is considered bullish, but if %K crosses BELOW %D, the setup is bearish. Here is an example:
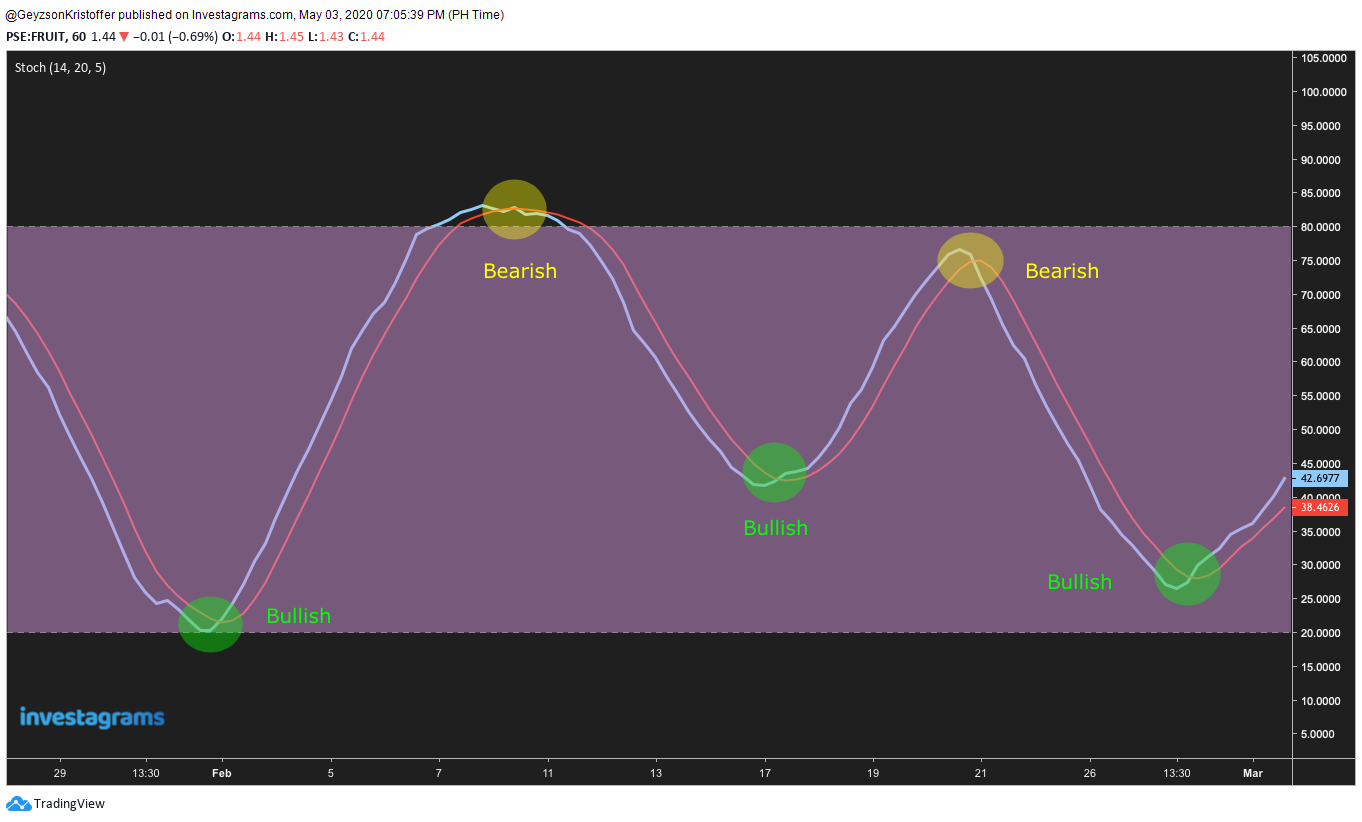
I personally don’t trade using this strategy as this gives way too much signals. In trading, you want your signals just to be on that sweet spot where it gives many signals, but not too much that you get in and out of trades too quickly. Balance is key.
2. DIVERGENCES
Divergences happen if there is a disparity between the movement of the price to the movement of the oscillator.
A bullish divergence occurs if the price makes a lower-low while the oscillator makes a lower-high.
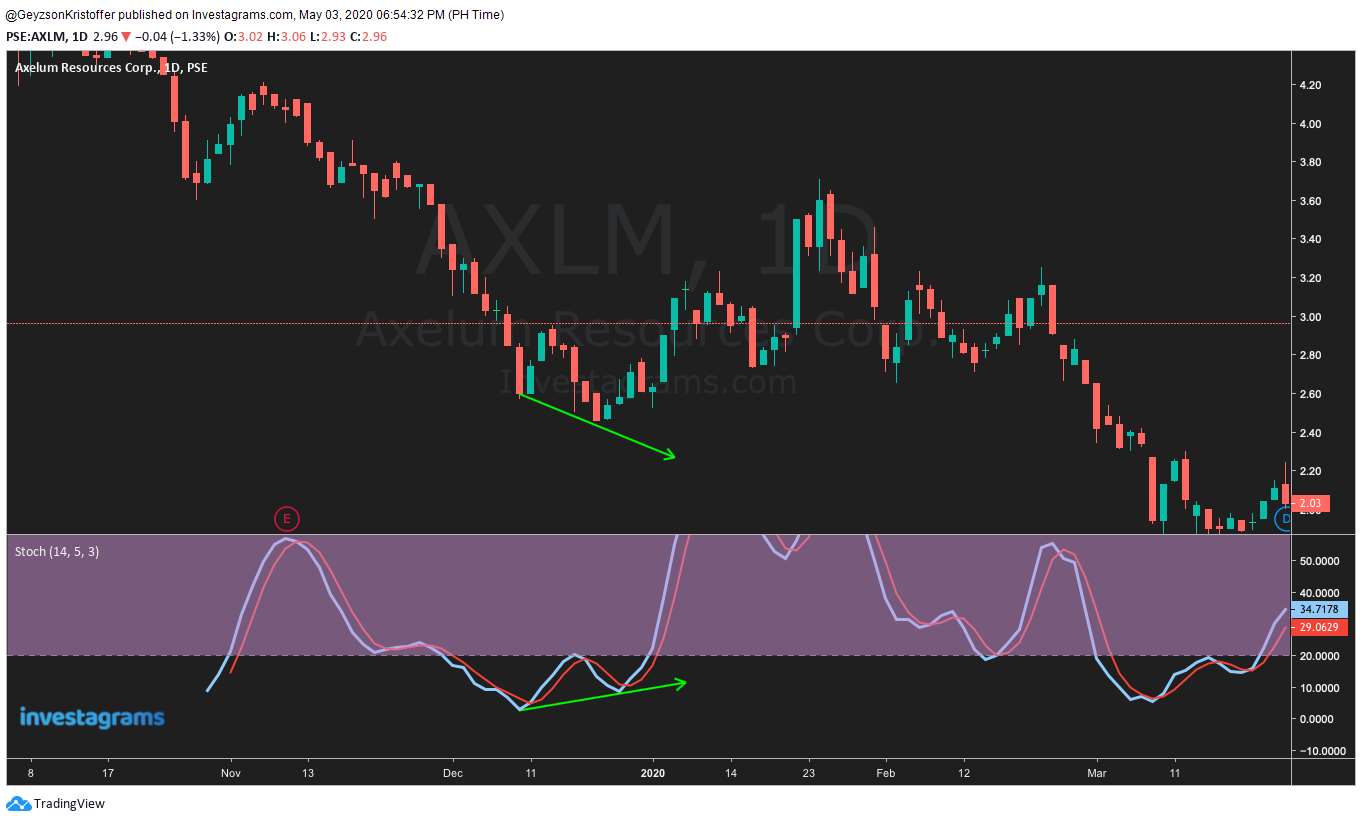
A recently IPOd stock, $AXLM formed a lower-low while the Stochastic formed a lower-high – A bullish divergence.
On the other hand, a bearish divergence occurs if the price makes a higher-high while the oscillator makes a lower-high.
Example:
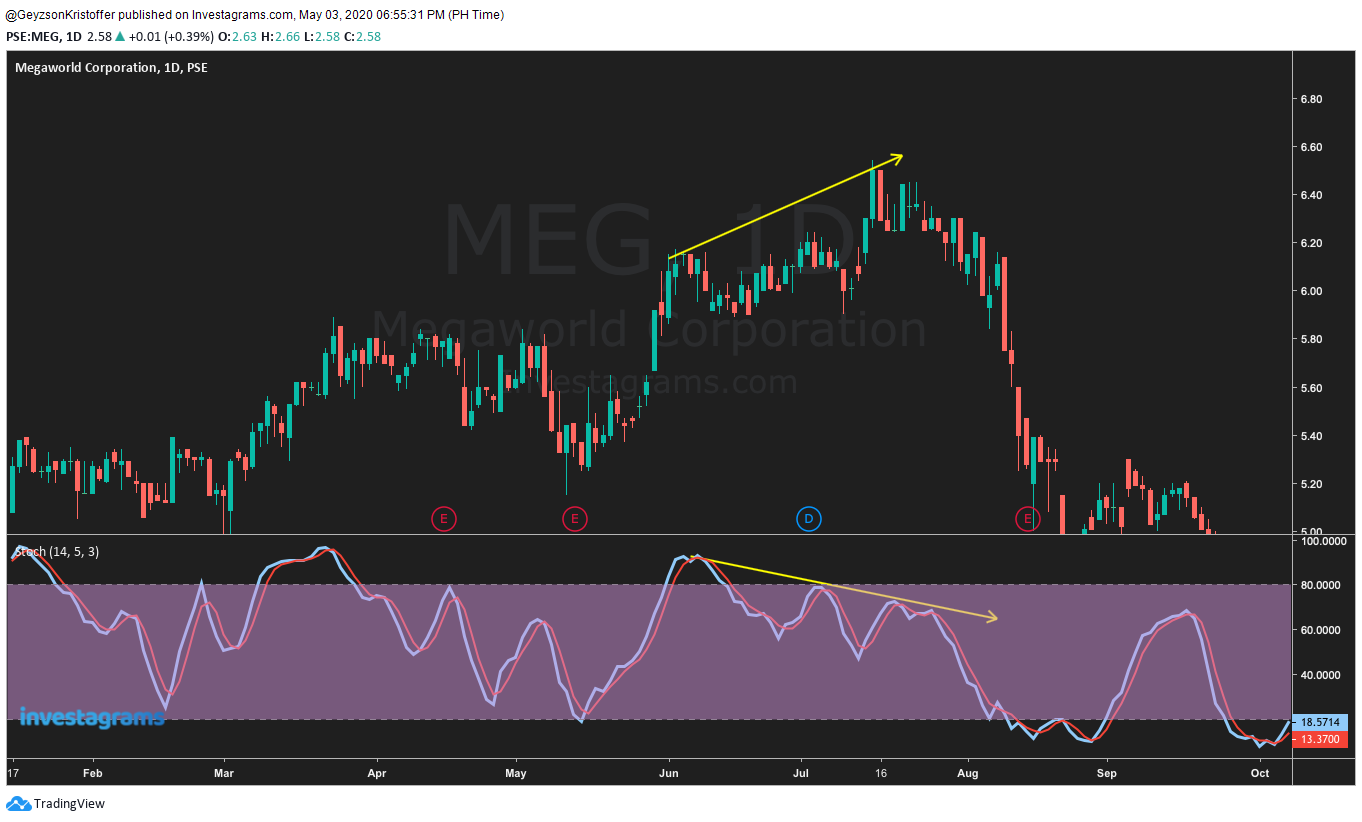
$MEG made a bearish divergence last June 2019 after the prices made their higher-high and the Stochastic made a lower-high.
3. OVERBOUGHT AND OVERSOLD LEVELS
Stochastics have levels where the prices are considered overbought or oversold. A Stochastic value of 80 and above is at overbought levels, while 20 and below is at oversold levels. Traders use these levels for buying and selling, that is, they buy when the prices start to go out of oversold levels and sell when they start to go out of overbought levels.
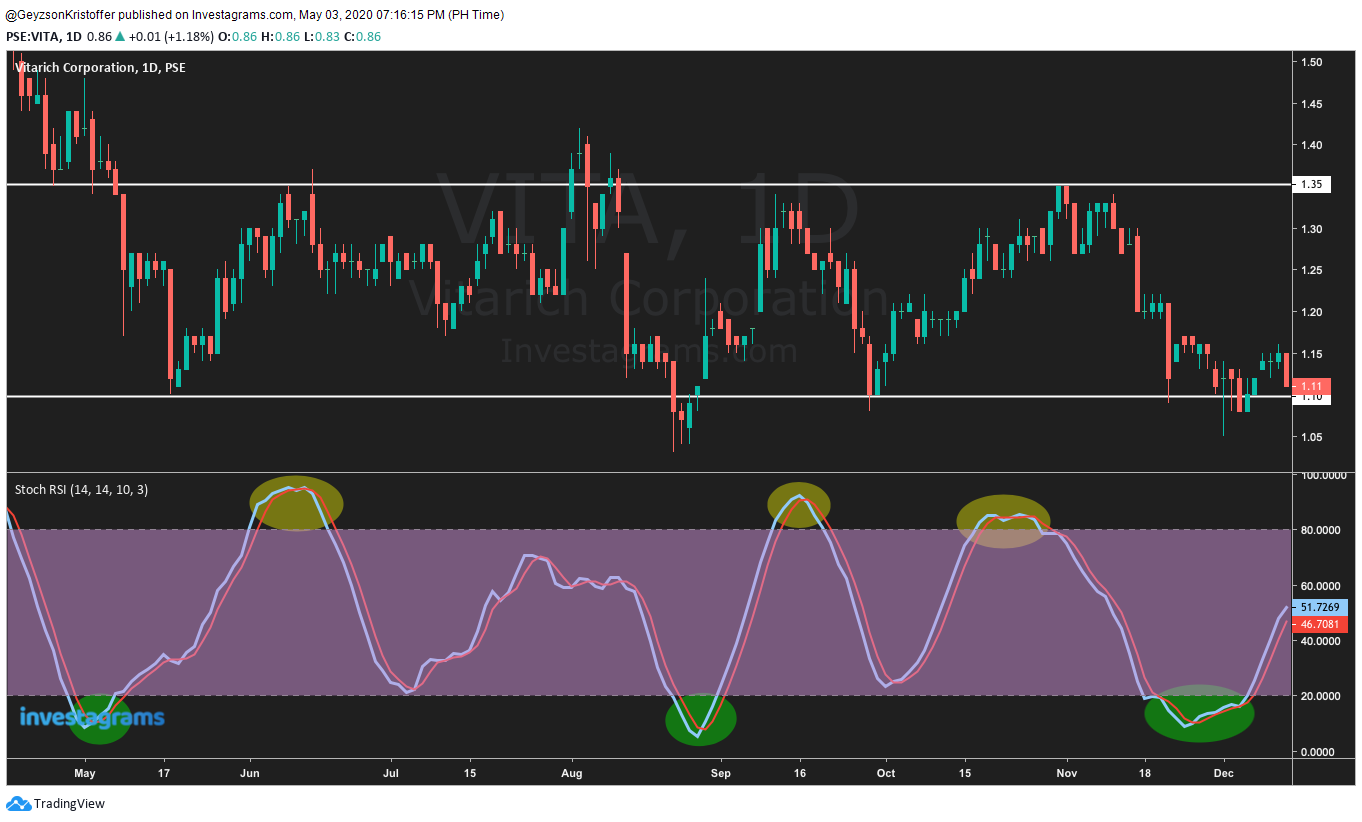
$VITA with a range-bound price action seems to reverse after hitting oversold and overbought levels.
But be cautious as this strategy appears to be only effective in a ranging price action. Since the markets are on a trend most of the time, using this strategy might become fatal overtime.
Below is an illustration about overbought stocks still going up by a significant amount and oversold stocks still diving down deeper.
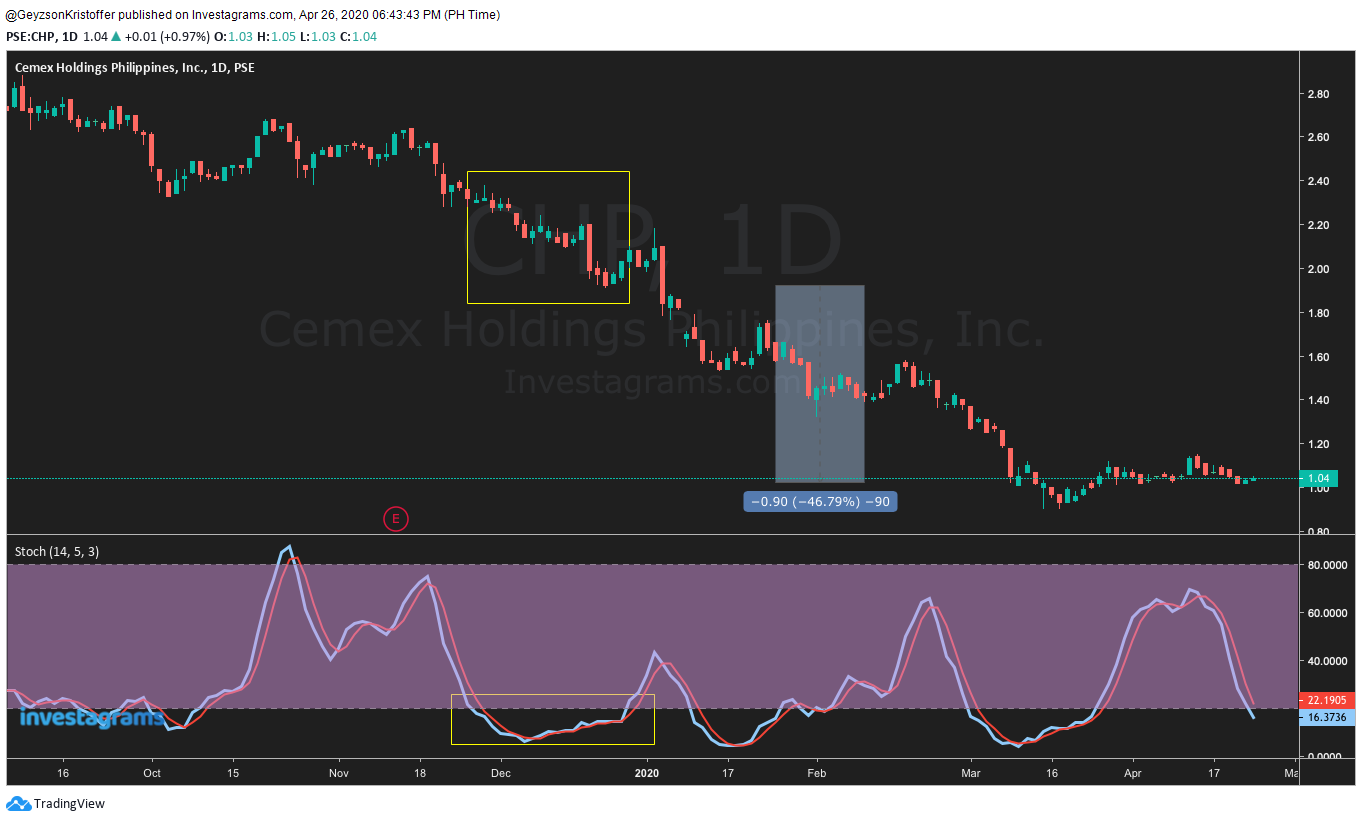
Oversold? After hitting oversold levels, $CHP continued to show weakness with more than a -40% move.
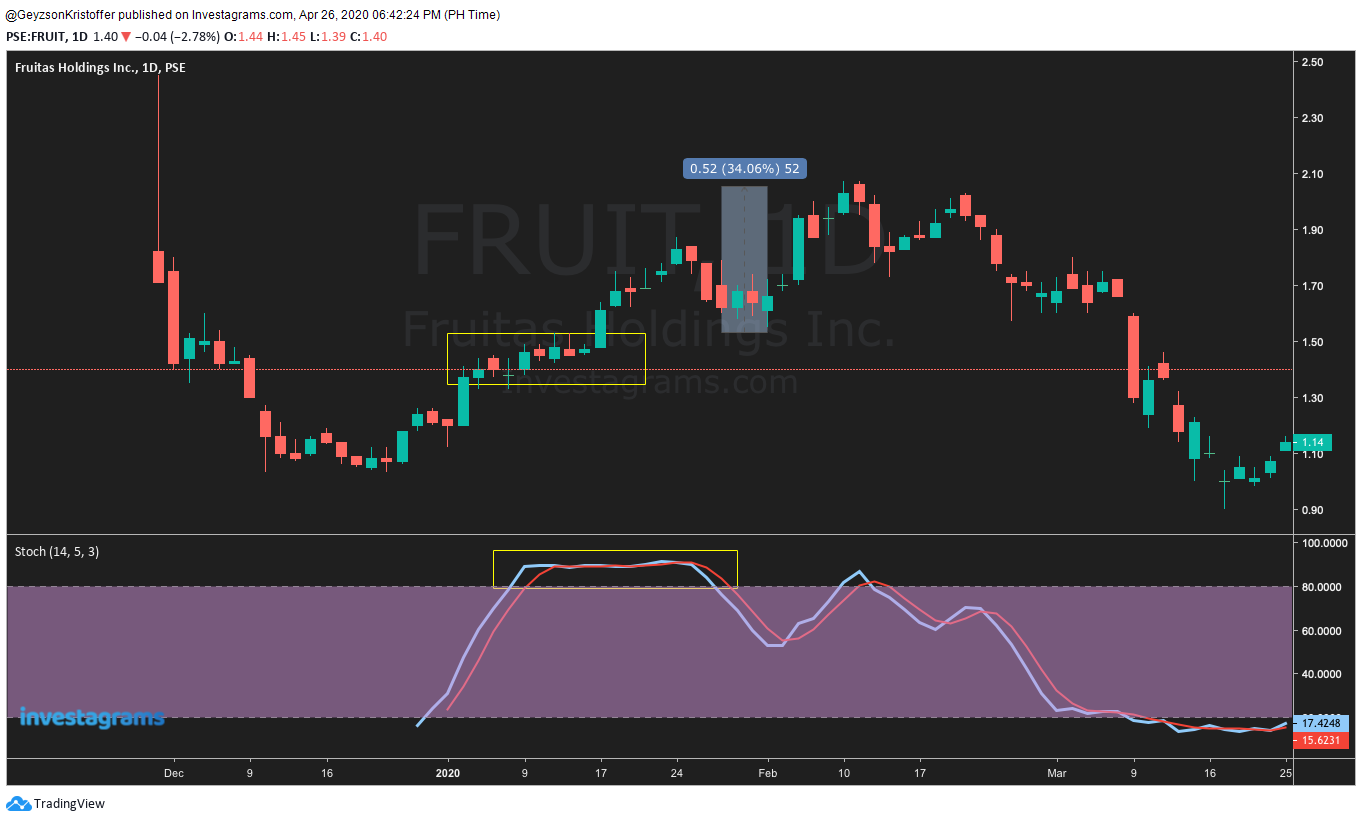
Overbought? $FRUIT went on and made new highs after hitting overbought levels. Showing that there are no overbought stocks for aggressive buyers.
This means buying when it is oversold and selling when it is overbought might cost you a chunk of money.
A better way to use Stochastics
Stochastics are computed based on the strength of the current price to the previous n-candles (or current RSI to previous n-RSI values), which means that Stochastic and Stochastic RSI are strength indicators. Using this information, we can infer the following:
- 1. Stochastics value above 50 shows strength and is in a bullish scenario.
2. Since a value above 50 shows strength, a value above 80 shows extreme strength.
3. Stochastics below 50 shows weakness and is in a bearish scenario.
4. Since a value below 50 shows weakness, a value below 20 shows extreme weakness.
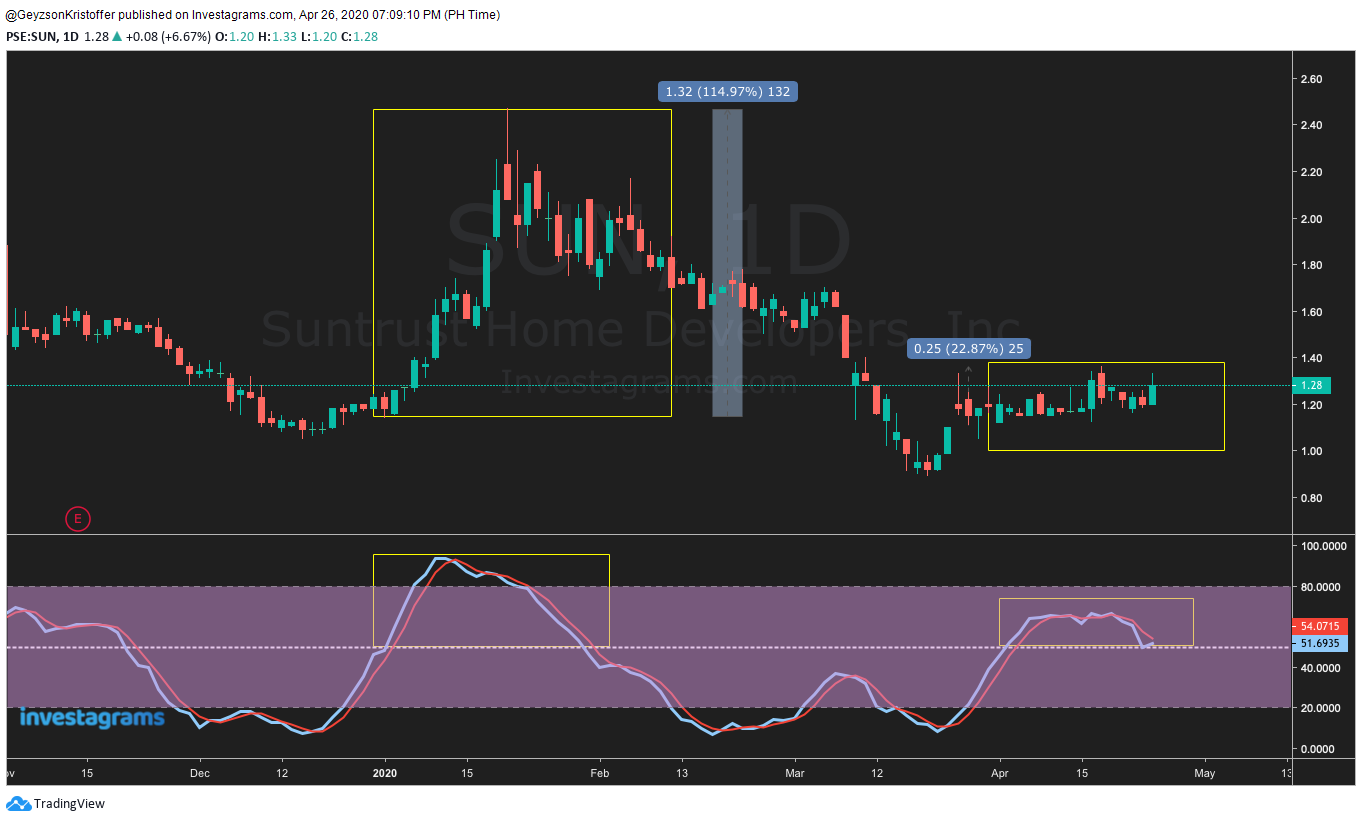
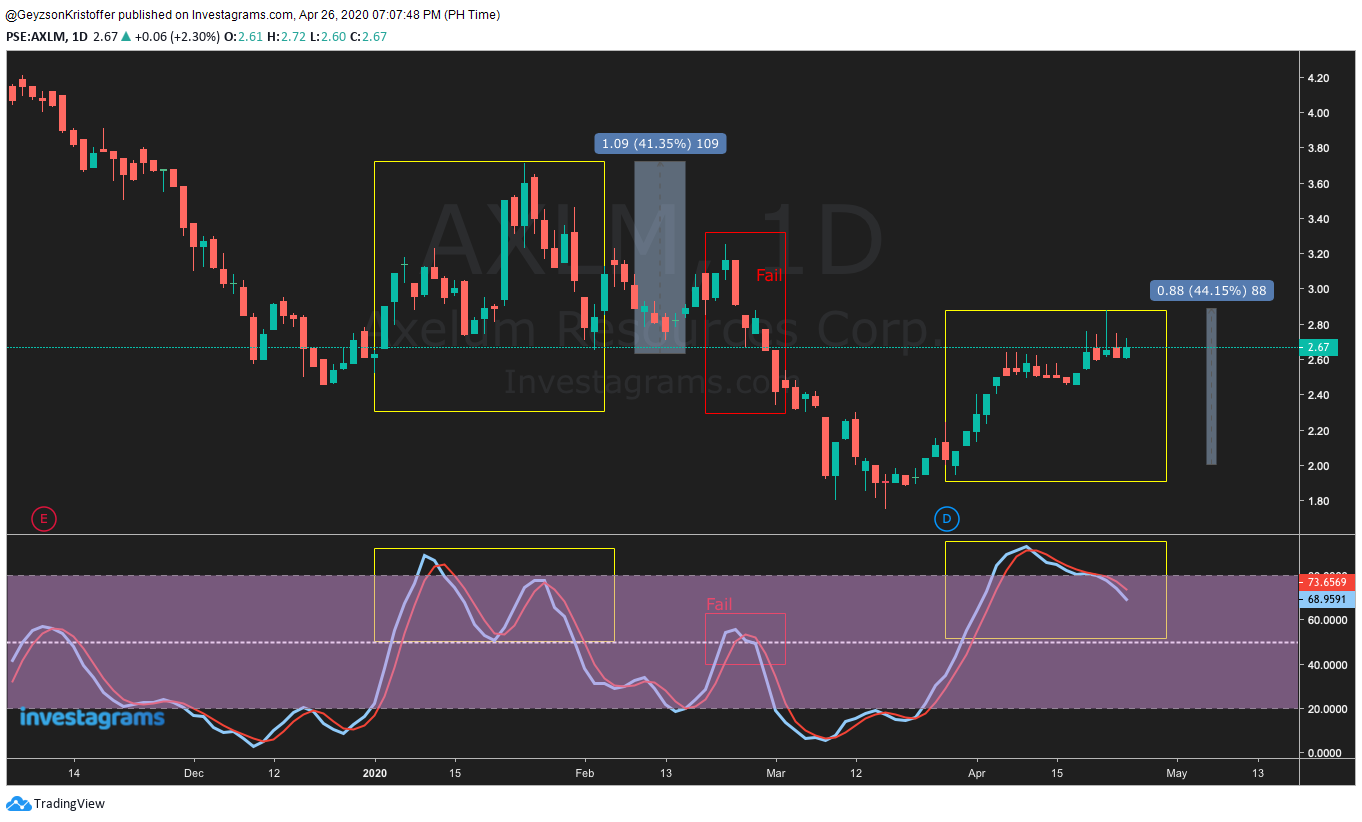
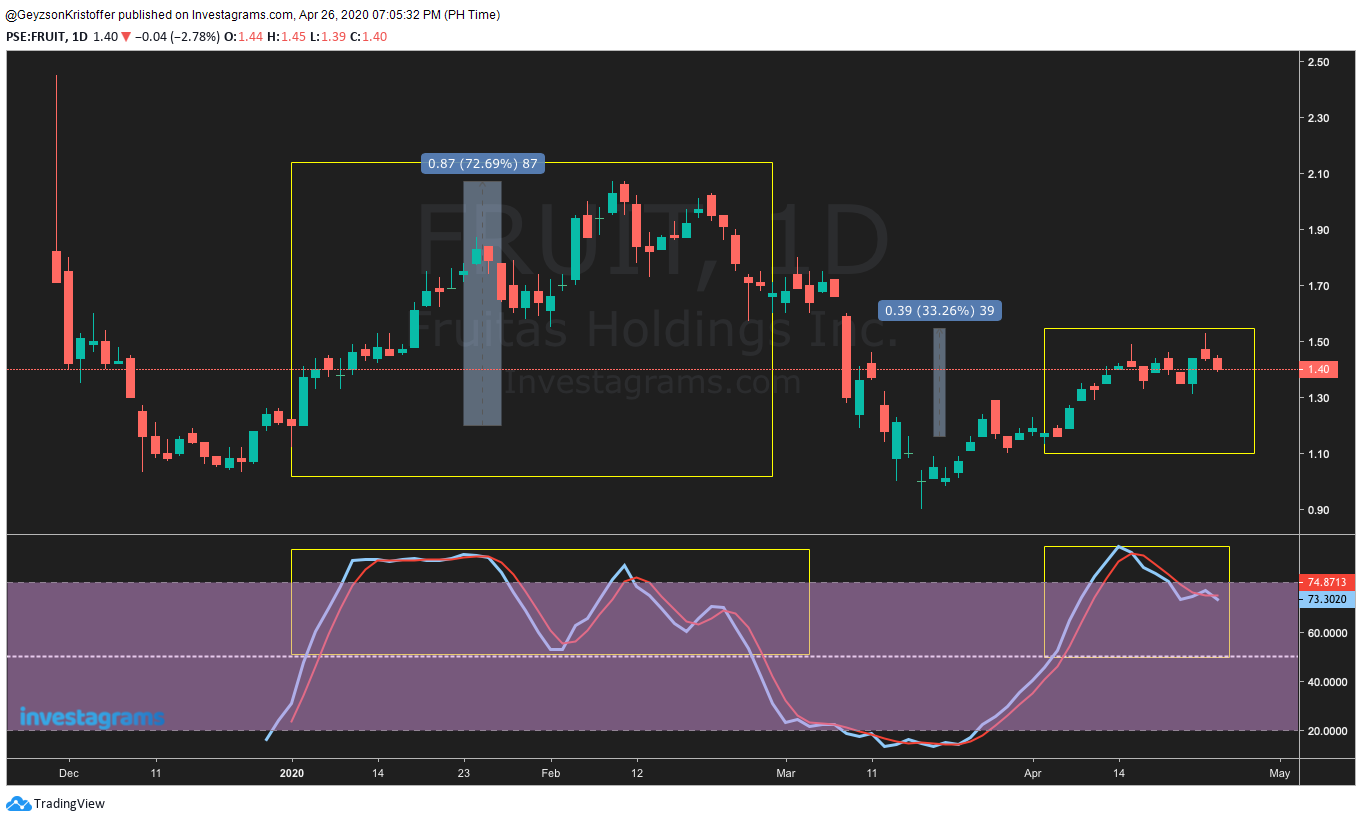
What does this mean? It means that you can consider buying only if the stock’s %K and %D are above 50.
Here are some of the examples:
1. $SUN – A massive 114% gain for $SUN after it broke the 50 level plus another 20ish% up-move.
2. $AXLM entered above 50 levels 3 times, 2 of which made a move greater than 40%.
3. One of the hot IPOs, $FRUIT made a 72% and a 33% gain after being above the 50 levels.
And more…
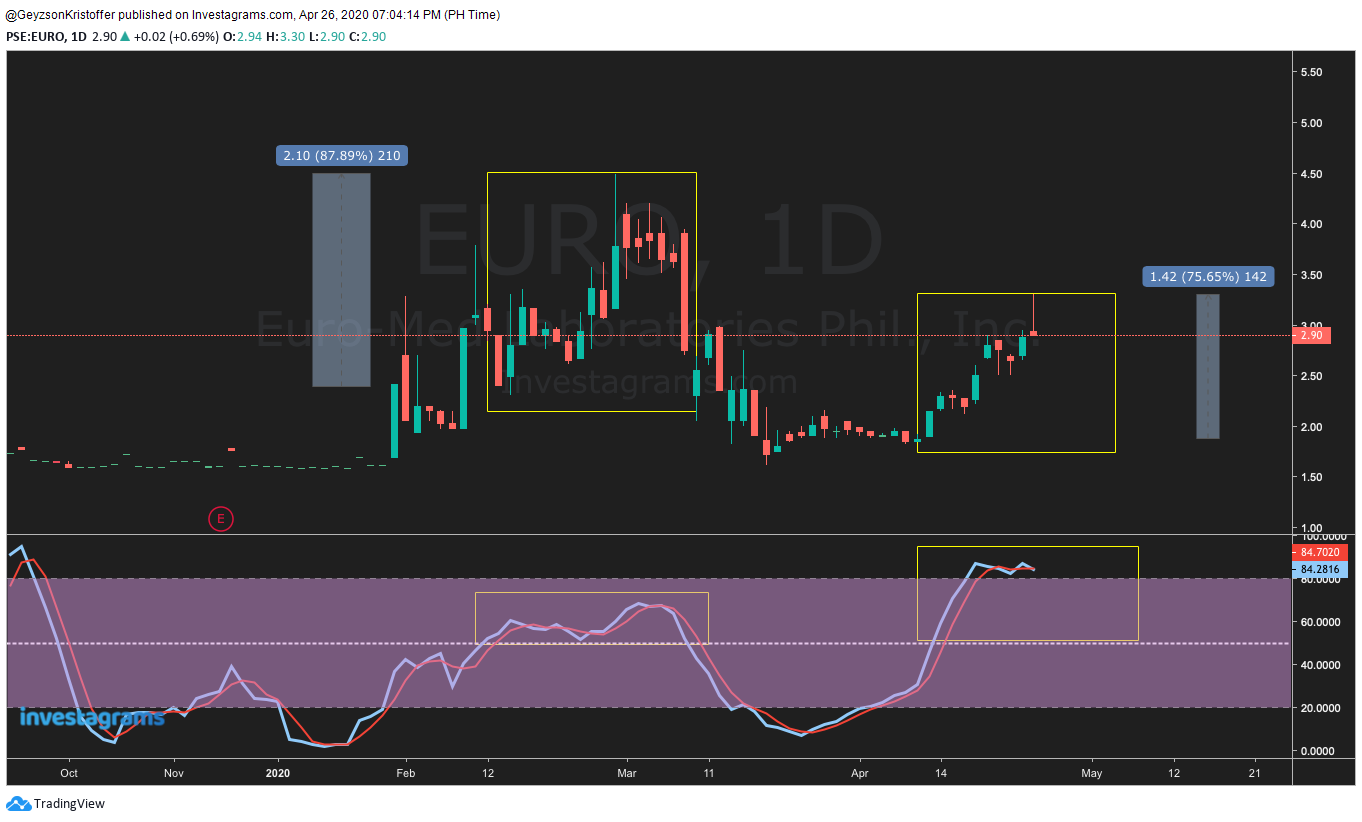
4. $EURO – 87% and 75%. Periods of extreme strength show high volatility and it’s up to the trader’s discretion whether to reduce or hold onto his positions.
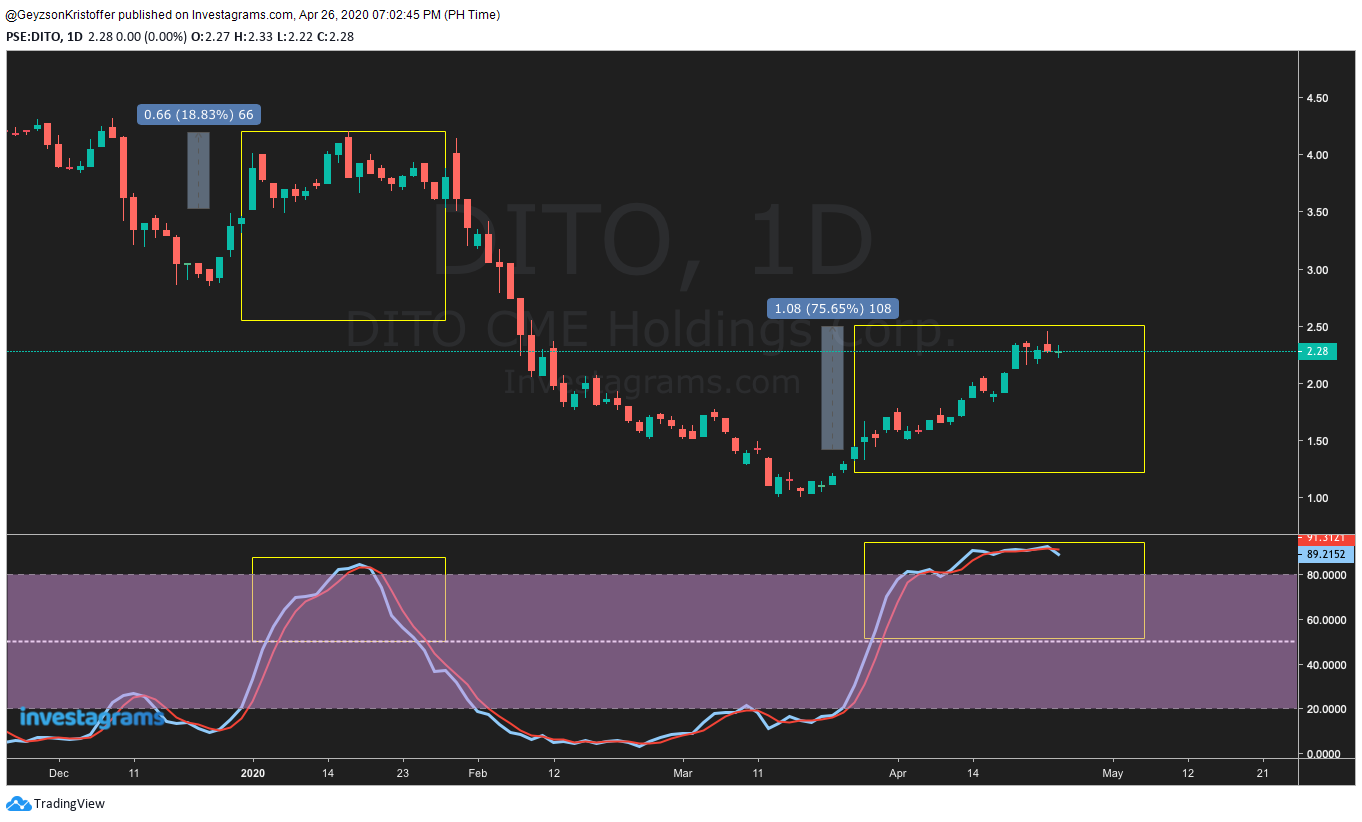
5. 3rd telco $DITO with an 18% and a 75% gain.
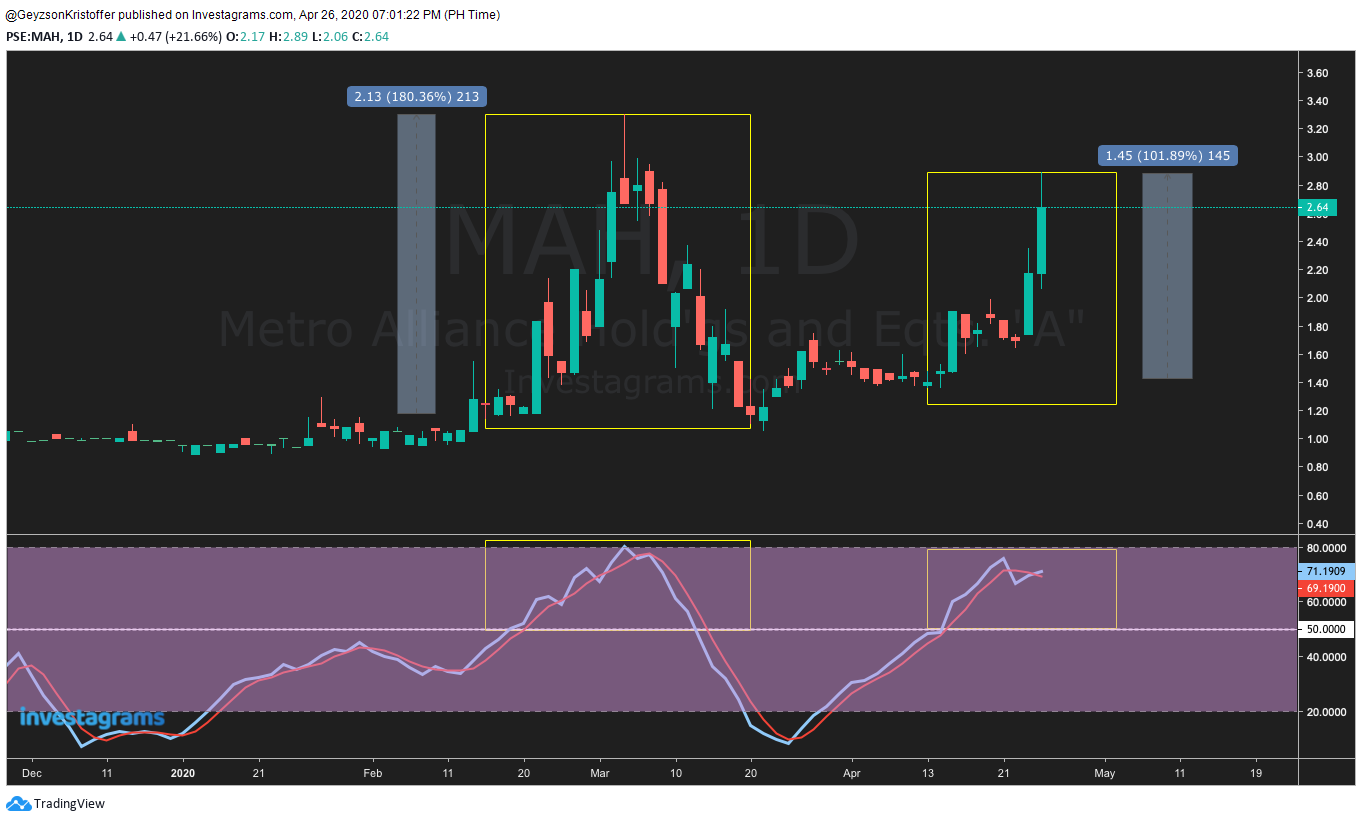
6. $MAH a super volatile stock with a 180% and a 100% gain.
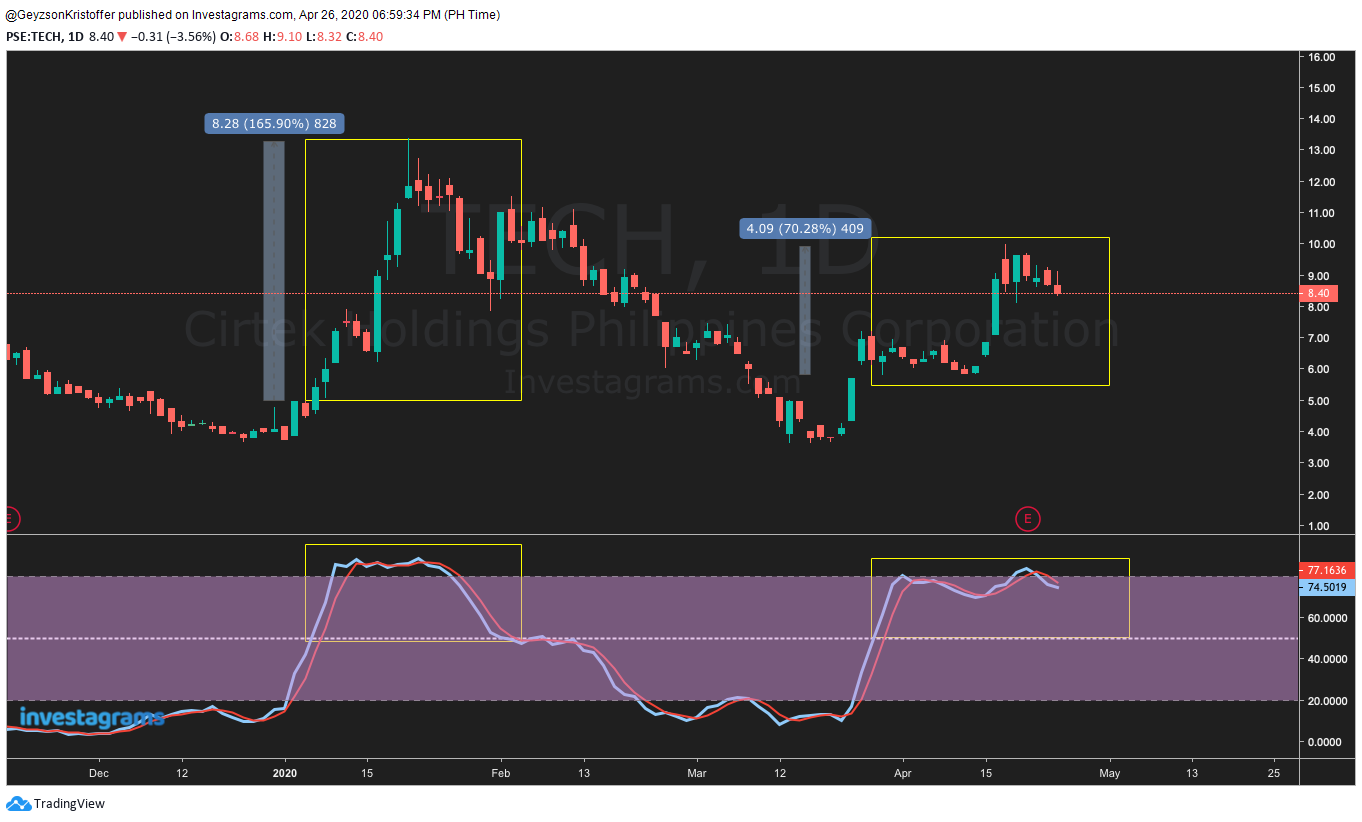
7. And finally, everyone’s favorite – $TECH with a 165% and a 70% gain.
After filtering, the only thing left for you to do is to find an entry and exit trigger!
In Conclusion
Stochastic and Stochastic RSI are strength indicators that oscillate between a period of weakness to a period of strength. To use this to your advantage, only trade stocks when their stochastic value is above 50. That will give you an assurance that what you bought has an underlying strength in it. As we all know, no indicator is fail-proof, Stochastic and Stochastic RSI are no exception, that’s why we should always use proper risk management to stay in the game and have our winners make way bigger money than our losers.
“Success usually comes to those who are too busy to be looking for it.”
– Henry David Thoreau
Contributor:
Full Name: Geyzson Kristoffer S. Homena
Investagrams username: @GeyzsonKristoffer
Channels:
www.facebook.com/GeyzsonKristoffer
www.investagrams.com/Profile/GeyzsonKristoffer
About the Contributor:
An Applied Mathematics graduate and a full-time teacher, Geyzson Kristoffer is a part-time trader who has been an active user of Investagrams since 2017. He spends his mornings, afternoons, and evenings learning about trading and reading books: Alexander Elder’s Trading for a Living being his favorite. Cohering to his passion and profession, he set his heart on teaching and helping newbies, but only the dedicated ones.
