This week’s featured trader is not someone who was able to successfully spot a specific stock before making a significant advance, but rather someone who shared his execution with the intention of helping others. A huge shout out to Gagamba Trader a.k.a. @enzo_gagamba for sharing his execution on his $IDC trade.
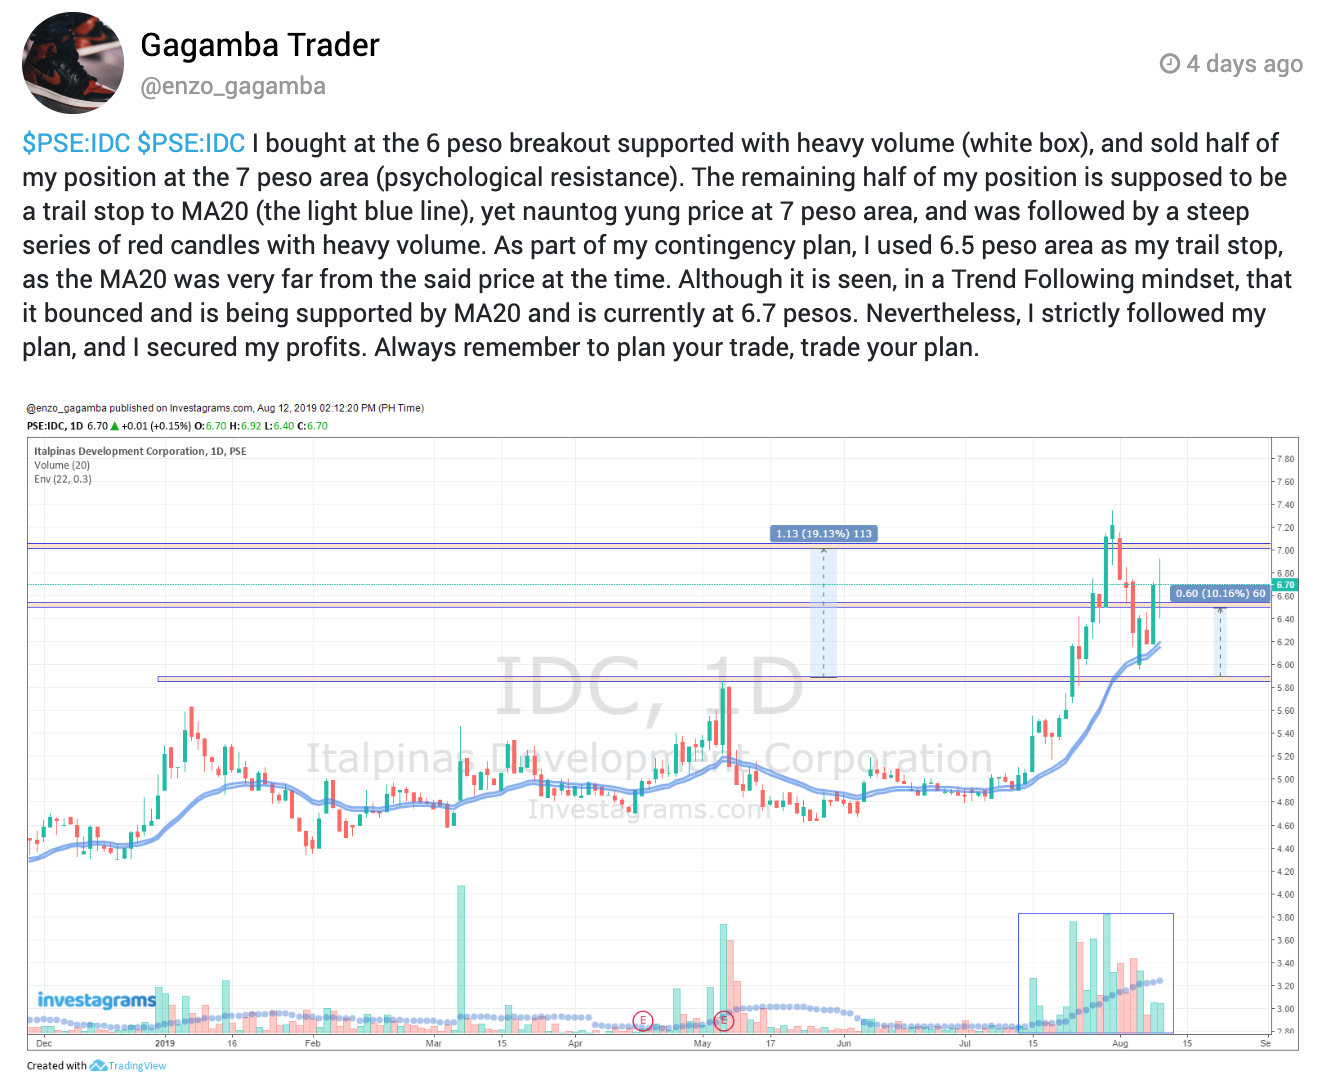
Gagamba Trader was able to buy $IDC (Italpinas Development Corporation) when it broke out of its psychological and structural resistance at 6 pesos, his trade idea was confirmed when the volume spiked significantly above the average. His mindset was to nail down a decent swing profit with half of the position, which is why he sold half at 7 pesos, and keep the remaining half for a potential further advance.
One of the details that stood out to us is that he had a CONTINGENCY PLAN ready in case his original plan didn’t pan out as he expected. You don’t hear a lot of traders talk about having a contingency plan, but this is something Mark Minervini taught in his first book. Along with his basic trade plan for a specific position, he also has contingency plans in place for anything that may happen. As for the case of $IDC, Gagamba Trader initially wanted to trail the remaining 50% of his position using the 20 day, but he also had a backstop at 6.50 in case of a sudden sell down.
As we all know, $IDC was sold down significantly in a matter of days which prompted the need follow the 6.50 emergency backstop. He was able to strictly follow his plan and secure his profits. Gagamba Trader also reminds everyone to plan your trade and trade your plan. Kudos to Gagamba Trader for his successful $IDC trade, and for sharing your execution to the Investagrams Community!
On Technicals:
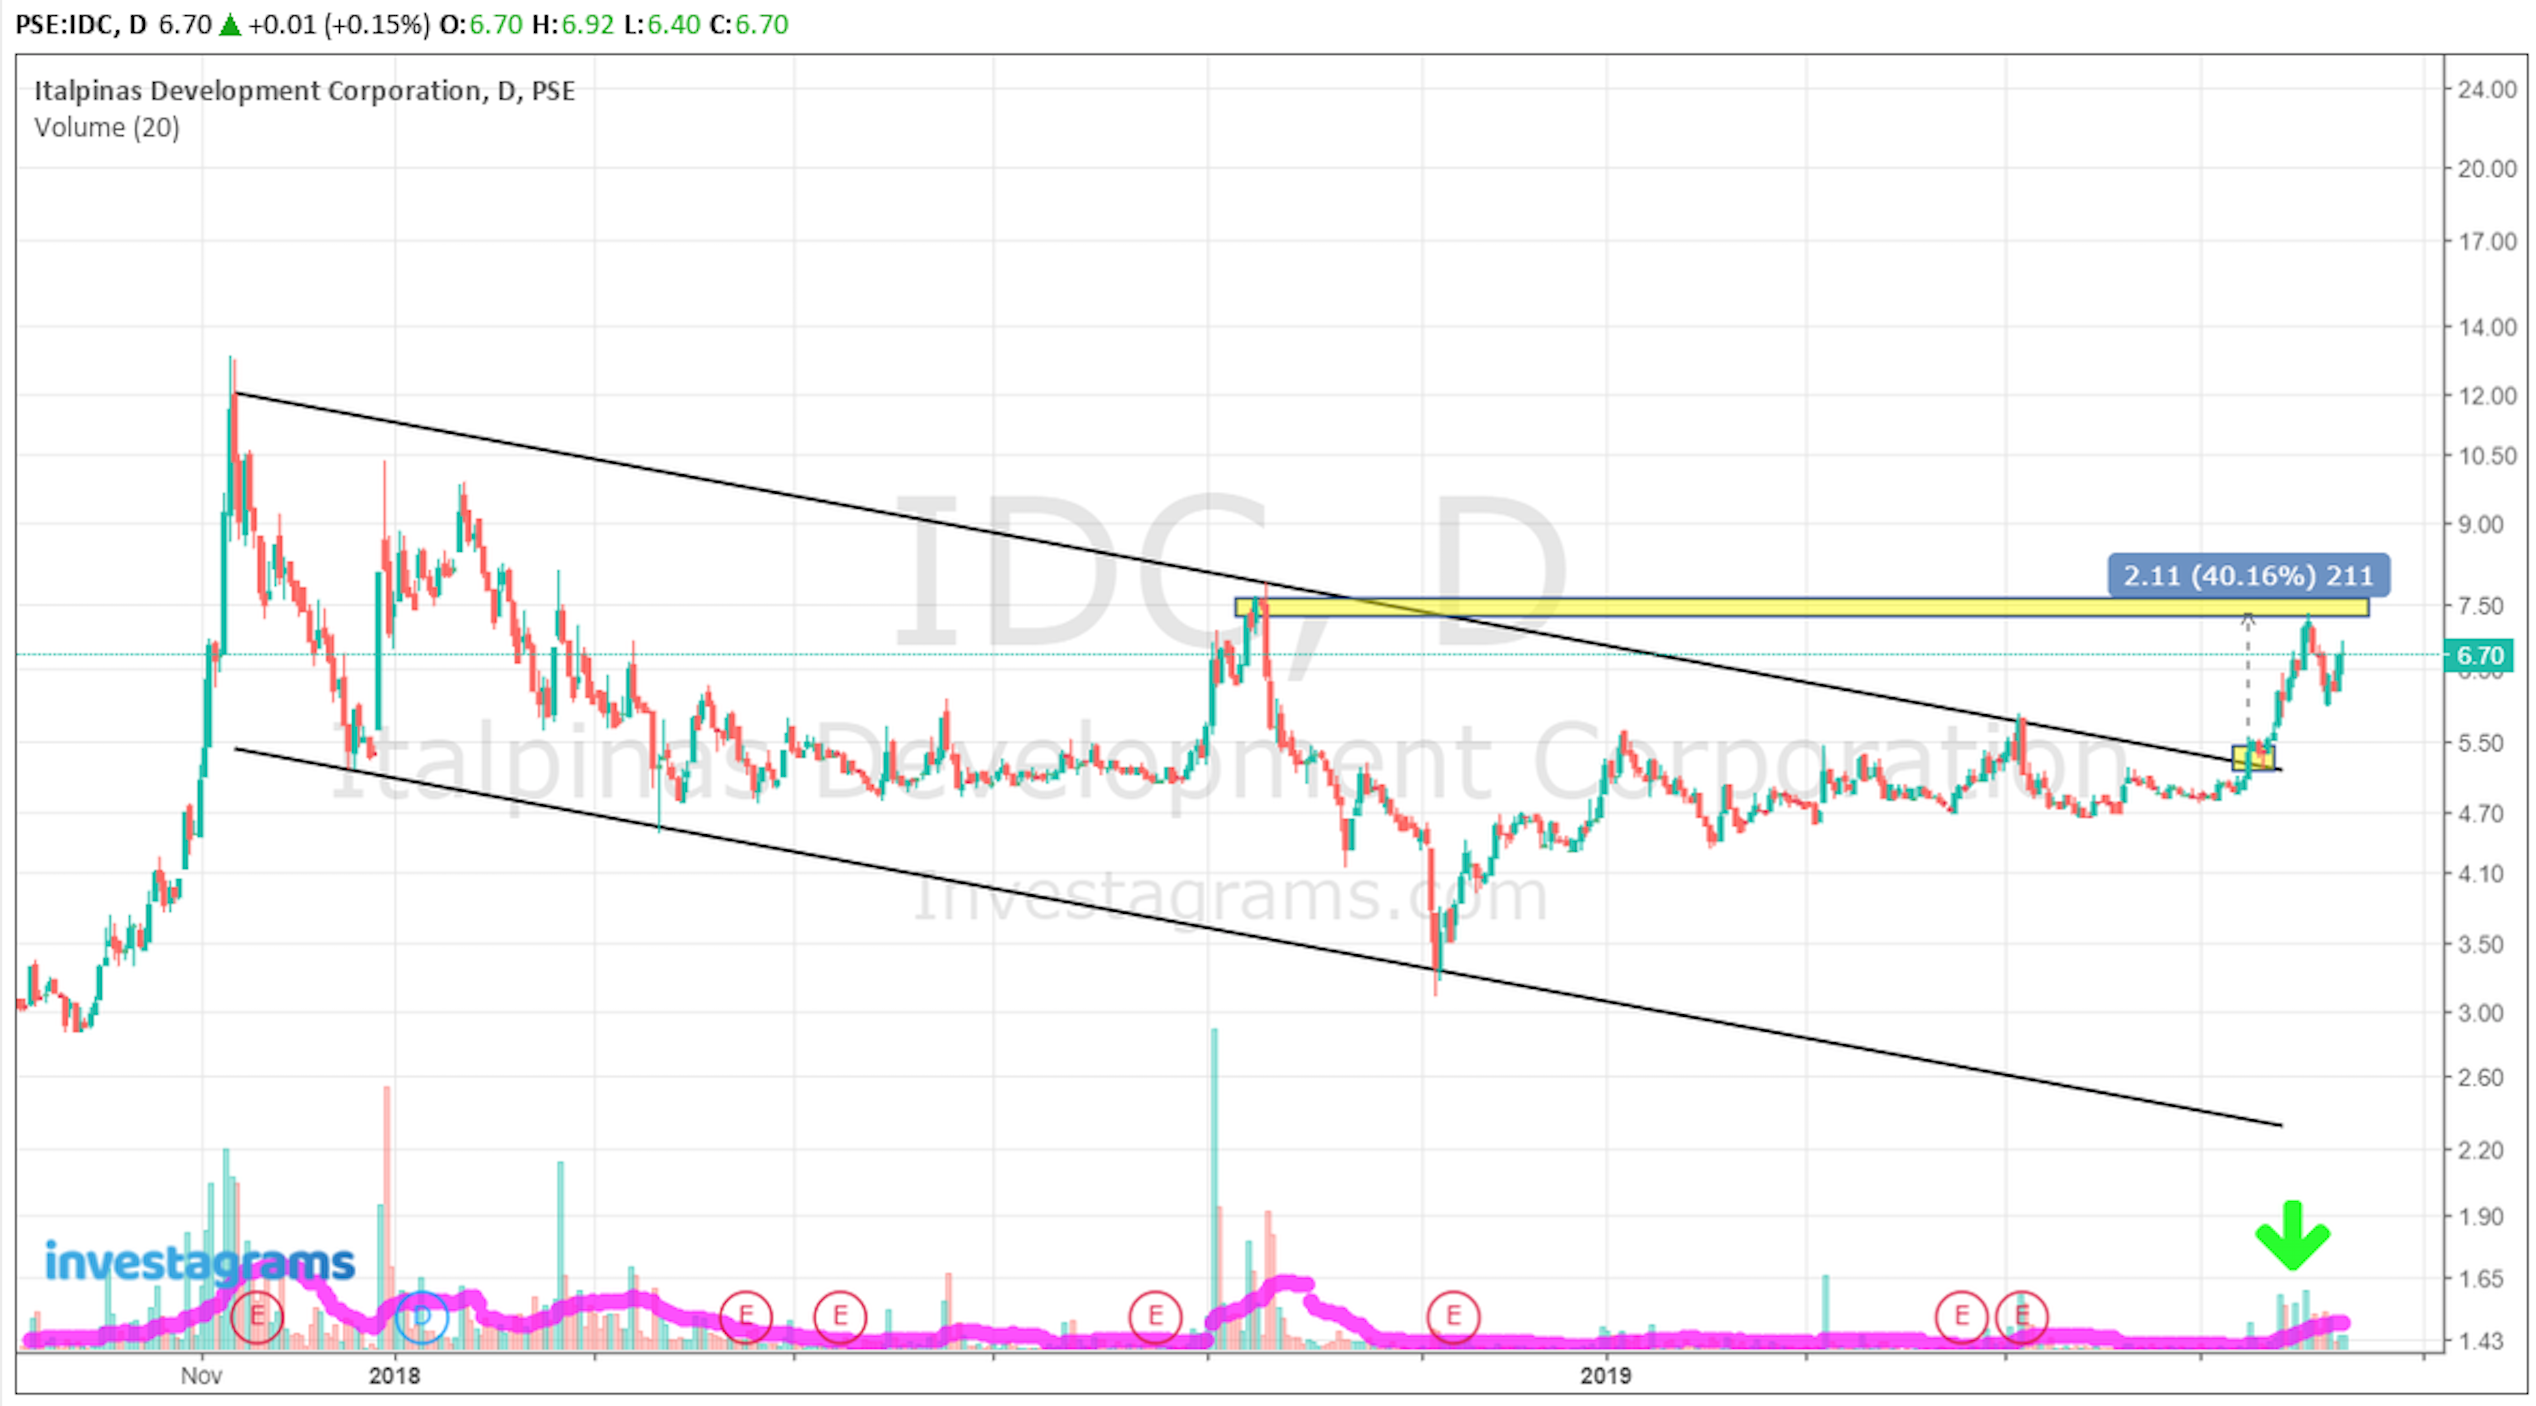
The reason why $IDC was able to make a 40% move in a matter of two weeks is because it was able to breakout of it’s downtrend channel with significant volume.
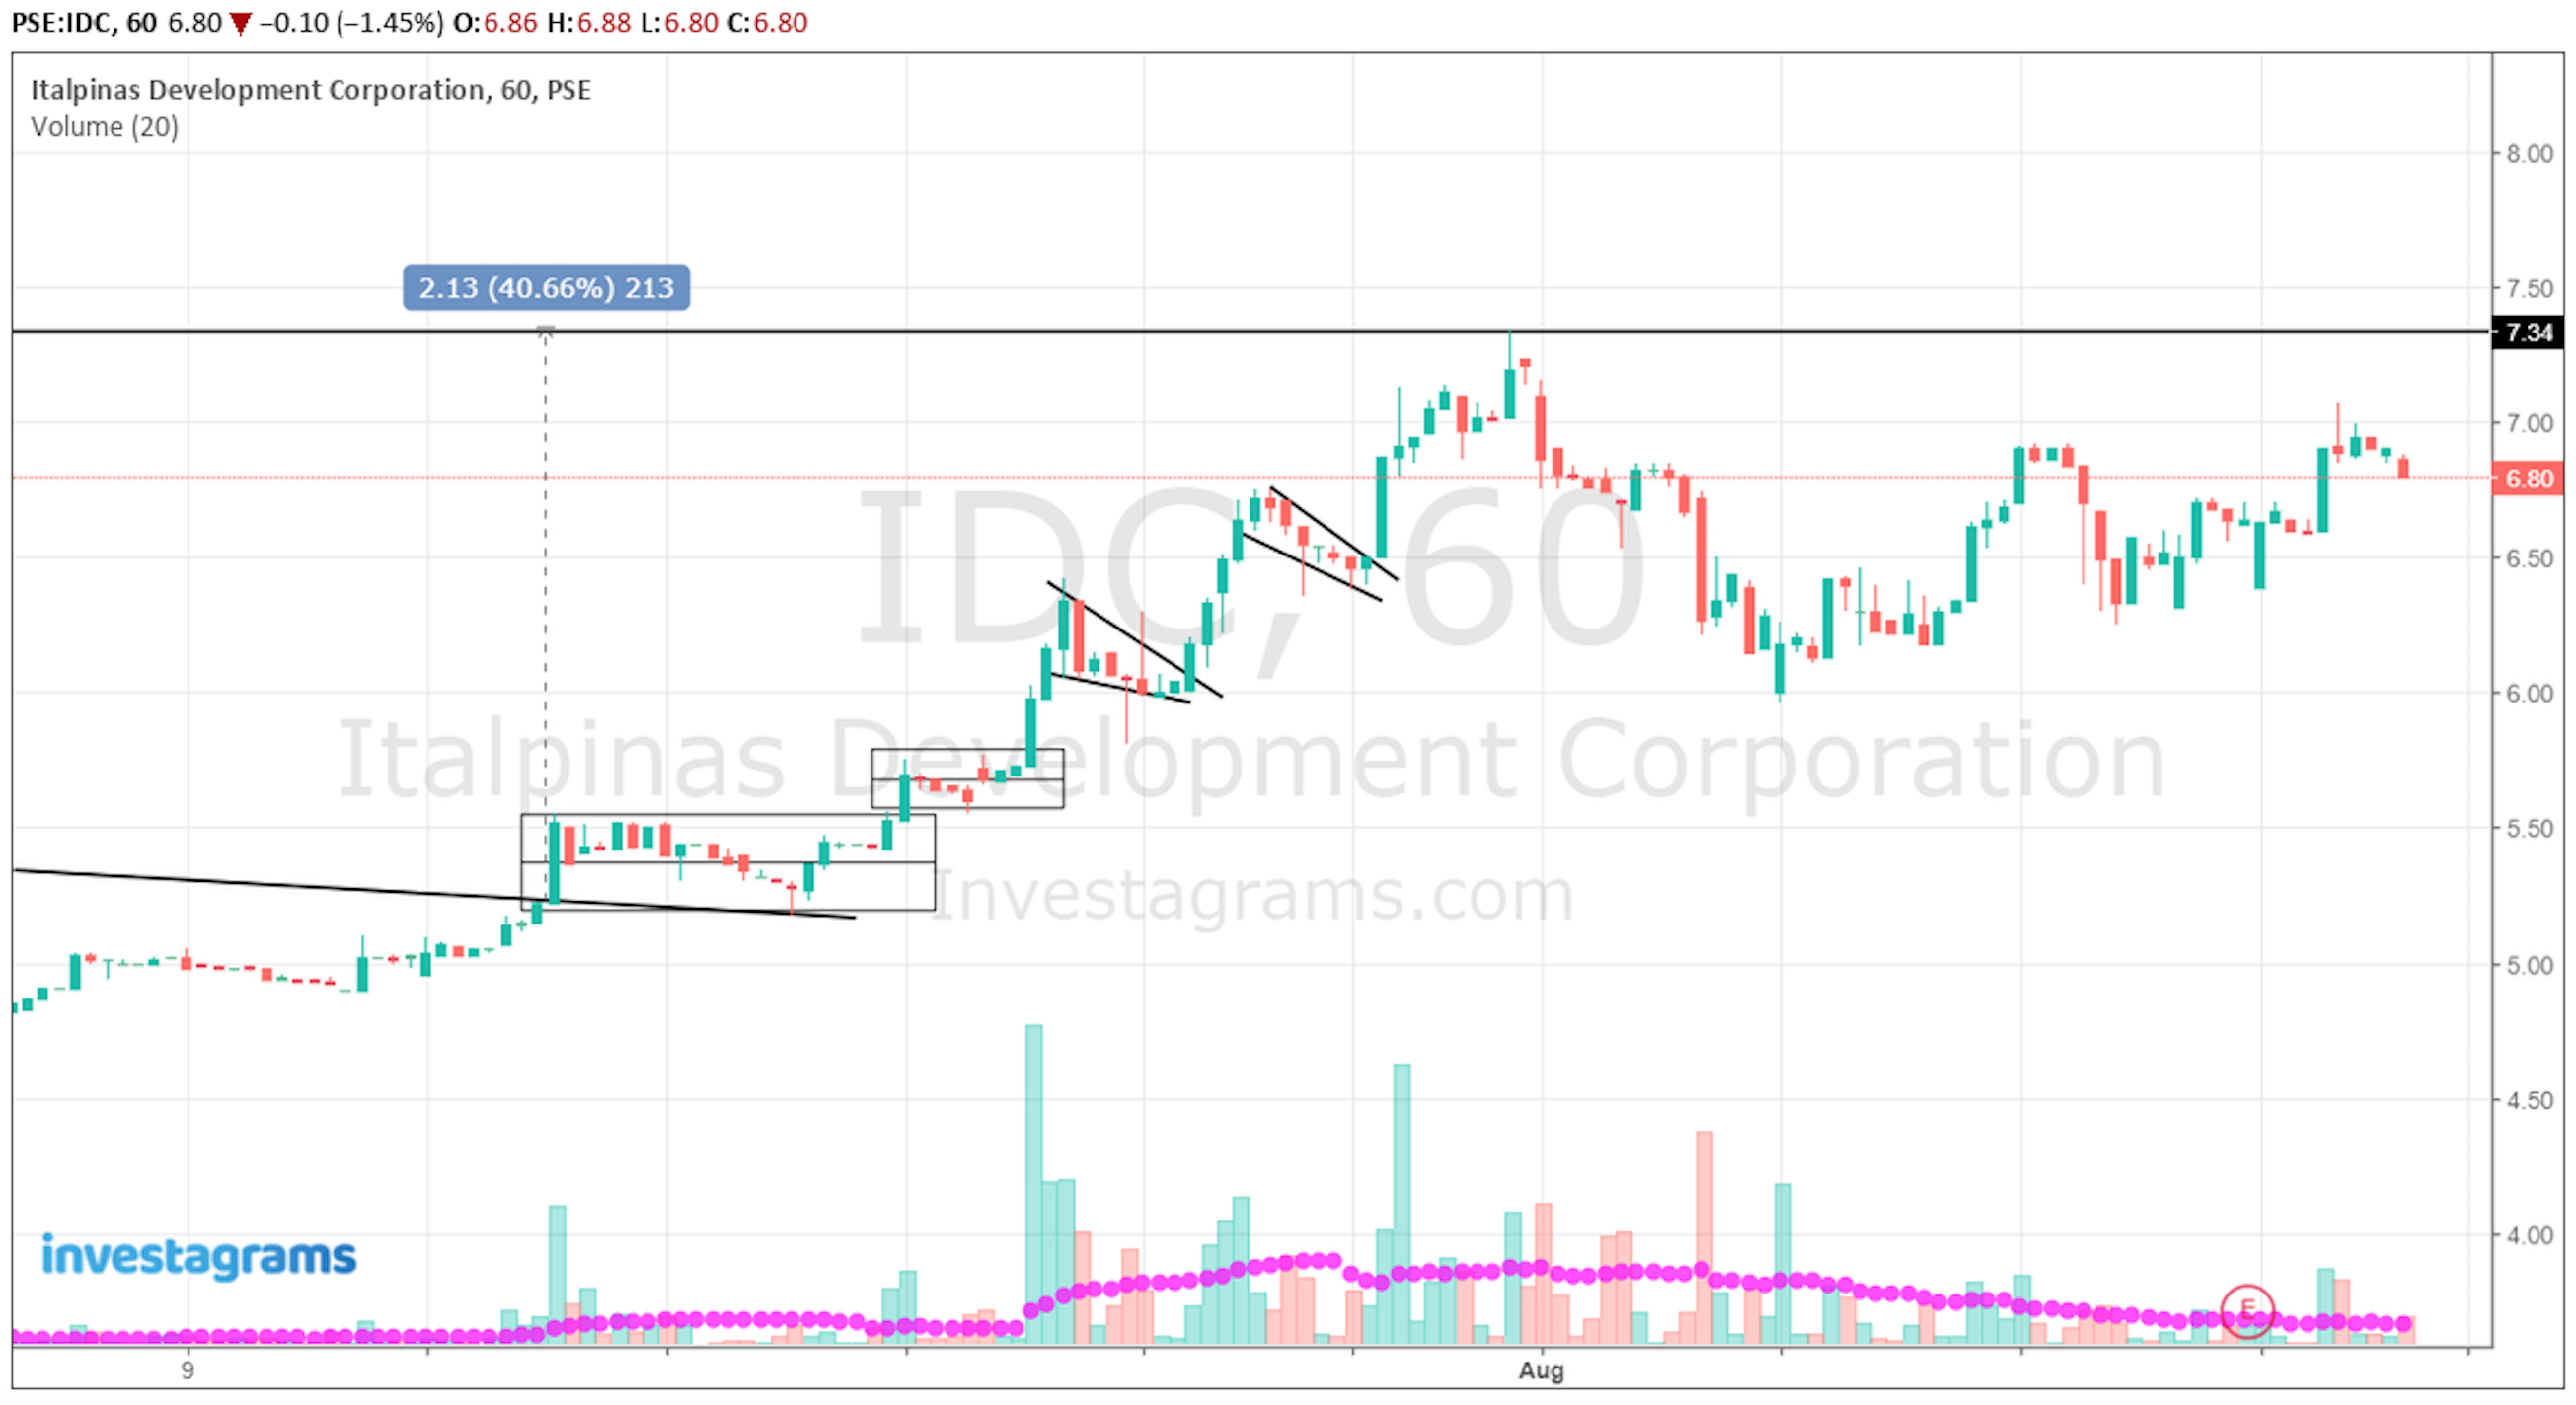
If you check the hourly chart, you’ll also notice that $IDC gave several continuation patterns. The stock gave four continuation patterns before temporarily topping at 7.35, which was also it’s previous resistance. As of the moment, $IDC will need to break above its previous high at 7.35 to continue the up move.
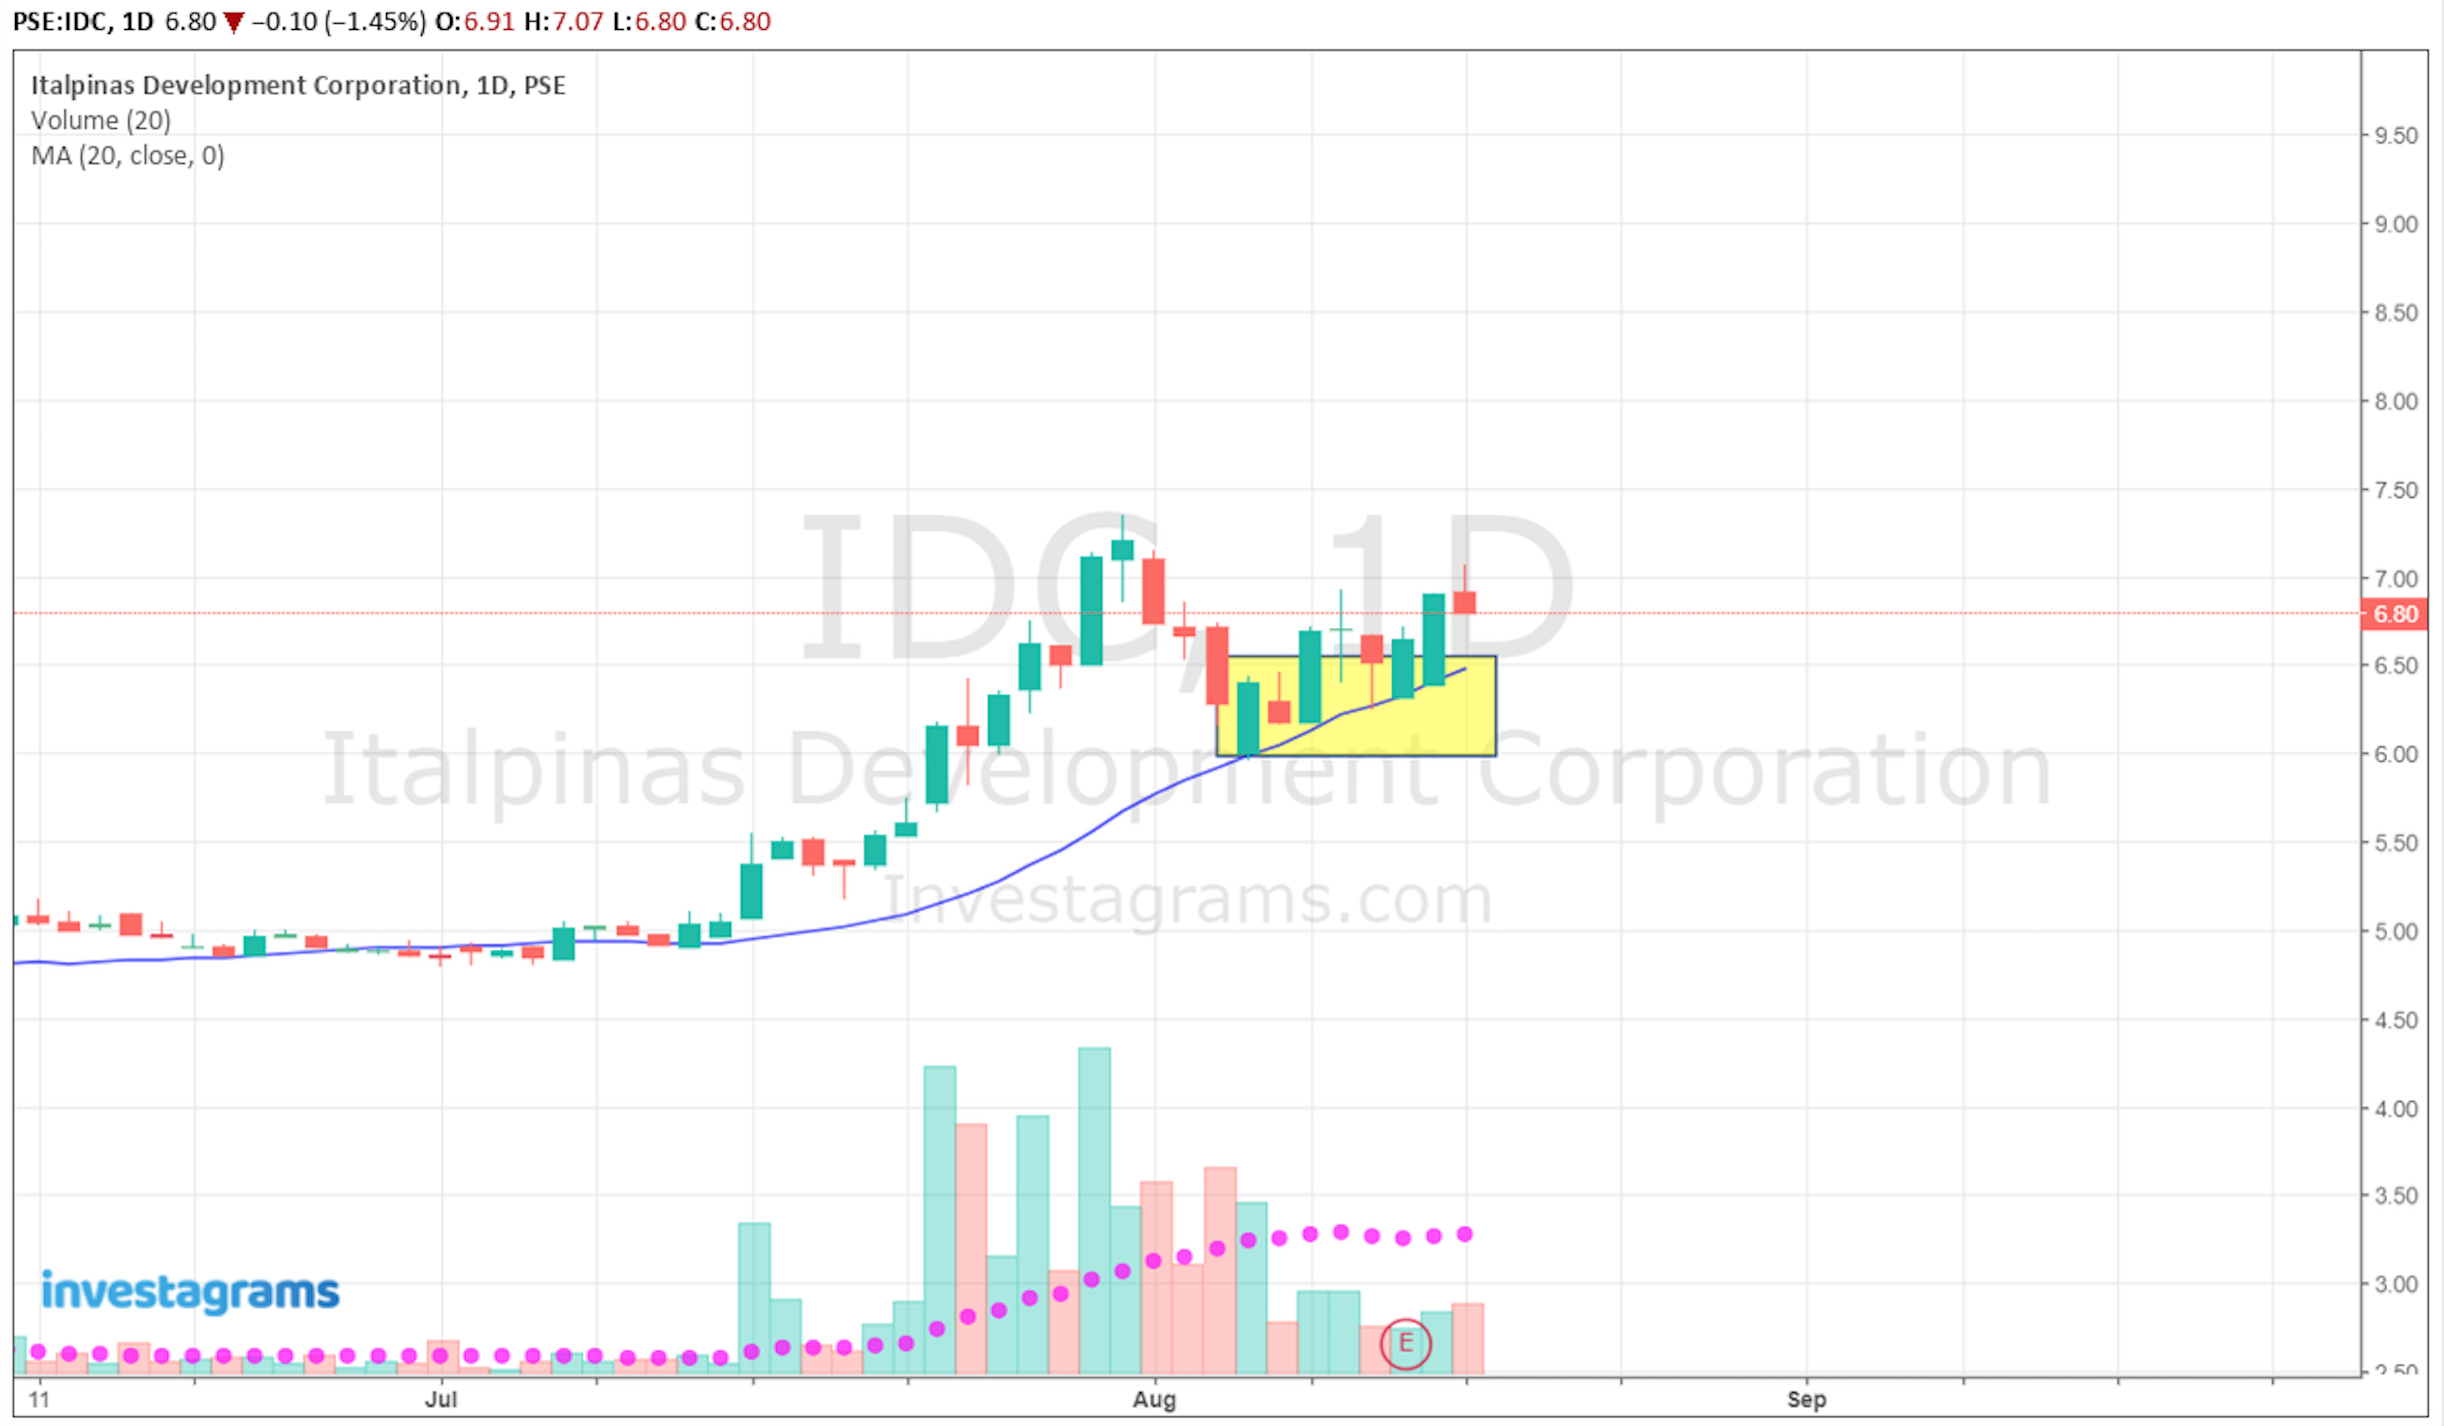
For the daily chart, you’ll see that $IDC was supported by the 20-day moving average. This is a good sign showing that there’s obvious demand for the stock which supported it during the sudden sell down.
Congratulations to everyone who was able to ride to 40% move of $IDC, and to those who were able to pickup the stock when it dipped towards the 20-day moving average. Lastly, kudos again to Gagamba Trader for sharing his execution, your FREE one-month InvestaJournal is on it’s way!