
Introduction
- What are Financial Ratios?
- What are they used for?
Examples of Financial Ratios
- P/E Ratio
- EPS
- ROE
- PEG Ratio
- Dividend Yield
Experienced investors and bankers talk about Financial Ratios all of the time. You may be familiar with a couple of them like P/E Ratio and EPS, but have no idea what picture they paint. Financial ratios are values derived from financial statements to come up with useful information about a company.
The numbers from the financial statements are used to conduct quantitative analysis and assess a variety of things such as growth, profitability, rates of return etc. The information derived from these ratios would help you create decisions and more accurately predict the performance of a stock.
There are a lot of financial ratios out there, financial analysts and accountants may use every single one of them everyday, but to help you ease into the concept of Financial Ratios it would be best to focus on these five financial ratios:
P/E Ratio
This is perhaps one of the best and most used financial ratios. If P/E Ratio seems familiar to you, maybe it’s because it’s commonly shown in the stock’s summary along with other useful information such as the Open, Close, Market Cap, and Volume. The Price/Earnings ratio is used to value a company by comparing its current share price to its per-share earnings or EPS which we would discuss later.
This can be used to compare a company to its historical record. A high P/E ratio signifies a company’s stock is overvalued, meaning investors are expecting high growth rates. Companies that have a net loss do not have a P/E ratio since nothing would be put in the denominator.

EPS
EPS is another common financial ratio because it tells us about the company’s profitability. Earnings Per Share is derived by dividing the company’s profit by the outstanding shares of its common stock. A company with higher EPS means that it is considered profitable. Investors consider stocks with higher EPS as stocks of greater value since the company has shown to have higher profits relative to its share price. EPS can be in different forms such as excluding extraordinary items or discontinued operations, or on a diluted basis.

ROE
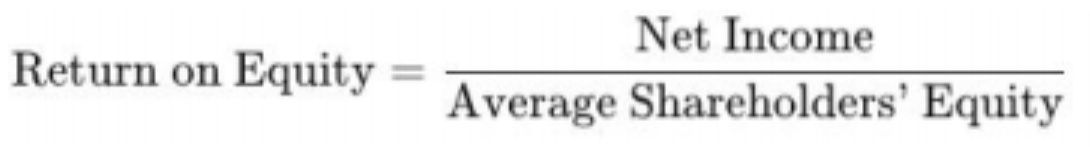
Return on Equity calculates a company’s financial performance by dividing net income by the shareholders’ equity. ROE is a measure of profitability in relation to the stockholders’ equity. An ROE value of a particular stock is good or bad depending on the ROE of similar stocks. The rule of thumb is to
target the ROE that is just above or equal to the average. Growth rates and dividend growth rates can also be estimated ung ROE.
PEG Ratio
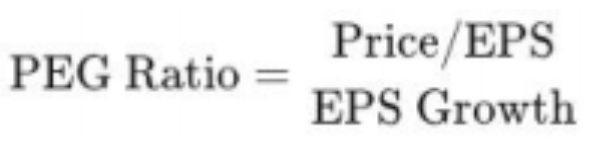
The price/earnings to growth ratio is one of the more unheard of financial ratios as compared to the ones that I have talked about. The PEG ratio is derived by dividing the P/E ratio by the growth rate of its earnings for a specific period. The PEG is useful in determining a stock’s value while also considering the company’s expected earnings growth. It is considered to give a better picture than just the P/E ratio. The difference between the two is that the PEG ratio adds in expected earnings growth into the formula. It is usually used as an indicator of a stock’s true value.
Dividend Yield
This financial ratio shows the amount a company pays out in dividends per year relative to its stock price. This is a very good indicator for investors who are looking to position themselves for the long term. Compared to the other financial ratios, this financial ratio is more straightforward in what the result of the ratio tells us. It is worth mentioning that higher dividend yield doesn’t automatically equate to a good investment opportunity as high dividend yield can be attained by declining stock prices.

In sum, just like indicators and many investing strategies, different financial ratios are more useful to specific types of investors. These are very useful when making decisions and add an extra layer of thought before going into a position. These tools provide an inside glance at the position of the company you are going to invest on. What technical analysis and fundamental analysis cannot predict may be seen when comparing these financial ratios.