Categories
Latest Posts News & Features

Featured Trader of the Week: Potato a.k.a @lazypotato

For this week, we would like to congratulate our featured trader: Potato a.k.a. @lazypotato!

This trader was able to spot one of the market leaders of the local market – $CHP or CEMEX Holdings Philippines Inc. Potato a.k.a. @lazypotato is a new and active member of the Investagrams community, yet already ceaseless in providing his analysis and insights focusing on the local market.

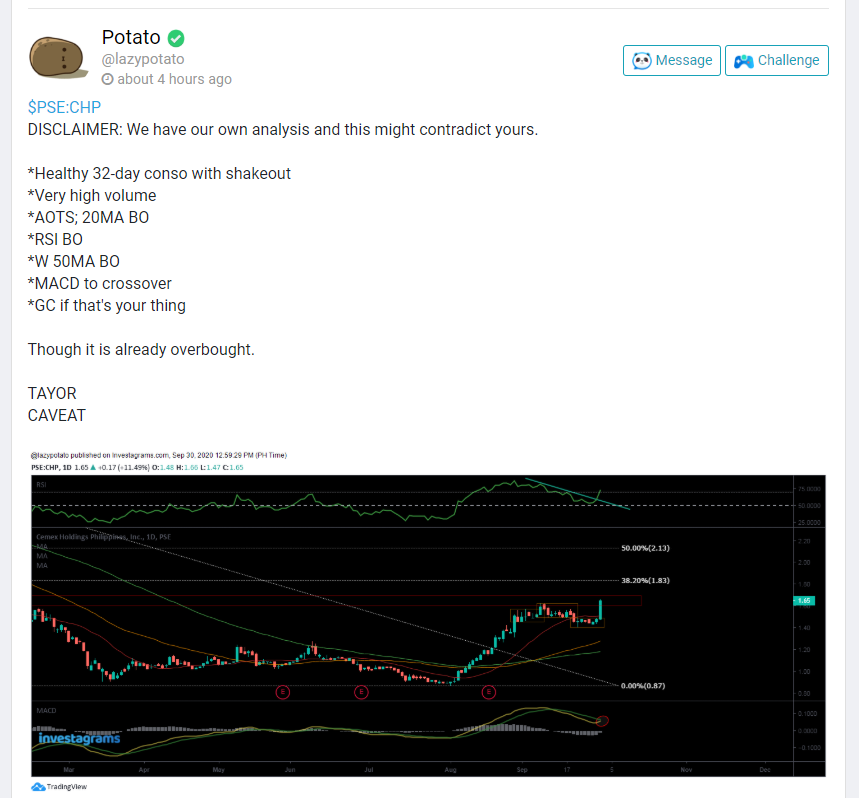
Along with his analysis of his stock selections, he also highlighted that a trader must take things with a grain of salt. When it comes to grasping ideas of other market participants, he said that a trader must be careful in following or absorbing their ideas. We will never know if other’s analysis were made purely because of goodwill or because of hyping/bashing. Thus, it is always important to trade at your own risk (TAYOR) and with caveat.

As the said stock rose from its initial base, the stock consolidated for more than a month. The consolidation phase was also supported by below-average volume. Moreover, he also shared that the recent breakout of the said stock was in confluence with heavy volume, RSI (14) breakout of its trendline channel, MACD bullish crossover, and alignment of the stars (AOTS) in the form of moving averages.

Having multiple indicators confirm a buying signal indicates better chances that the move will continue its ascendancy. However, let us not forget that anything can happen in the markets. As traders, we should respect our stops if any unforeseen event occurs.

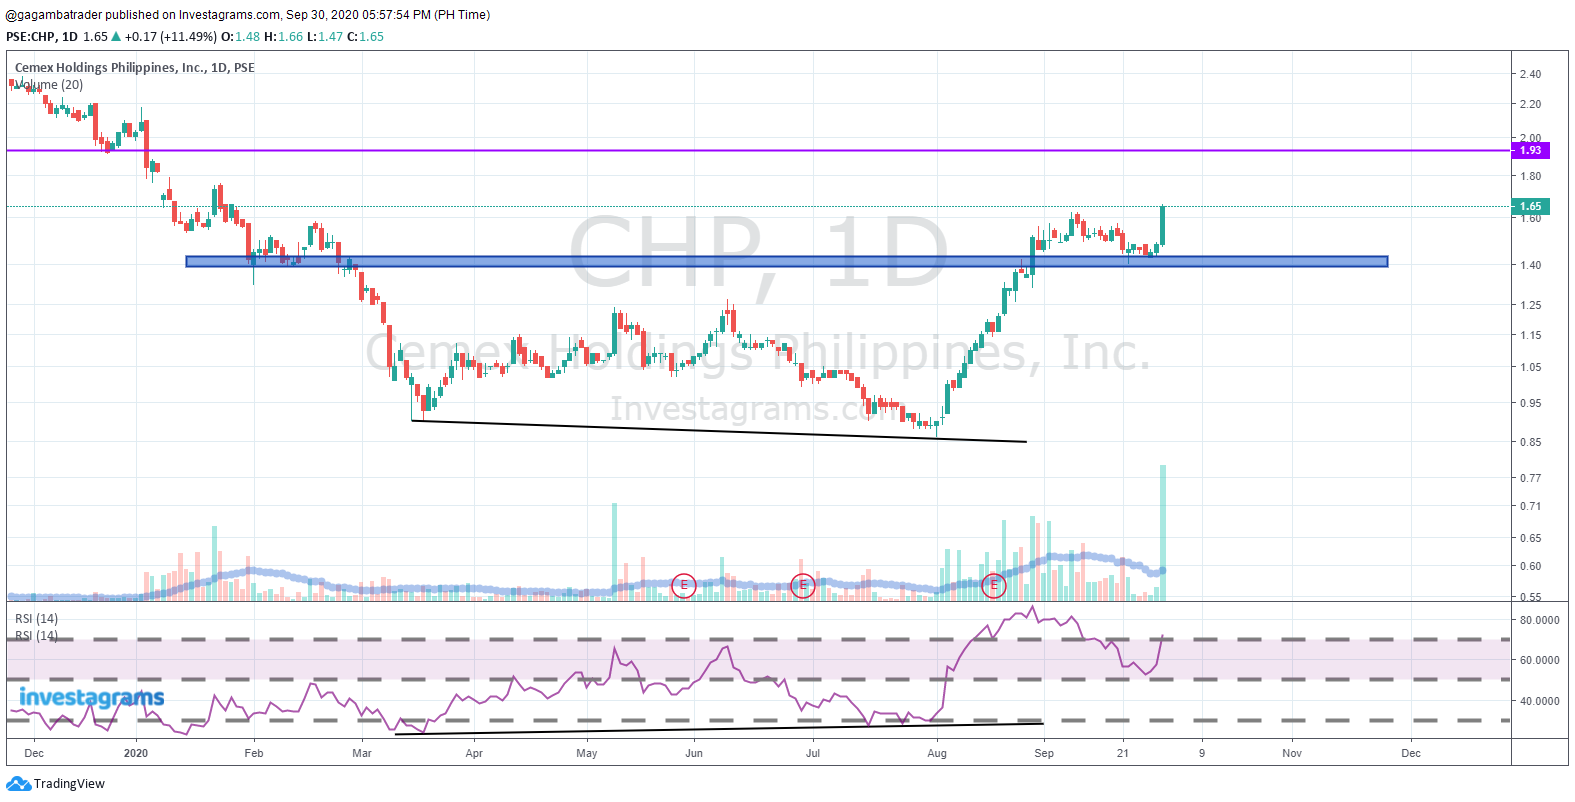
Moreover, there was a bullish divergence in the RSI (14) in its initial base prior to its rise. If you missed out on this trade during its rise last August 5, 2020, an opportunity reemerged when the stock was able to hover above the previous resistance which turned to the new support at the 1.4-peso levels.

The ideal buy point was the 1.4 (support) or the 1.5 (trendline breakout) peso levels. It is a low-risk, high-reward trade, as the stop loss levels for the said breakout point could be below 1.42 (-5.5%) if you bought it on its trendline channel pattern. On the other hand, the stop-loss levels for the said structural support levels could be below 1.34 (-4.4%). Take profit areas could be the structural resistance at 1.9-2-peso area (30%-40%).

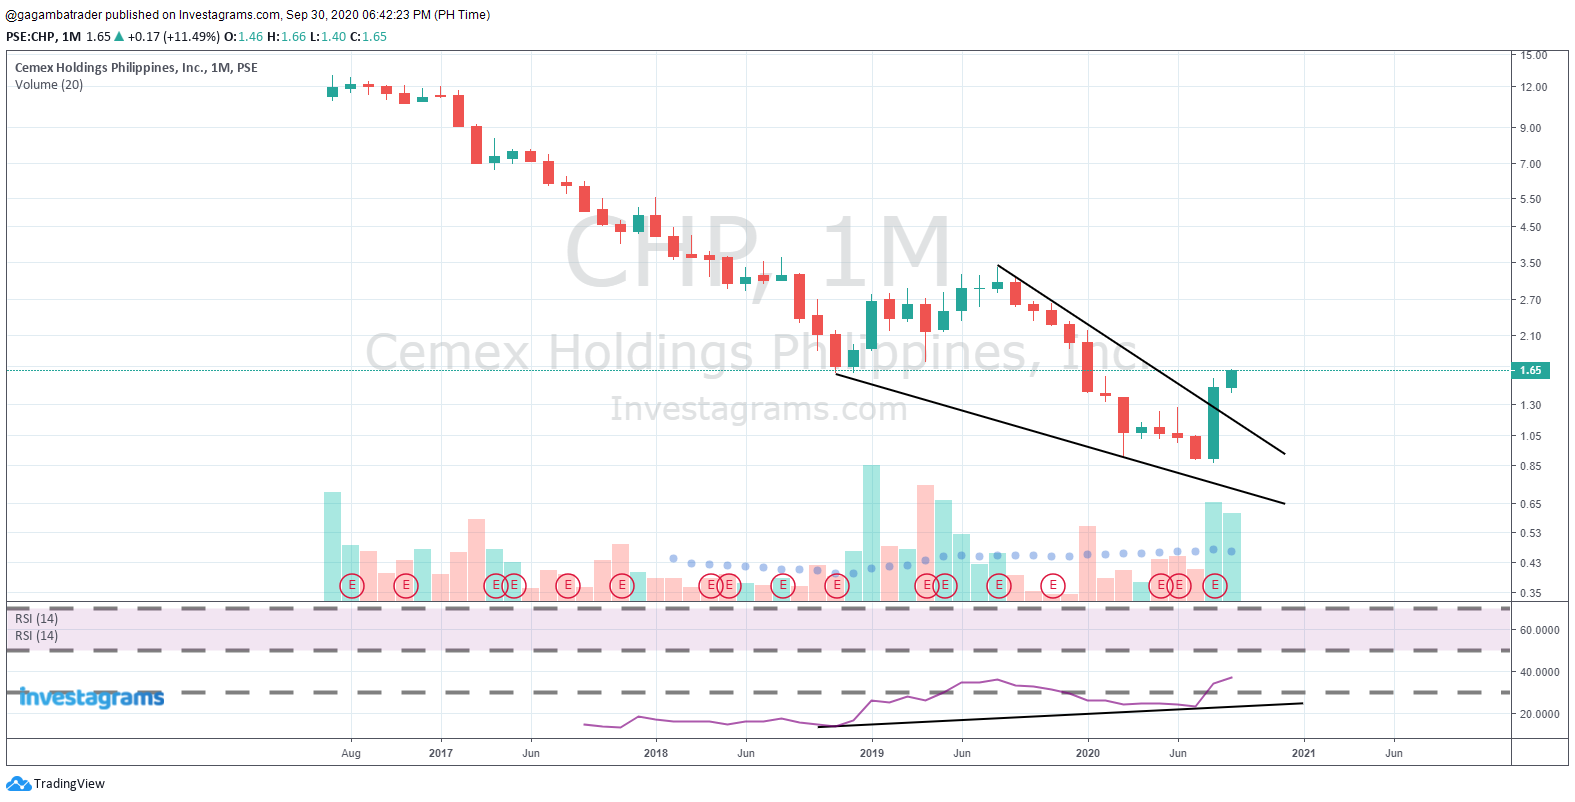
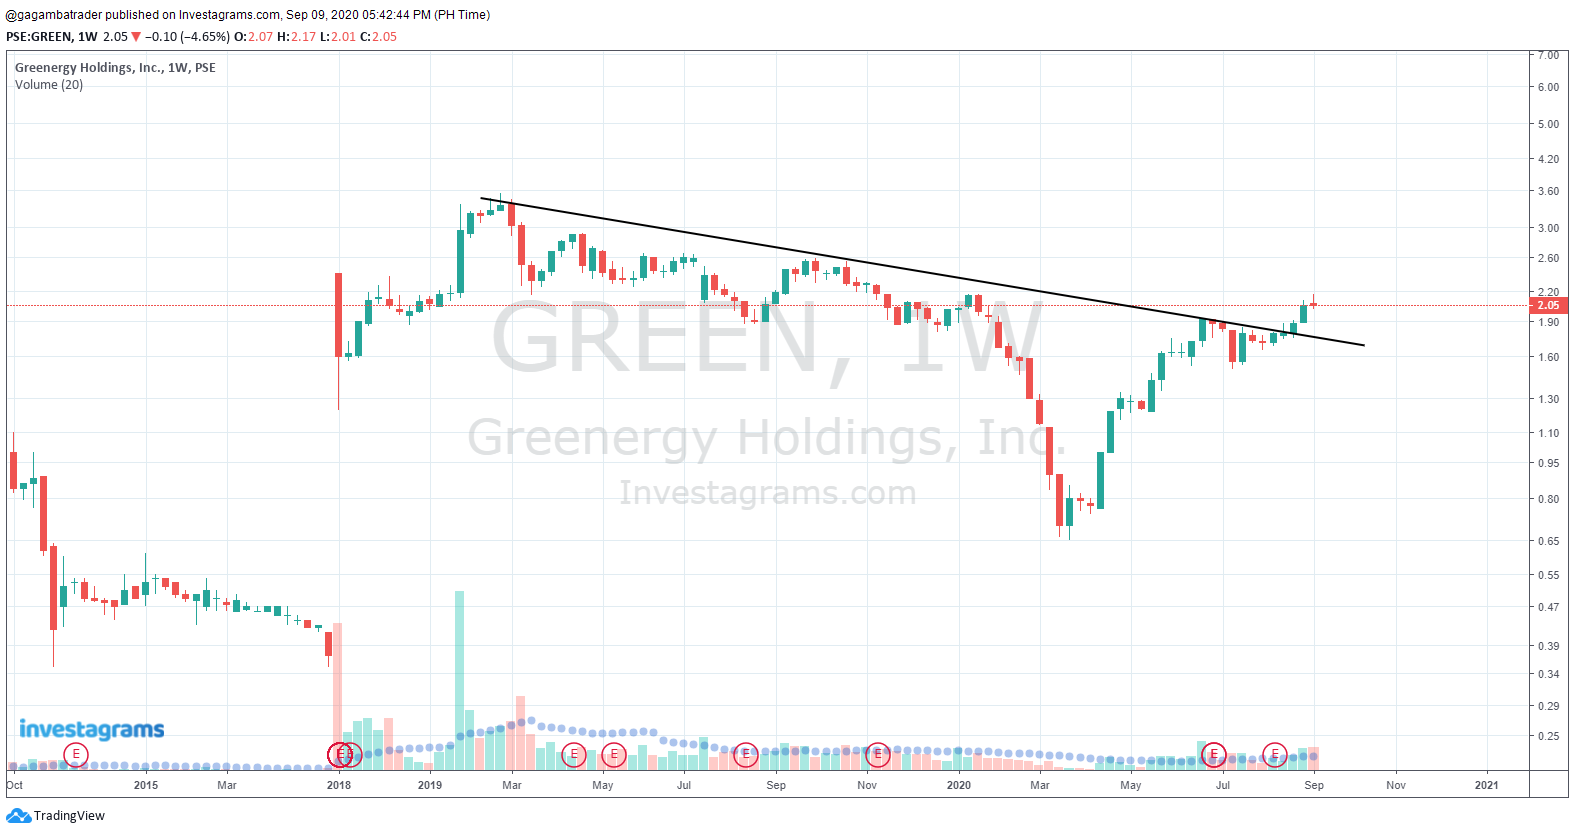
In the bigger picture, the monthly chart also exhibits a bullish divergence along with a triangle breakout. $CHP must sustain and consolidate above the 2-peso levels to further assert its dominance.

Market participants should not feel lonely when they miss a trade. Given that the financial markets offer a multitude of names from various asset classes that are operating in different timeframes, the markets are bound to give an endless stream of trading opportunities to those individuals who make themselves available for whatever the market is offering at any given moment.

Congratulations to those who were able to maximize the reversal play of $CHP. Lastly, kudos again to Potato a.k.a. @lazypotato for sharing his trade analysis. Your FREE 1-Month InvestaPRO Access is on its way!


Are you up to the Challenge of Investa Cup 2020? Registration is STILL OPEN UNTIL OCTOBER 4.

Hurry! Join now!

Click on the photo to join.


Categories
Latest Posts News & Features

Featured Trader for the Week: Tardigrade Trader a.k.a. @tardigradetrader

For this week, we would like to congratulate our featured trader: Tardigrade Trader a.k.a. @tardigradetrader!

This trader was able to spot a sleeper. $ALLHC or AyalaLand Logistics Holdings Corp. was not talked about not until it broke out of its initial base supported with enormous volume. Tardigrade Trader a.k.a. @tardigradetrader is an active member of the Investagrams community who endlessly spreads his knowledge on Technical Analysis along with his complete thought process in each of his stock selection.

Along with his qualitative assessment about the said stock, he also exclaimed about how minimalism can be applied in trading as well. As mentioned in the previous posts regarding the featured traders, whether the strategy of a said market participant is basic or advanced, their performance will always depend on the end-user itself.

Tardigrade Trader highlighted the importance of an initial consolidation phase before a much-awaited breakout. Patience is the key to spot market leaders. There will be countless times that it will take several weeks or months for a trade to blossom. Moreover, he also added the significance of RSI (14) 70 breaches along with massive volume in the breakout of the pivot high, which further solidifies the said trend.

A breakout of the 1.9 to 2-peso area was an ideal buy point as it was the breakout of the initial base or the symmetrical triangle supported with increasing volume on its up move. It is a low-risk, high-reward trade, as the stop loss levels for the said breakout point could be below 1.8 (-4.5%) if you bought it on a symmetrical triangle pattern. On the other hand, the stop-loss levels for the said breakout point could be below 1.9 (-4.5%) if you bought above the 2-peso psychological resistance level. Take profit areas could be the structural resistance at 2.5 (24%-33%).

It is a must for this stock to hover and sustain above the 2.5 psychological levels to further signify its ascendency. If it does, we may see it consolidate from here. The next significant resistance level would be the 3-peso area being the next structural and psychological levels, along with the 3.8-peso levels being the 52wk high of the said name.

It is a non-negotiable for traders to wait for the right setup. A setup where you could spot names to emerge just like $ALLHC. Waiting for the right moment to click the buy or sell button when all your parameters are finally aligned with a particular name is the ultimate embodiment of professional trading.

Congratulations to those who were able to maximize the technical swing of $ALLHC. Lastly, kudos again to Tardigrade Trader a.k.a. @tardigradetrader for sharing his trade analysis. Your FREE 1 Month InvestaPRO access is on its way!


Click on the photo to join.
Categories
Latest Posts News & Features

Featured Trader of the Week: Petix and Chill

As the local index found support at the 5700 levels, the $PSEi presented numerous trade opportunities to select from. Petix and Chill (@petixandchill) was able to spot one of those potential leaders —  Greenergy Holdings, Inc., or $GREEN. This trader is an active member of the Investagrams community who endlessly provides his analysis and insights focusing on the local market. 

As seen in the technicals of the said stock, this name formed an ascending triangle pattern. This pattern resembles a triangle or flag that exhibits higher lows in price in confluence with a resistance level from a recent pivot high. While the stock was forming a base, it was supported with dried-up volume. Furthermore, it was also hovering above RSI (14) 50, which further solidified the creation of the said base.

A breakout of the 1.95 pivot area was an ideal buy point as it was the confirmation of the said bullish pattern accompanied with massive volume. It is a low-risk, high-reward trade, as the stop loss levels for the said breakout point is around 1.85 (-5%), and the take profit areas could be the structural resistance at 2.35 (20%) and near the 52-week high (28% to 30%). As of this writing, the stock ended the trading session with a loss. This could be an opportunity to wait for a pullback at the previous breakout point.

To further sustain its dominance, this stock should hover above the 1.9 to 1.95-peso area. In the bigger picture, the stock seems to be on the right track as the breakout of the said pivot was also in conjunction with the breach of the longer-term trend line resistance as seen in the weekly chart. 

The epitome of professional trading is the ability to be disciplined and patient when it comes to an emerging name. Waiting for the right moment to strike, whether it would take weeks or months, is an essential skill that we must incorporate in our trading arsenal. 

Congratulations to those who were able to maximize the technical swing of $GREEN. Lastly, kudos again to Petix and Chill a.k.a. @petixandchill for sharing his execution. Your FREE 1-Month InvestaPRO access is on its way!


Take your Trading to the Next Level.

JOIN THE INVESTACUP2020 and have the chance to WIN MORE THAN PHP 300,000 IN PRIZES! 

Click on the photo to register
Categories
How to & Advice Videos

Stock Market Basics: How to Read Stock Charts (Part 2)

In our first video, we taught you the basics of how to read stock charts. We explained candlesticks, trend lines, and support and resistance.

Now, we’ll dive deeper into support and resistance—the backbone of all price structure analysis methods in technical analysis.

Watch the video above to learn how mastering support and resistance can make you a more profitable trader. We’ll also teach you about breakouts, breakdowns, and role reversals—when resistance becomes support or support becomes resistance. This will help you predict the best time to buy and sell.

This video is in a mixture of Filipino and English.

Subscribe to InvestaDaily for more investing tips and stock market advice, or sign up for Investagrams to access special features to help you reach your first million.

Subscribe to our Newsletter

Join our mailing list for investing tips and stock market advice
to help you reach your first million.

You have Successfully Subscribed!