Categories
Featured How to & Advice

Read Between the Lines: A Silent Guide to Interpreting Charts

As a newbie who wants to delve into trading the financial markets, whenever we do a quick search on the Internet about trading, most of the time, you will encounter charts involving mostly candlesticks.

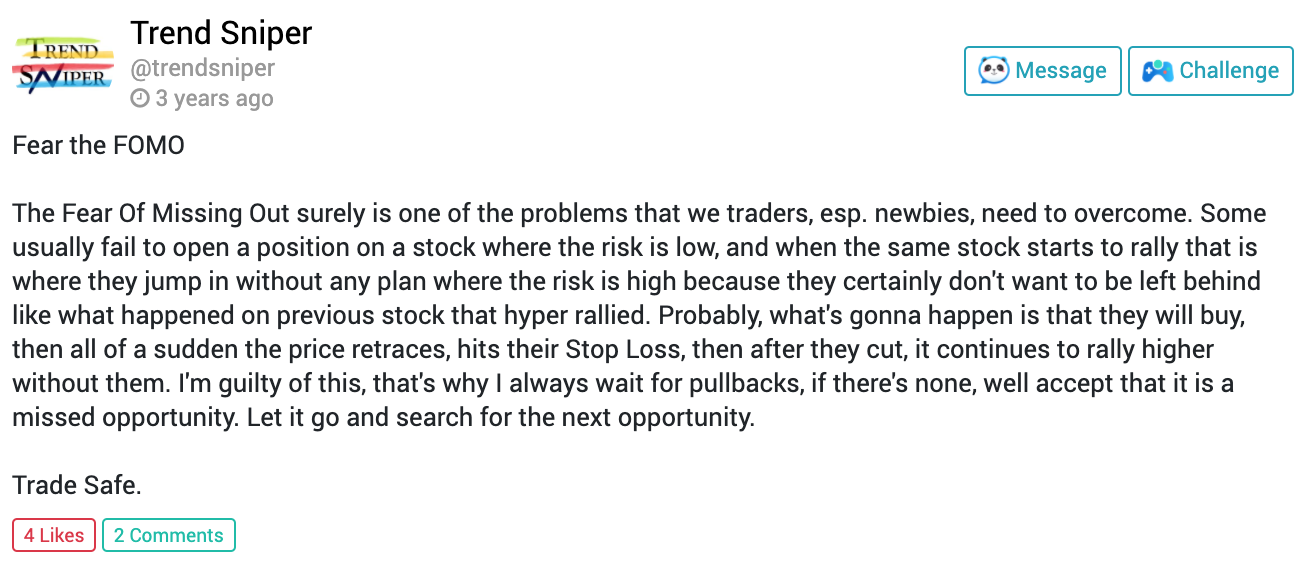
If you’re that trader who’s struggling with reading candlestick charts because of the “noise” it eventually generates causing you to overthink your executions or worse, FOMO, and you wanted an alternative to reading those price charts, then you might want to continue reading. We are going to talk about one of the most underrated views that you can use at your disposal – line charts!

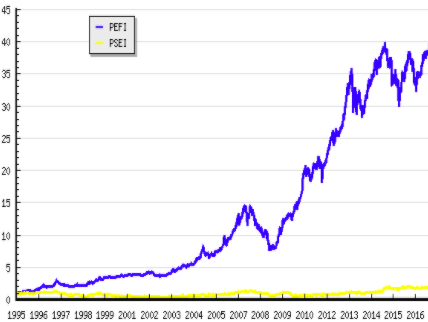
Have you ever wondered what kind of charts analysts use on CNBC? If you try to watch some videos on the web then yes, they mostly use line charts (or some of you might argue mountain charts, but technically they still use lines).

If you’re going to transition from candlesticks to lines, you may need to detach your emotions when looking at candlesticks. But if you’re a newbie and this is the first time you’ve read about lines, then great, you can read this coming from an empty cup.

As with any other trading tool, there are advantages and disadvantages of using this chart view so let’s carefully take a look at them.

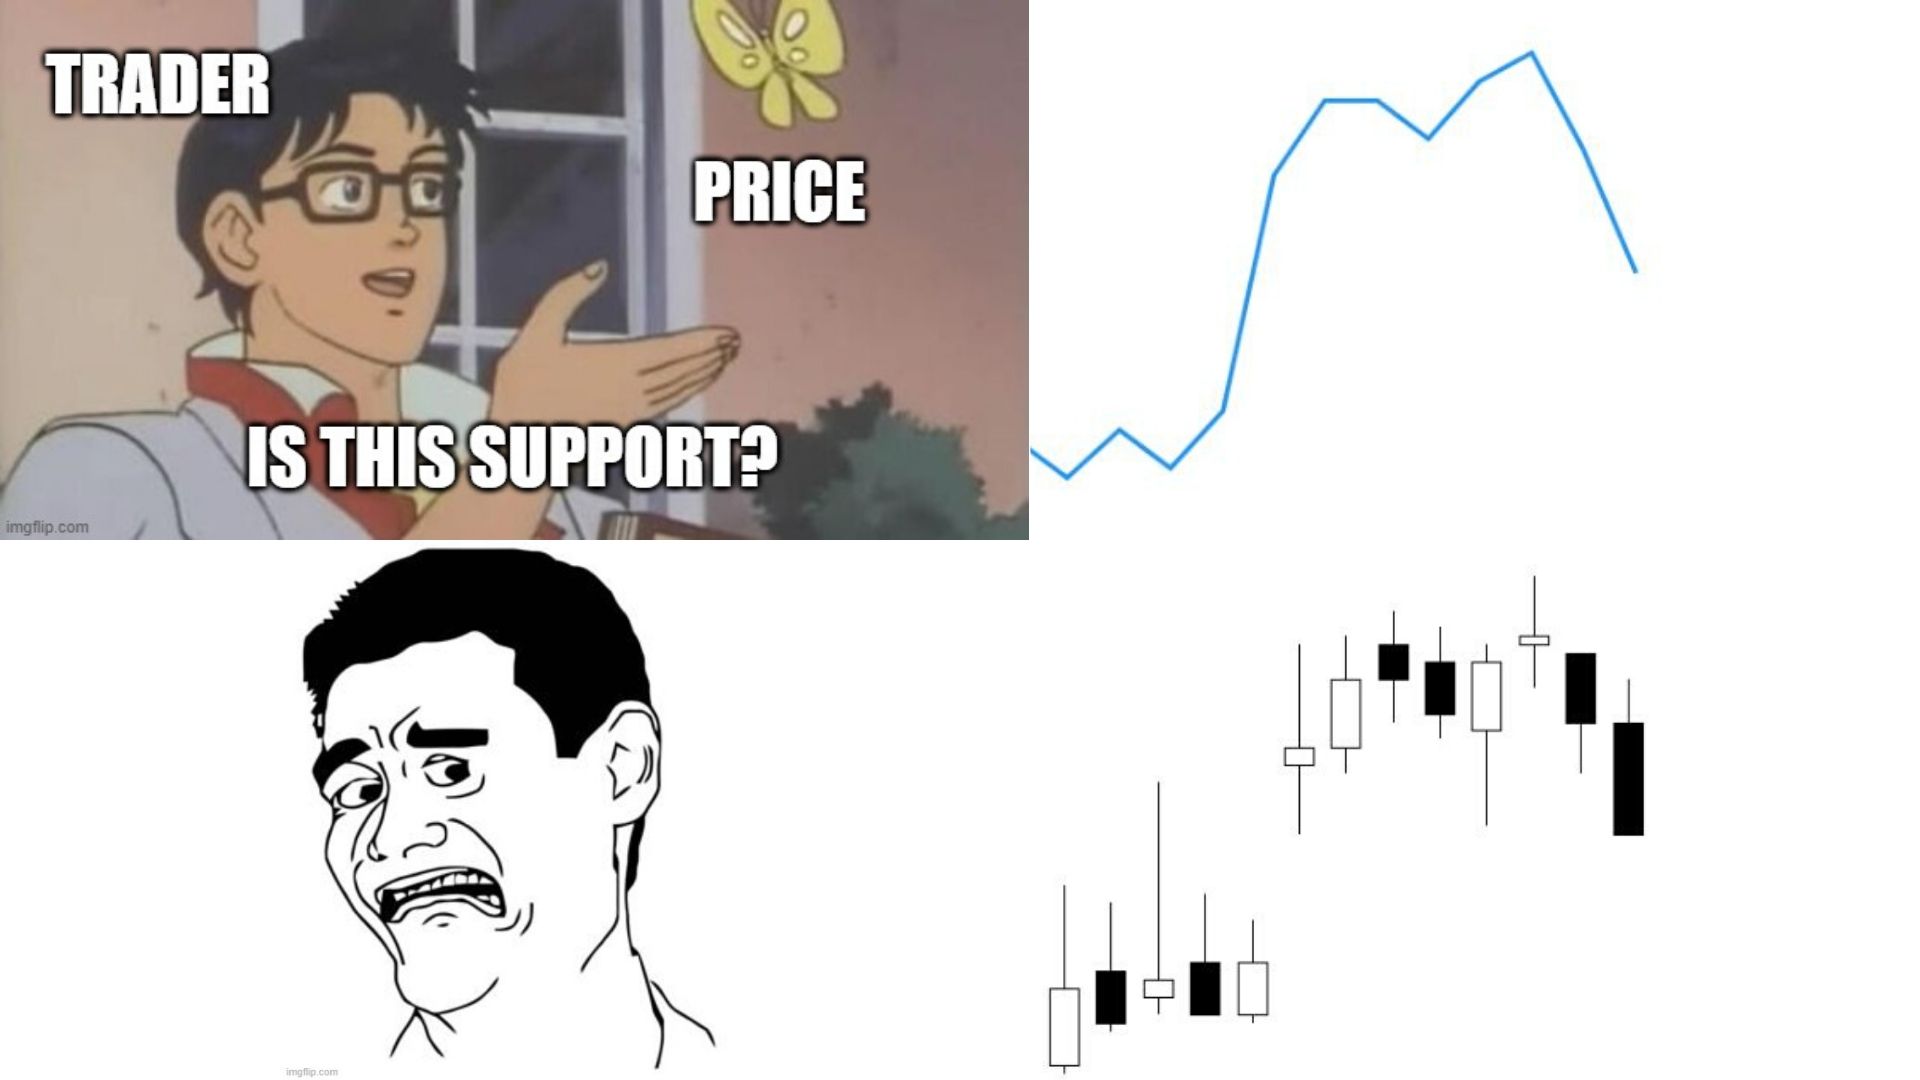
Clearer supports and resistances

The struggle I had during my early stages of trading was actually plotting supports and resistances. If you’ve been following me in the early stages of my trading journey, I used to utilize the Donchian Channels indicator to spot supports and resistances. So here’s an example of its usage with a period length of 10:

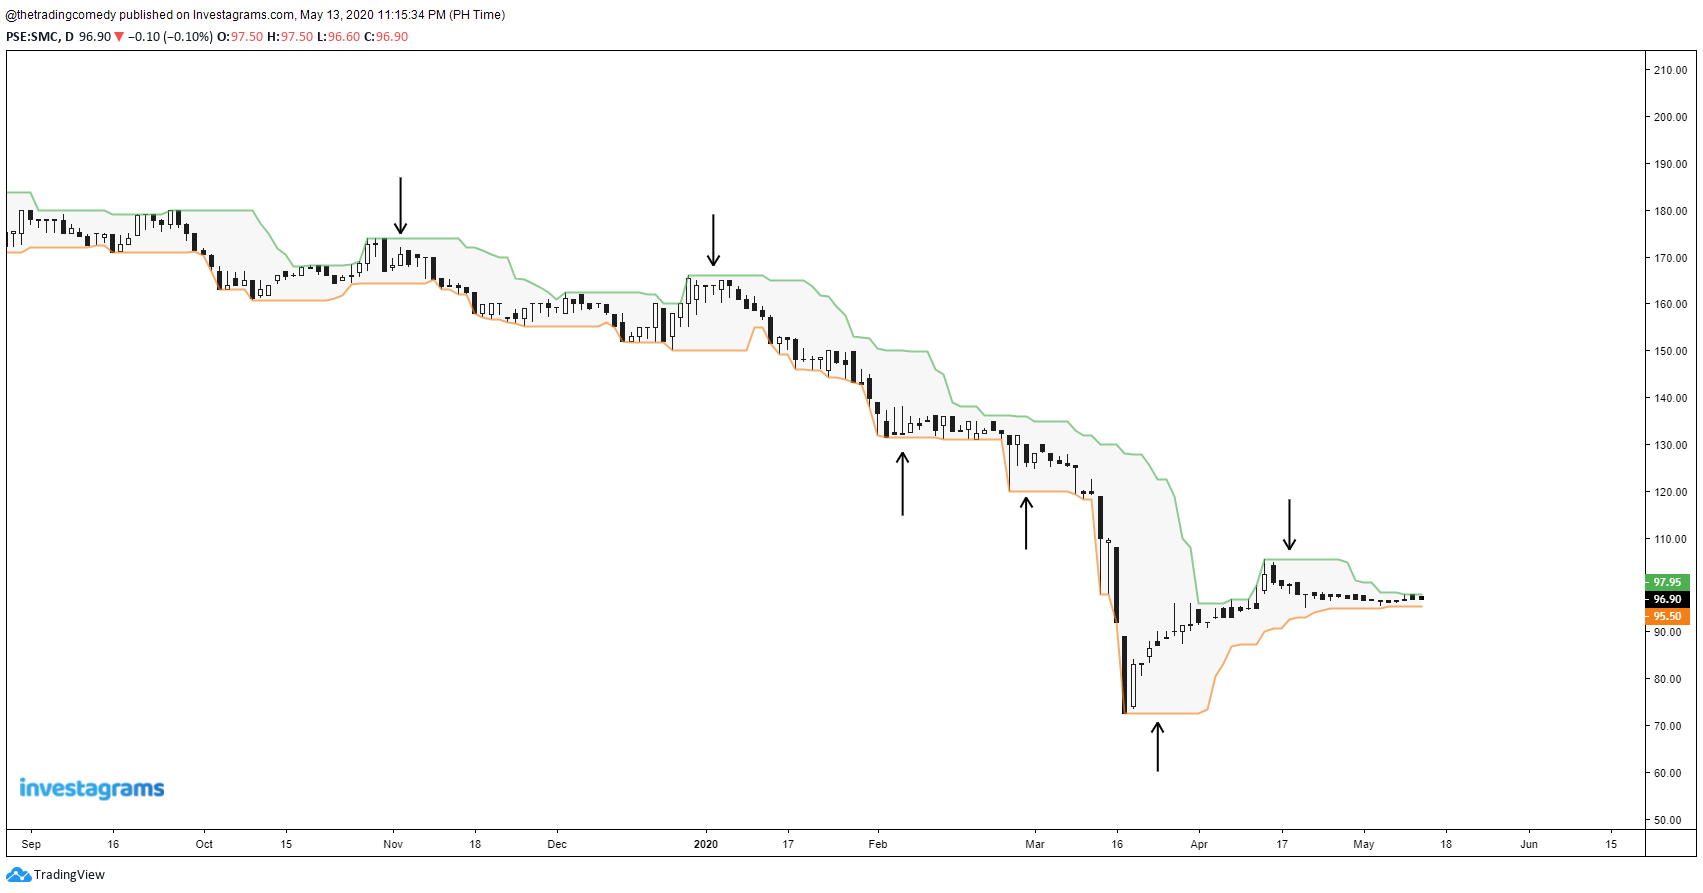
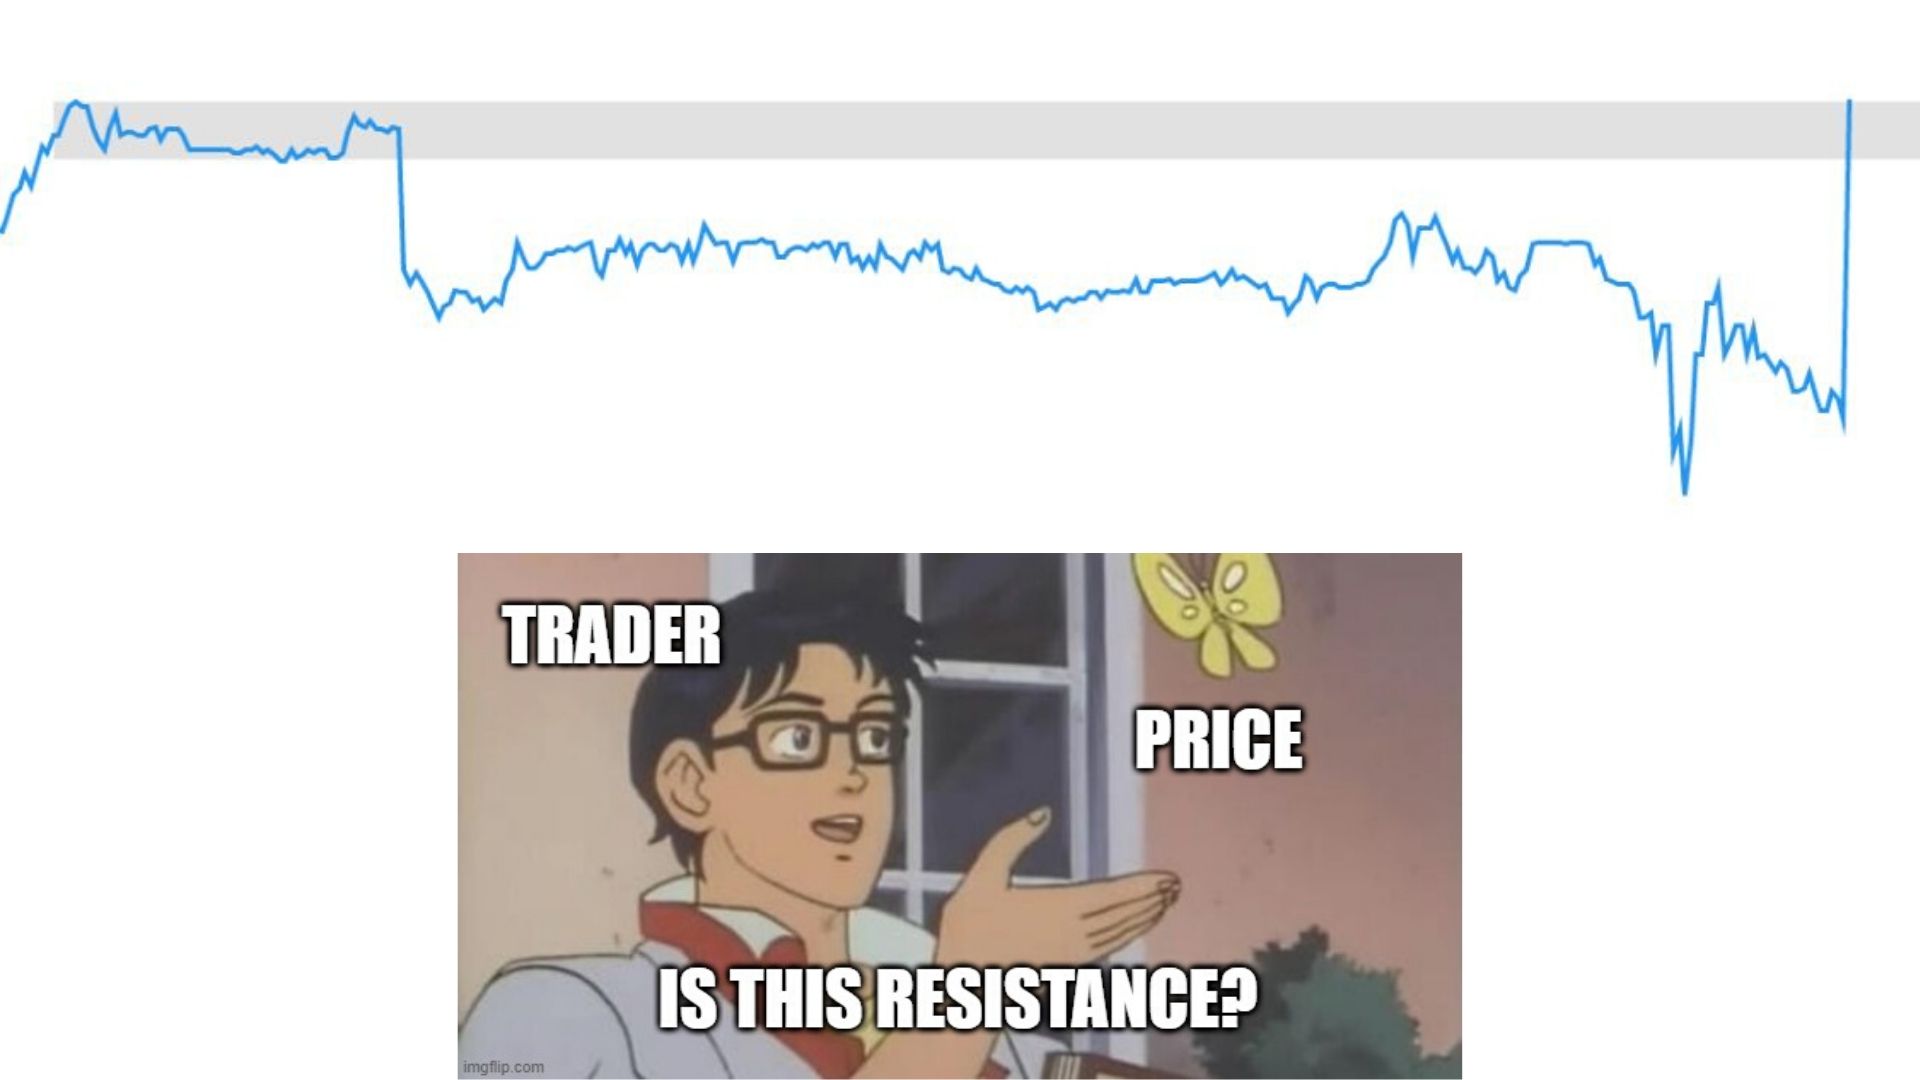
However, the problem with using this is that it might also give false levels causing you to create too many psychological levels inside your head.

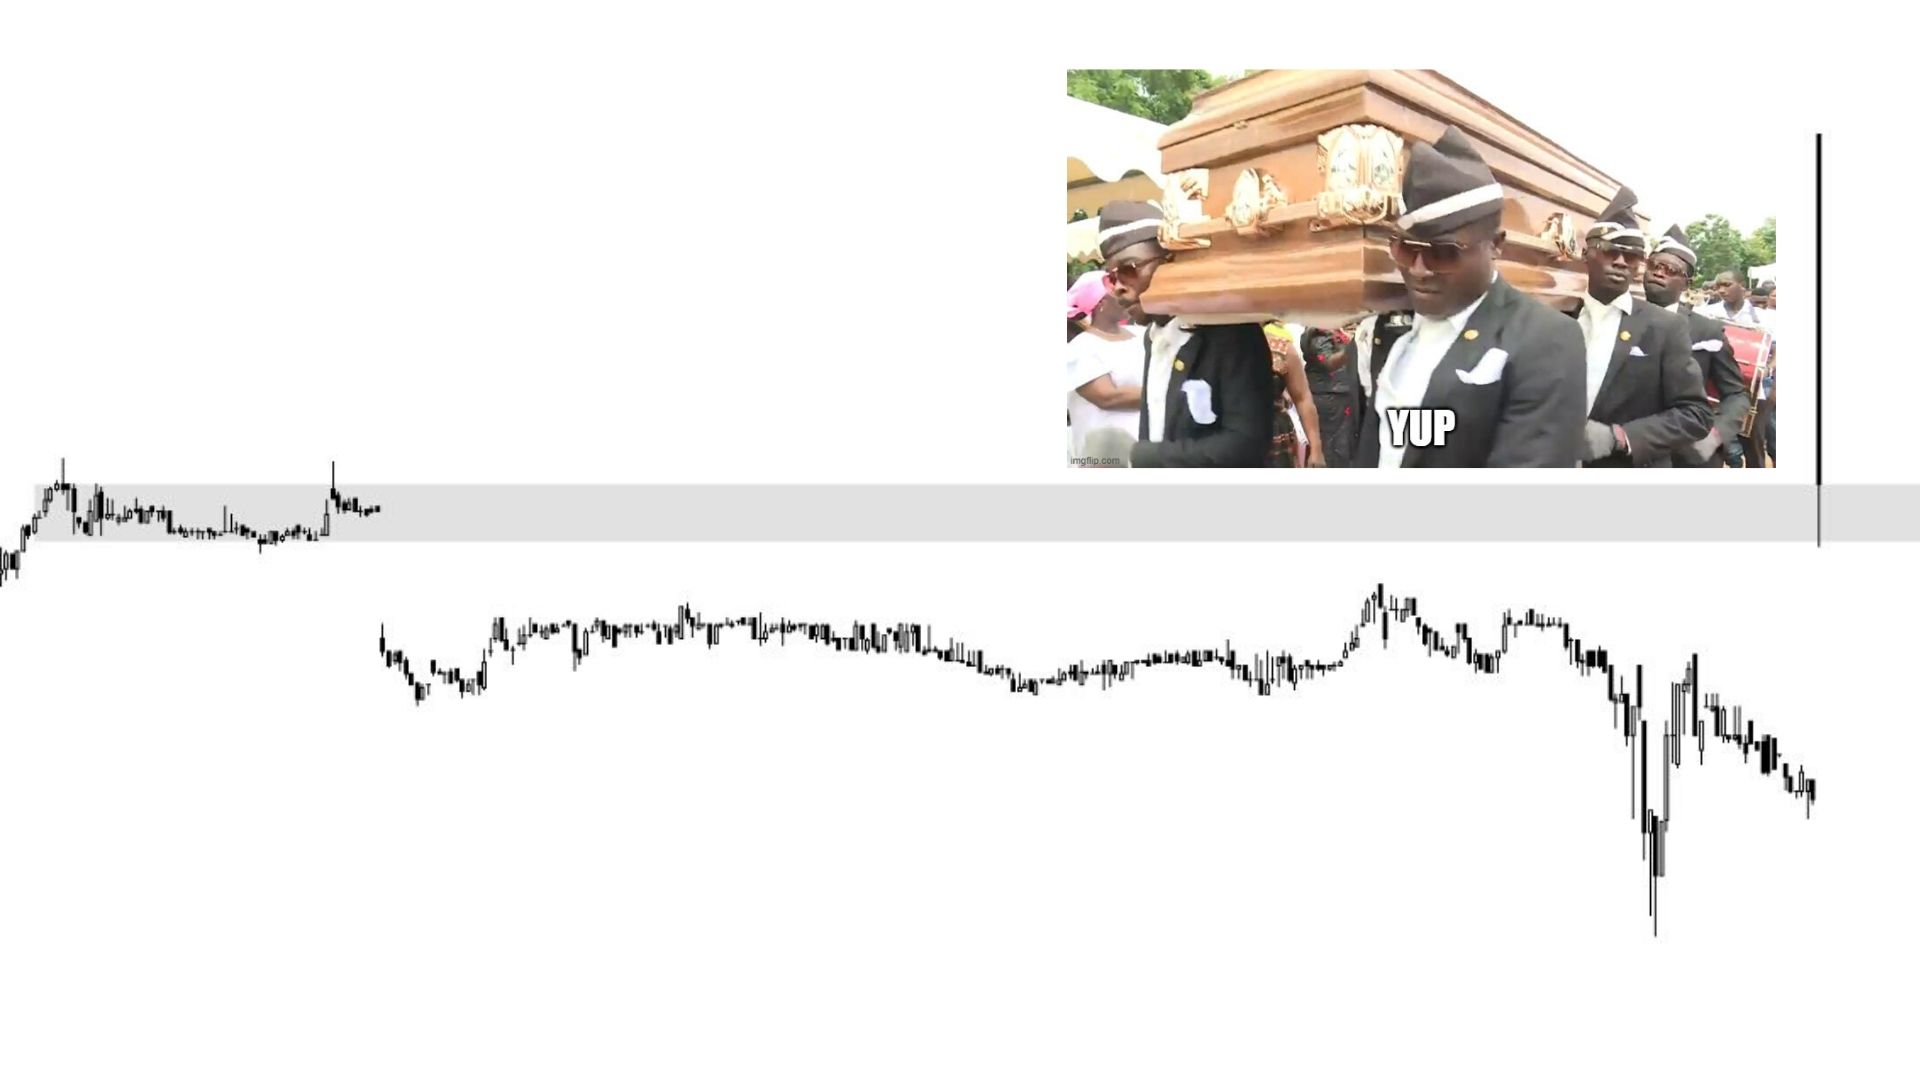
Now let’s see when we view this chart using lines:

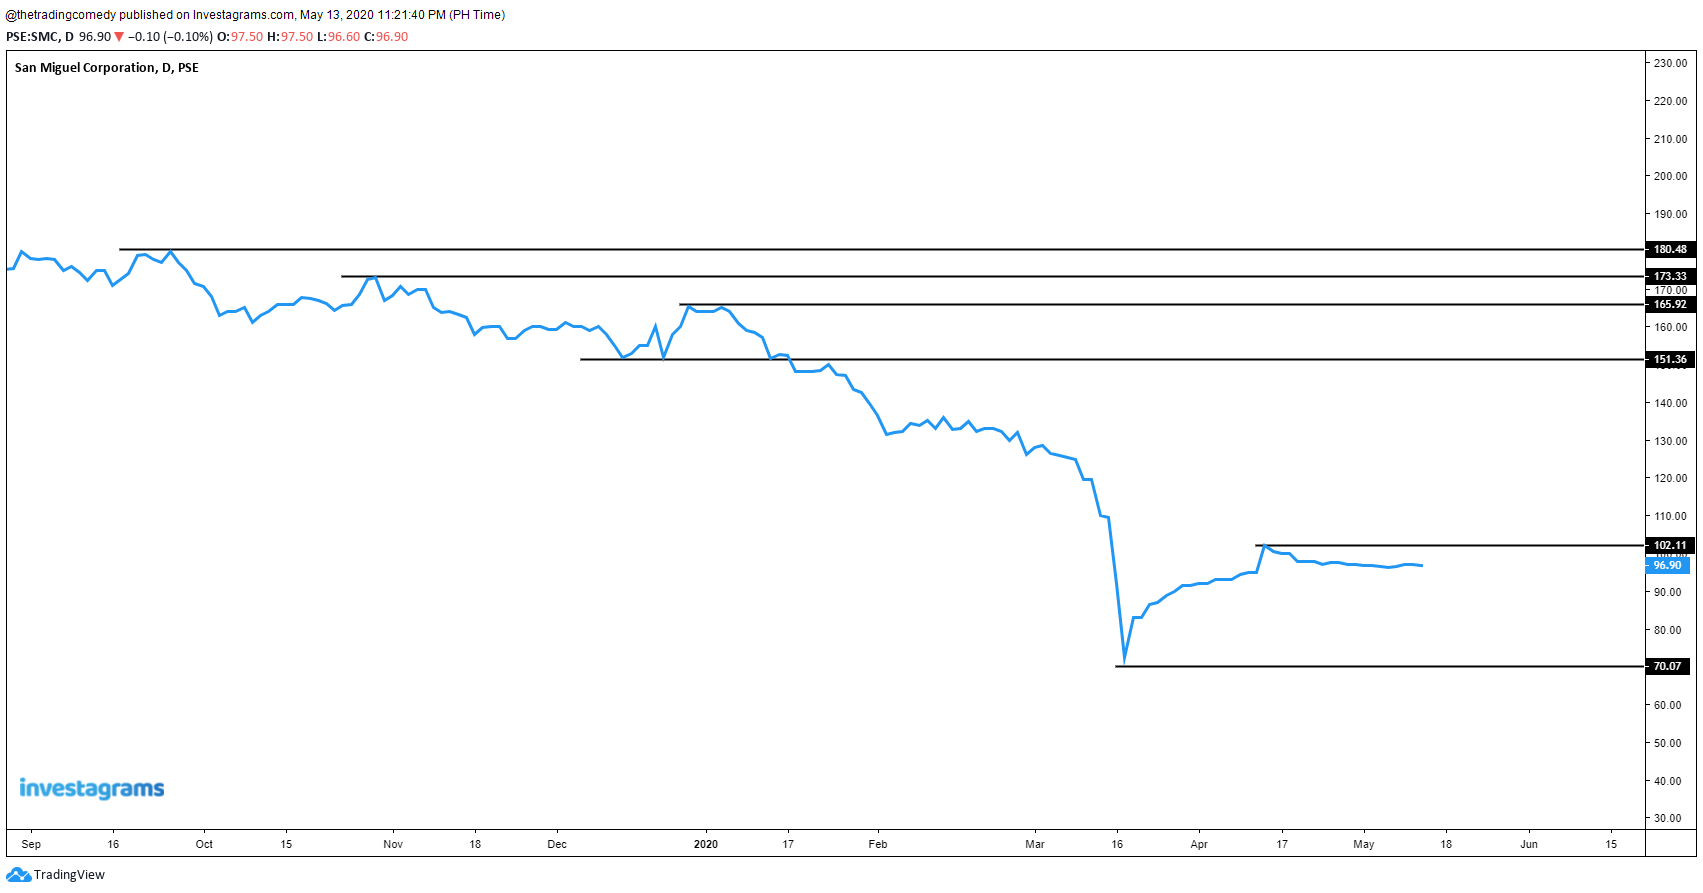
That’s better, and cleaner too!

Looking at the last examples will entirely depend on your visual preference. But with enough practice, you will get used to this.

It’s also easier to draw Fibonacci Retracements as well which brings us to the next advantage of using lines and MY NUMBER ONE REASON why I prefer using this view over candlesticks.

Lines can serve as your secret weapon for Elliott Waves

What are Elliott Waves? I’m not going to delve in too much on the topic since I know that there are contributors better than me who can explain more on detail but I will give you an idea on what it looks like just by looking at this illustration:
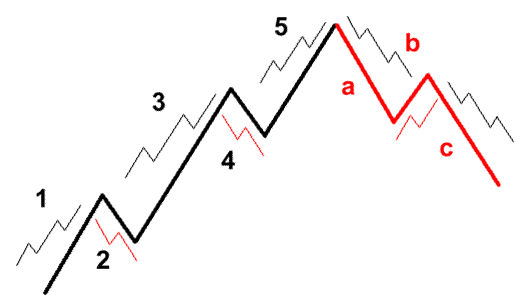
Source: babypips

Don’t get me wrong, I know a lot of awesome Elliotticians like Limitless Investor and Javi Medina who use candlestick charts on drawing Elliott Waves – and yes! I actually tried drawing those waves using the candlestick charts but guess what? It was a real headache for me!

In the brink of giving up on waves, a short conversation between me and Roy Lacsamana last InvestaSummit 2019 completely changed my approach to charts and it can be summarized in this statement:

“You should try Elliott Waves since you’re a musician, it suits you.”

And I can’t believe he was right! After weeks of figuring out why I was struggling, eventually, I found the reason why I was personally having a hard time understanding the waves – I was looking at the wrong view!

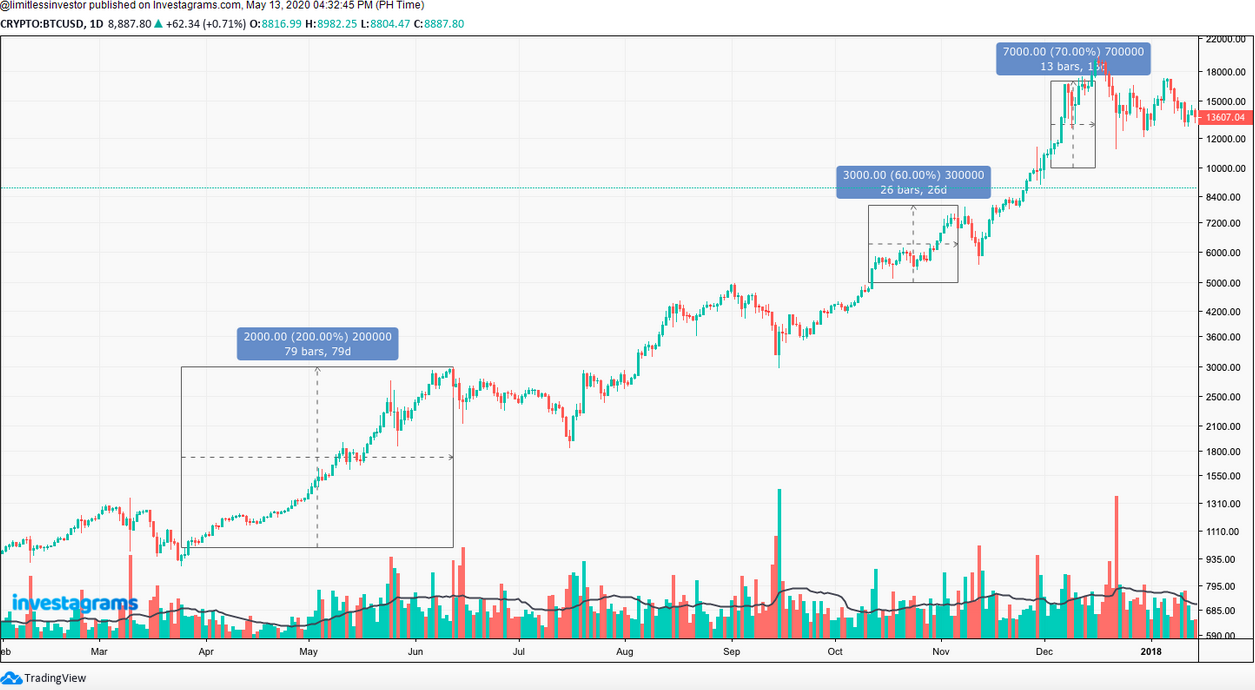
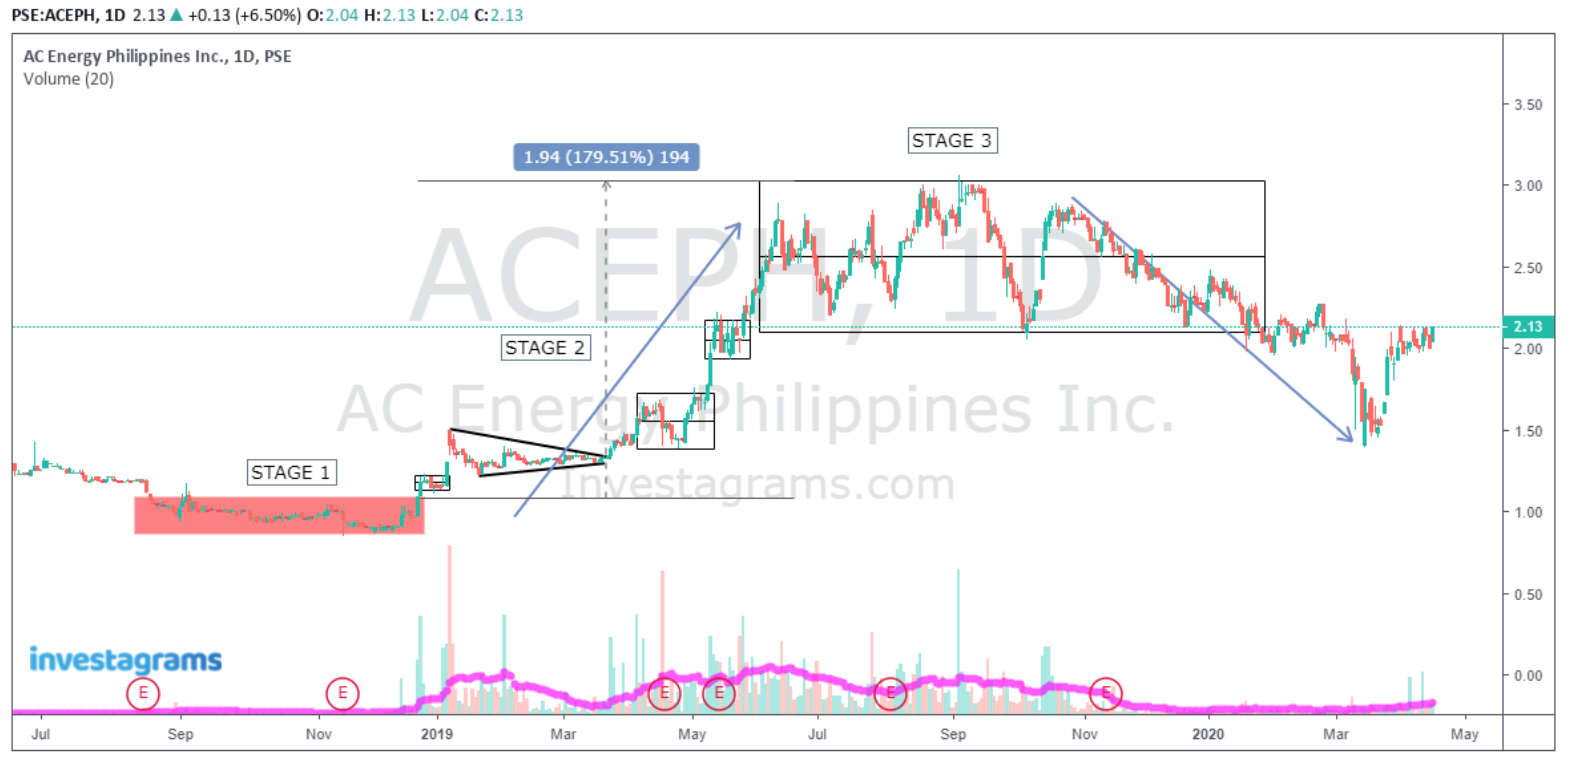
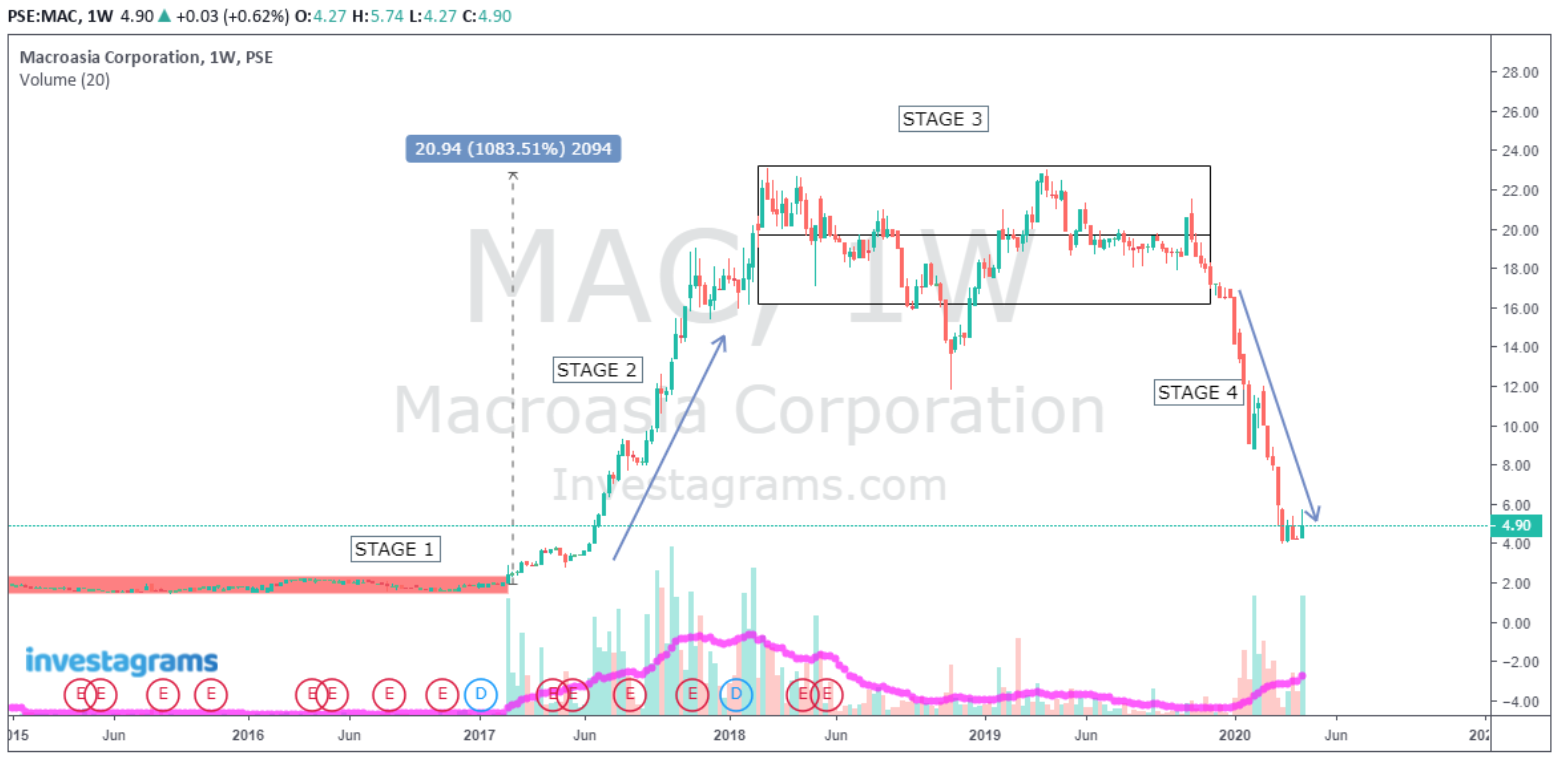
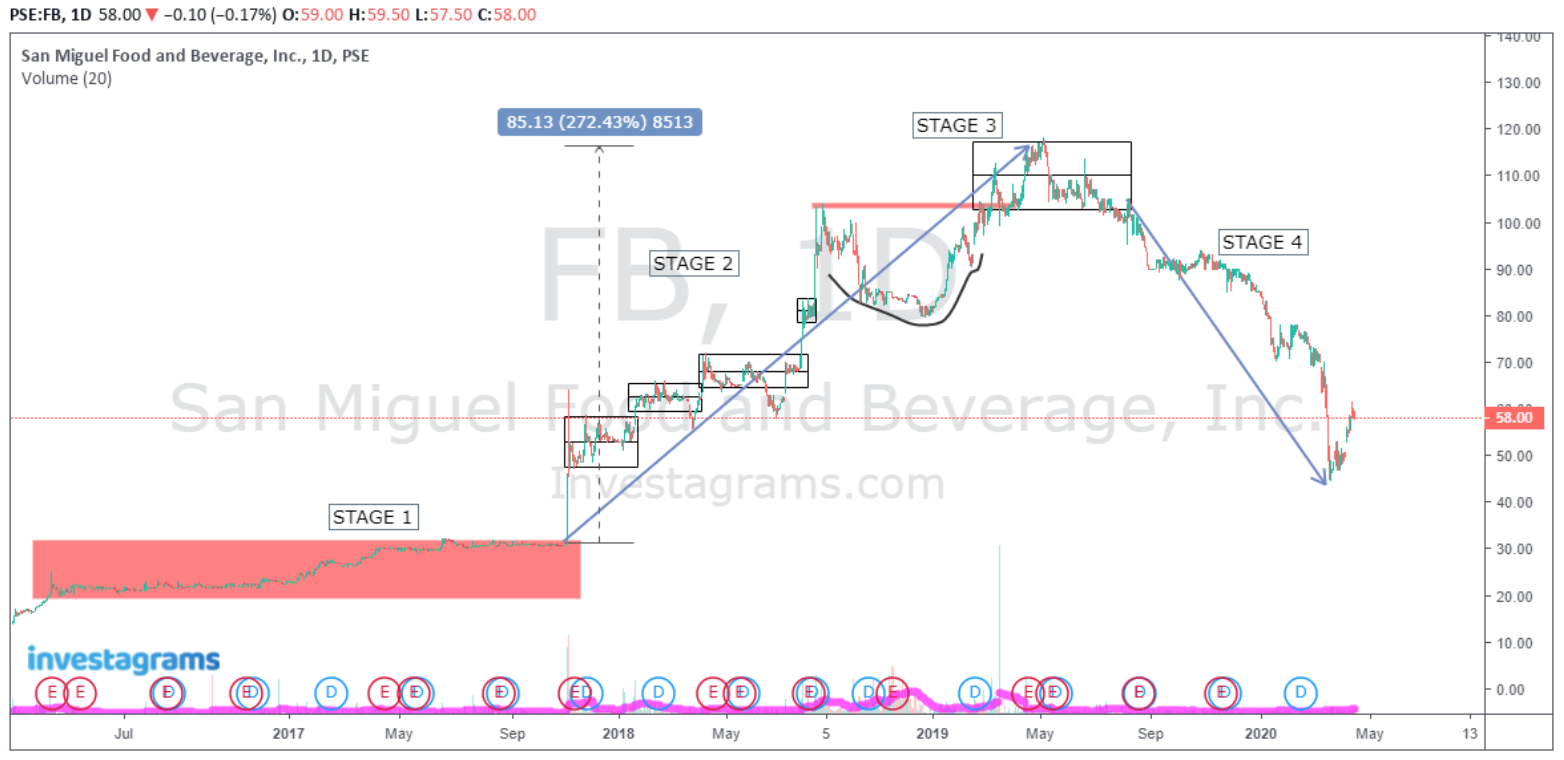
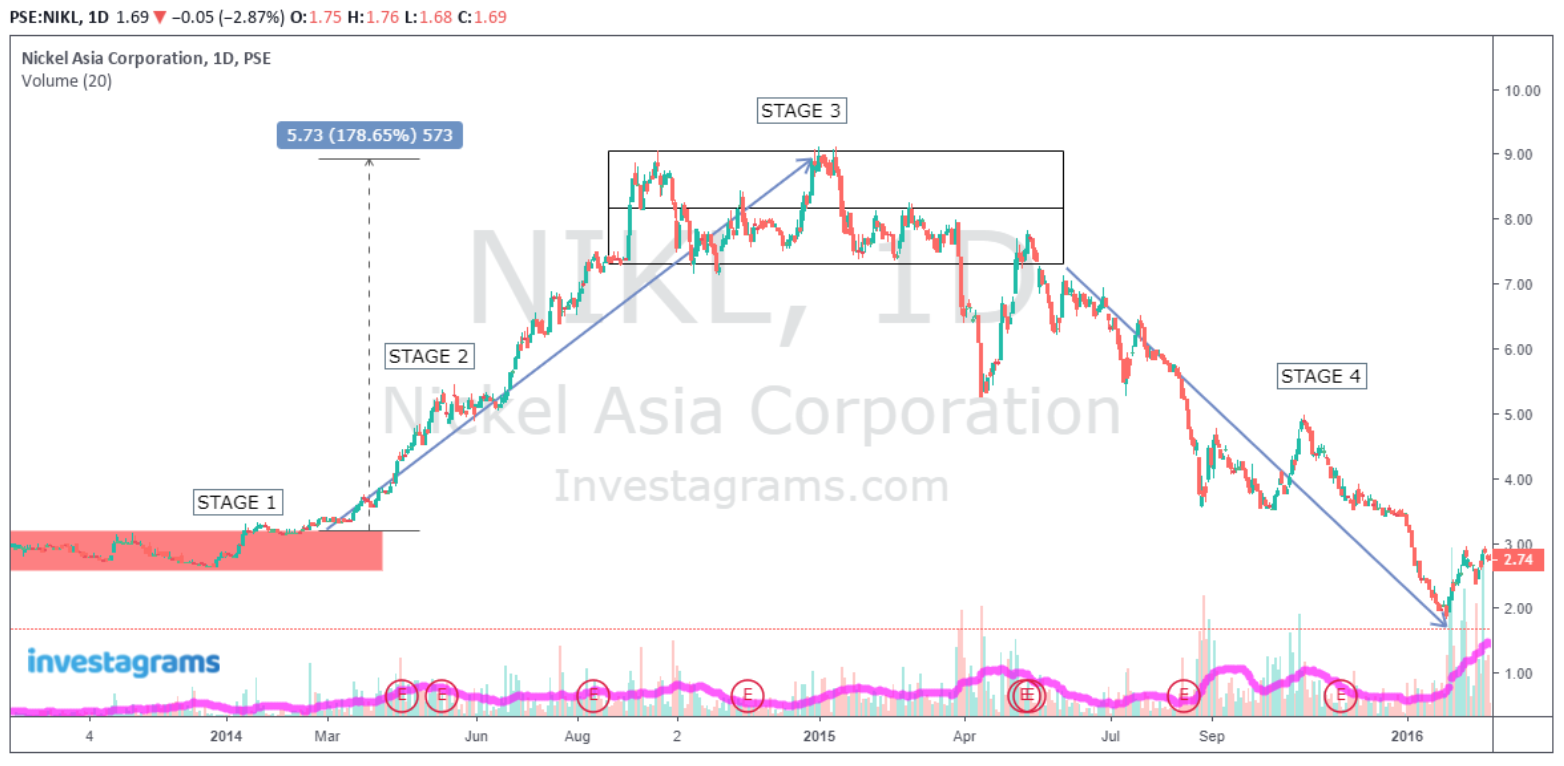
To put this into perspective, let’s reverse engineer an Elliottician’s chart from Limitless Investor, let’s say you have this example:

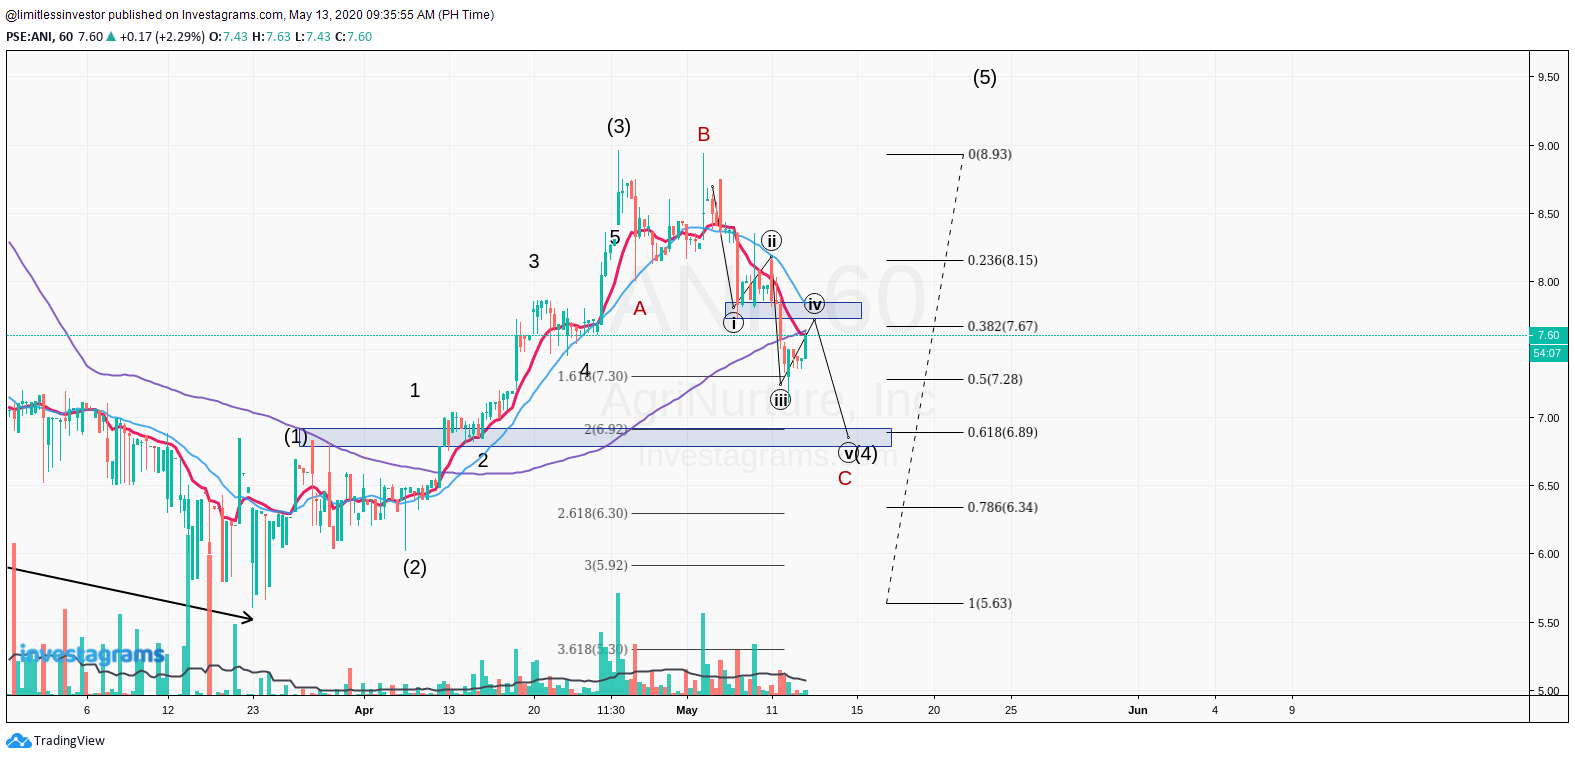
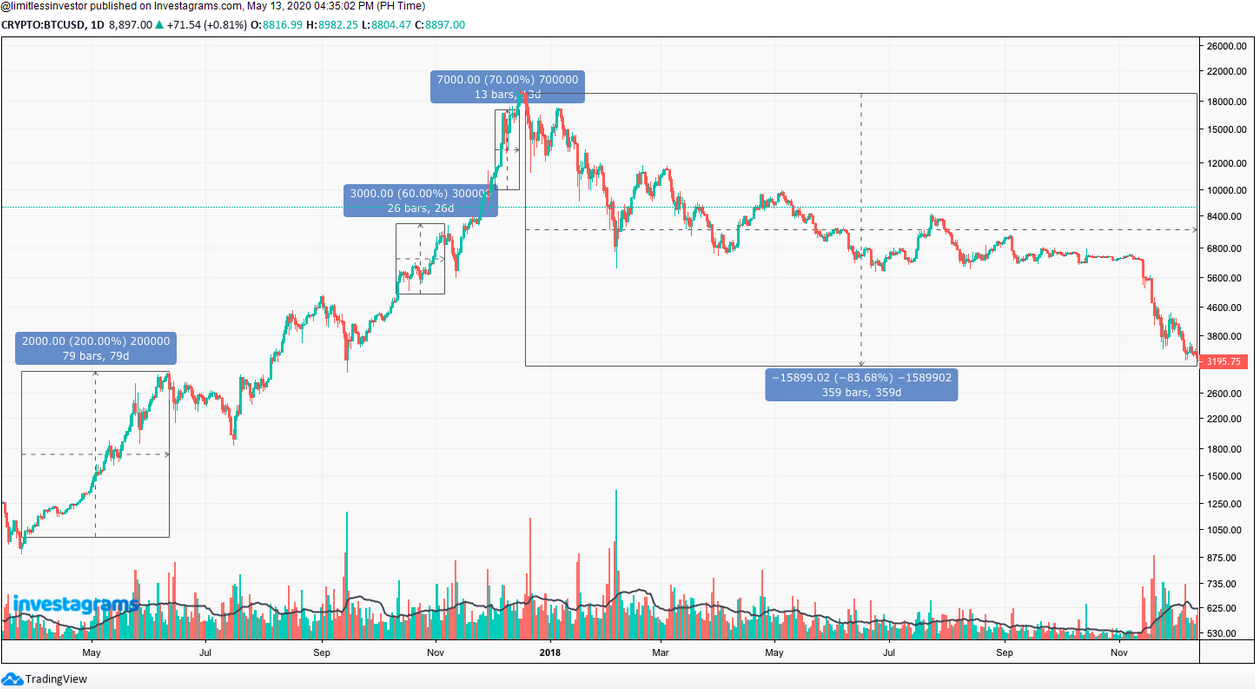
Since this is how I learned to understand Elliott Waves by reading other people’s charts, here is my perspective on his Elliott count using my custom retracement:

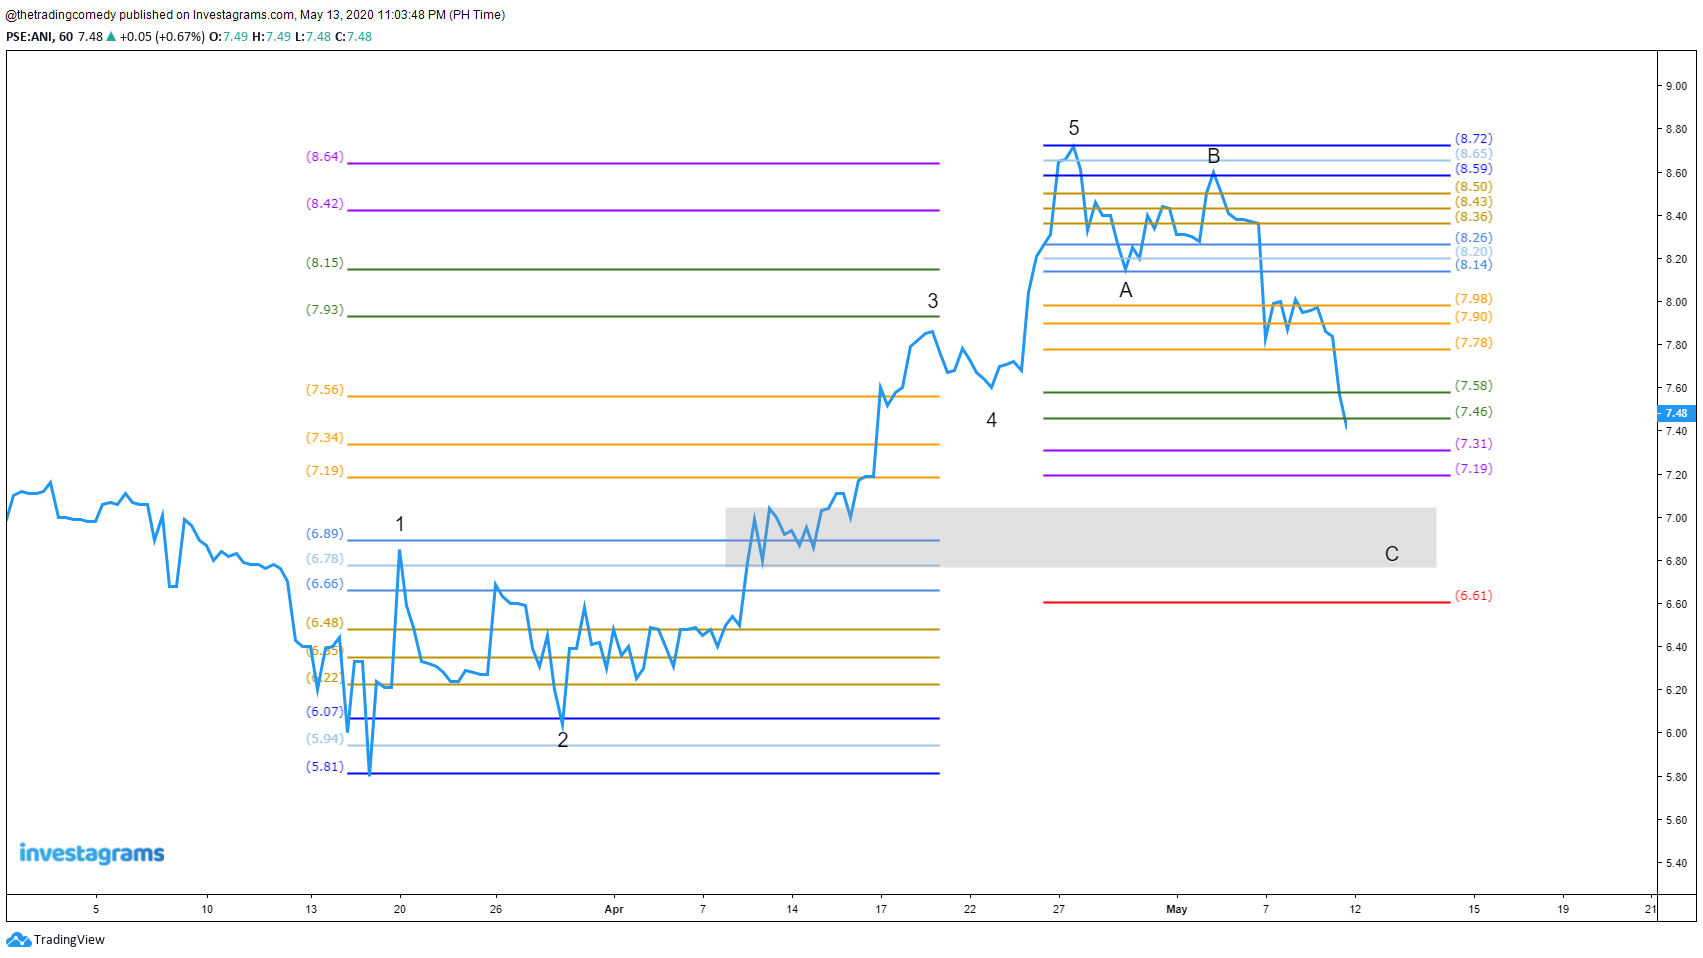
If you compare the two charts, it’s the same view – we’re just using different lenses.

Lines provide pure price action

So far I’ve only found both a pro and a con of using lines – it only gives the closing price. It sounds ironic when you think about it since the goal of the lines is to minimize the noise that you see in the charts, especially for those traders who started with candlestick charts.

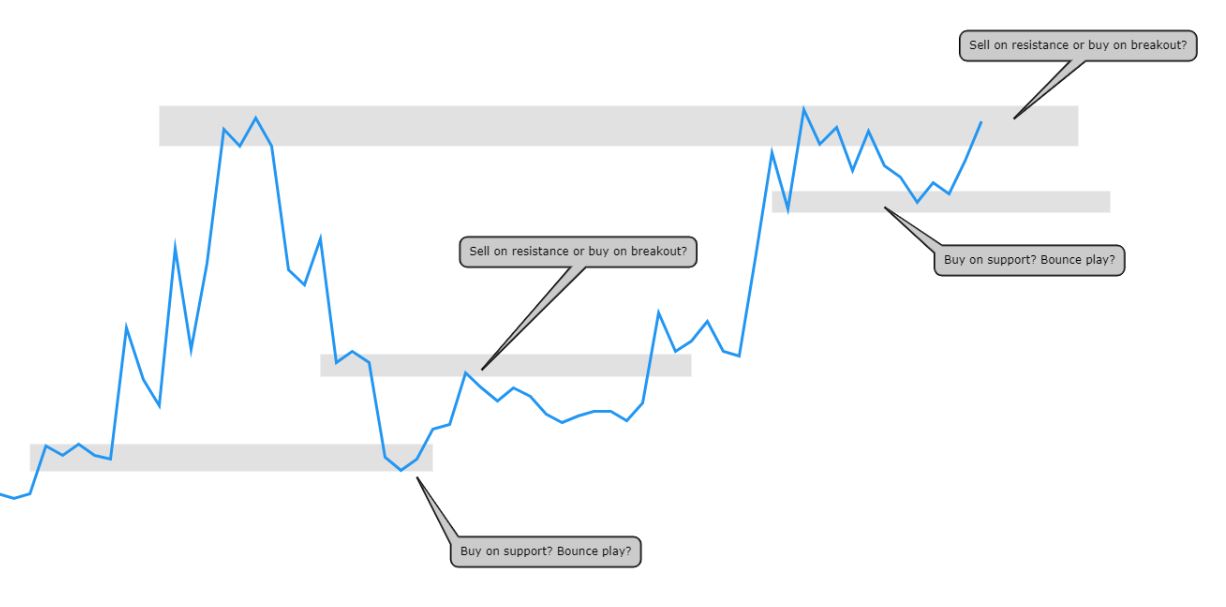
Bounce and breakout plays can somewhat frighten you as a trader if you rely purely on lines. One way to remedy this is to look at lower time frames to verify if an area is a support or resistance, but we’ll save that for another post.

Or you can just quickly switch to candlesticks and observe if the last candle shows signs of strength or weakness.

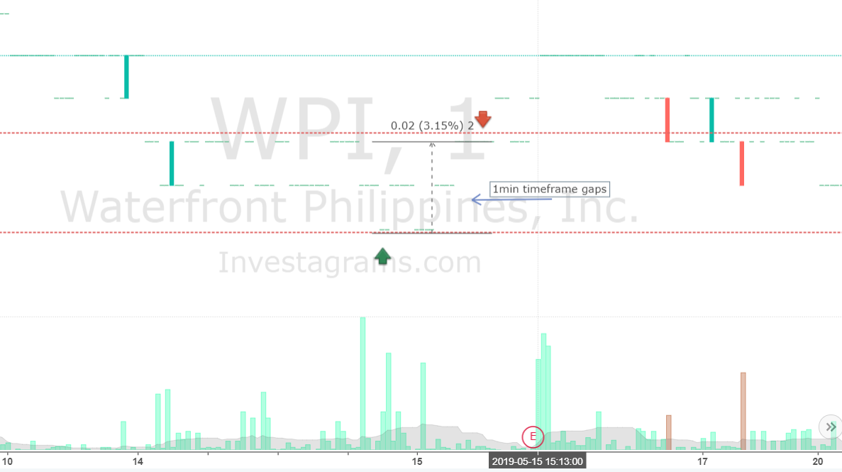
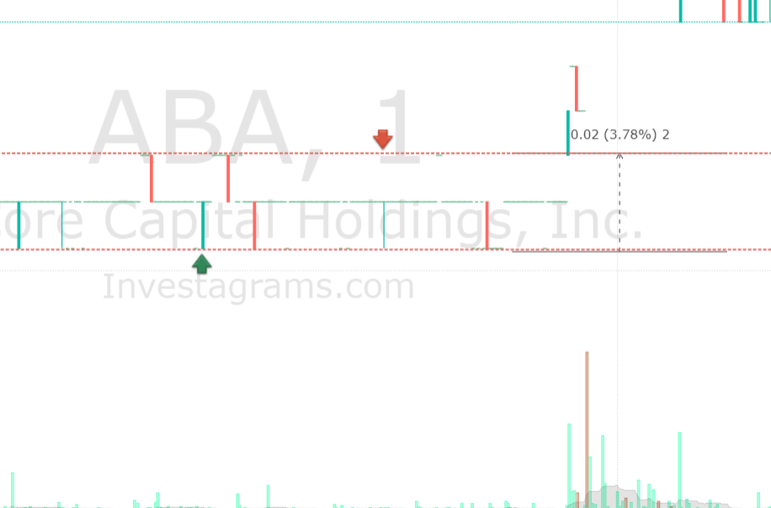
And yes, big and sharp moves created by lines can also give you hints of gaps when you switch to candlesticks.

If you are planning to transition to lines or a newbie and you feel like there’s still “something missing” in the charts, there’s actually an indicator that can help you deal with this problem and we will talk about it in the next section.

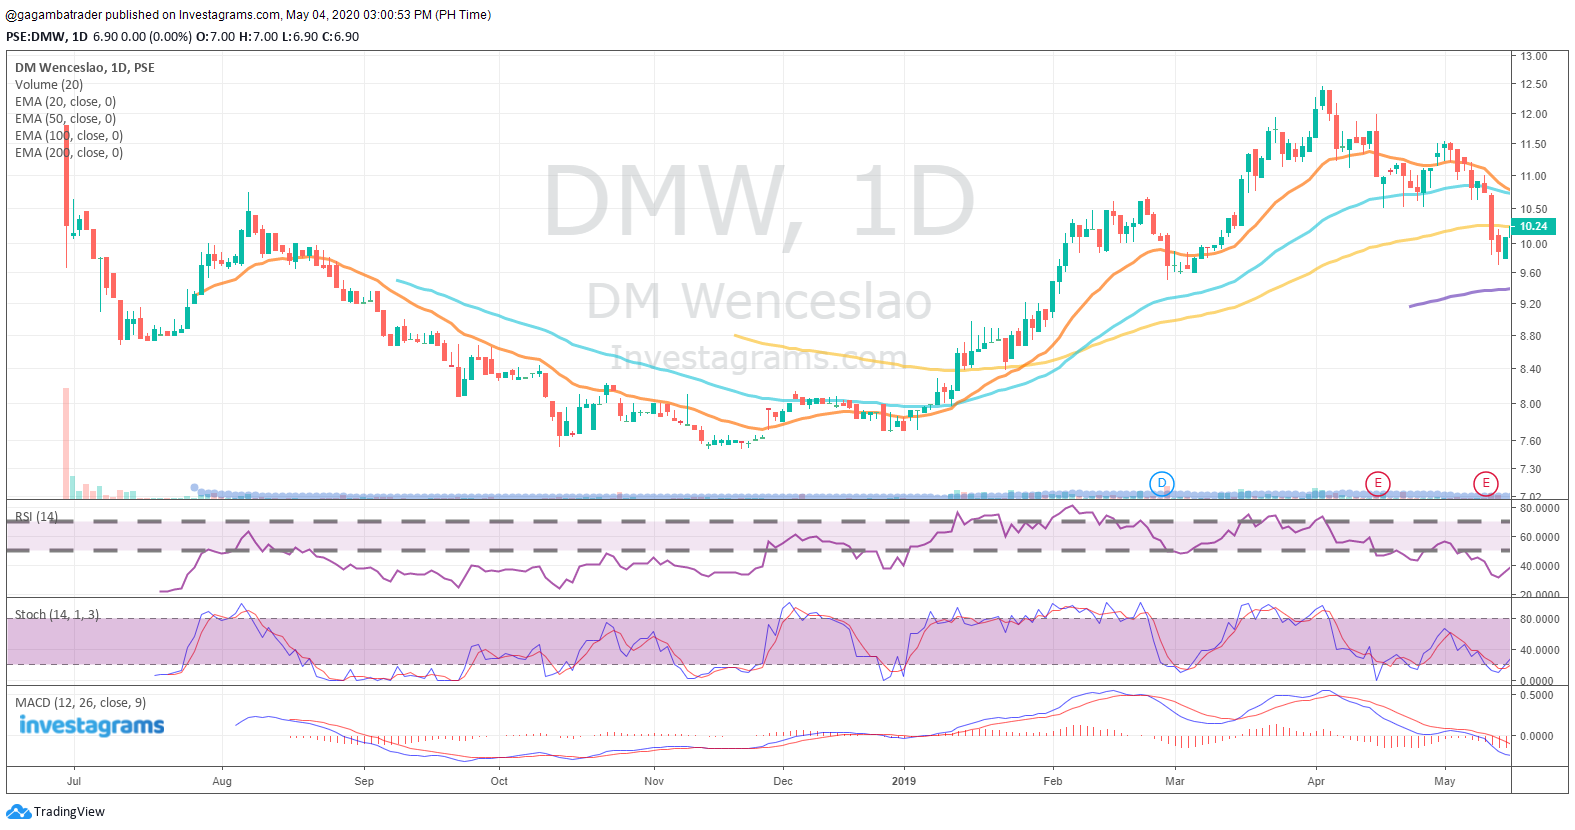
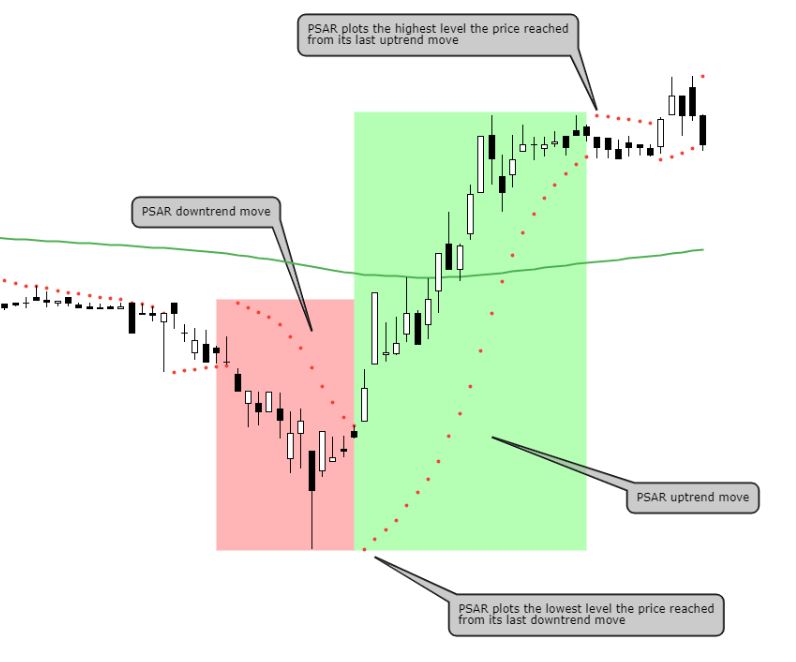
A Parabolic SAR can be your trusty sidekick as well as your “alternate candle high”

Have you ever got into a dilemma wherein you had a good entry but for some reason, you’ve created these psychological barriers that prevent you from holding or taking profits?

This is actually the reason why I got rid of A LOT of moving averages and stuck to only ONE moving average – the 200-period moving average.

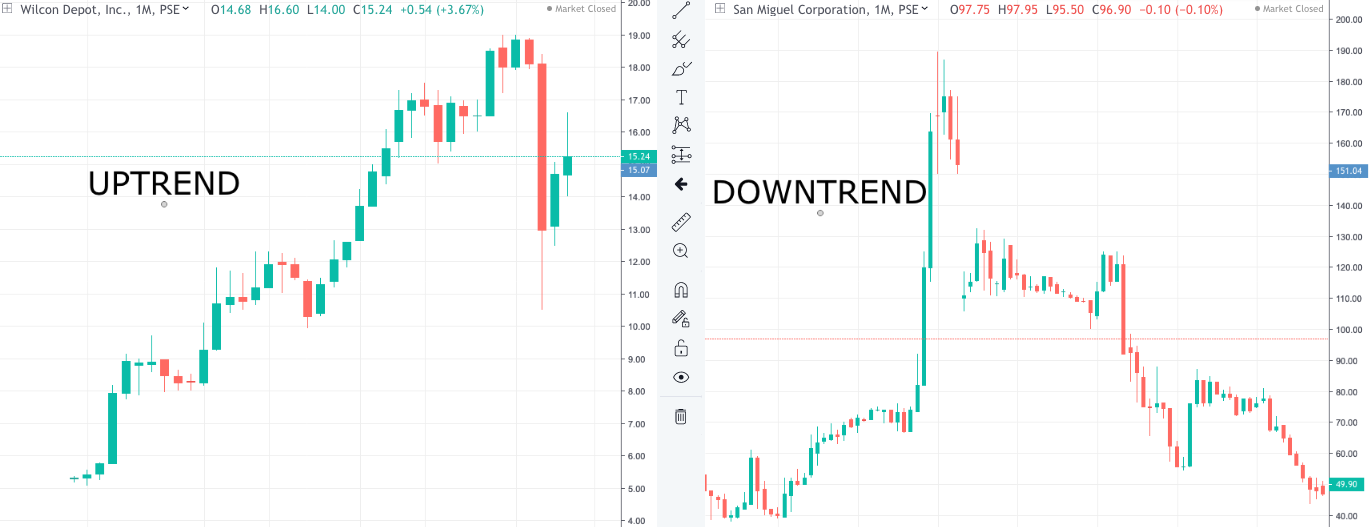
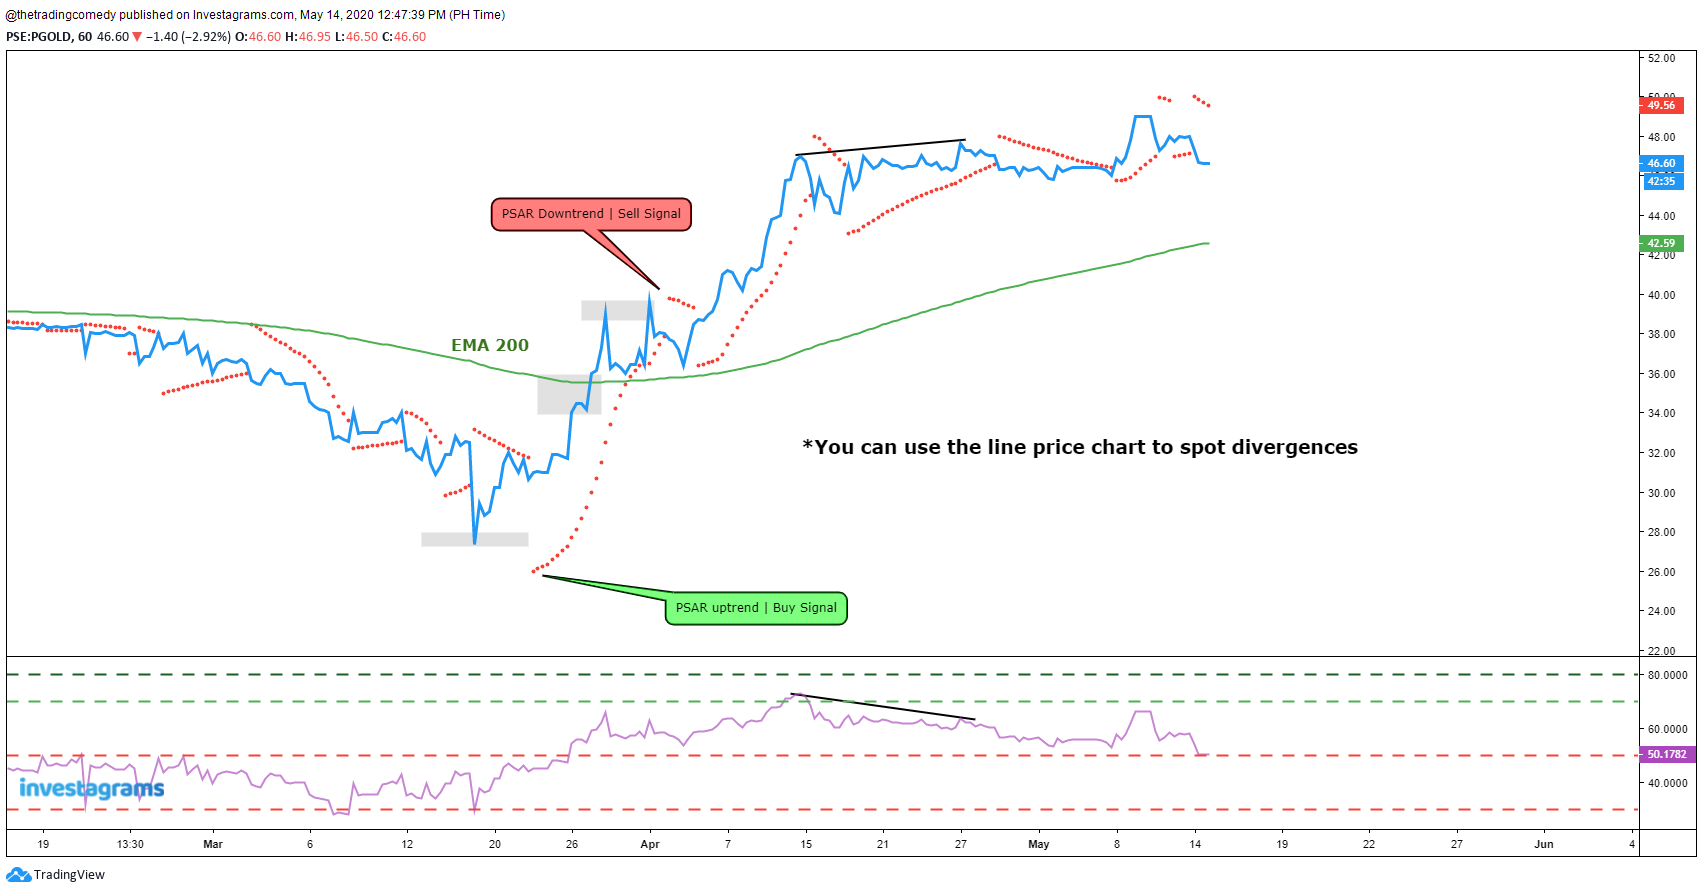
The Parabolic SAR (Stop And Reverse/PSAR) can serve as an alternate indicator for the rest of the commonly used moving averages (20, 50, 100) and the signal is pretty straightforward to understand:

  • When a dot is below the price, it’s an uptrend signal.
  • When a dot is above the price, it’s a downtrend signal.

It’s a trend-following indicator in a way that you can use the first instance of the change of direction as an entry or exit signal. How is this an “alternate candle high” you may ask? We’ll make the charts do the talking:

Less is more

The candlestick is not the only view that you can utilize whenever you want to read price charts. There are other views that you can look at if candlesticks scare you. Sometimes the reason why you can’t execute your trades is maybe you have a lot of indicators that unconsciously give you noise.

In order to understand what view will suit you in your trading, you should discover what you’re visually comfortable with especially if you’re in it for the long road.

Anything is an opportunity, you just have to know where to look!

Now go out there and backtest to find out what trading style suits you and stay tuned for the next posts!


Contributor:

Name: Marvin Alec Padua
Investagrams Username: @thetradingcomedy

Channels:
www.facebook.com/thetradingcomedy
www.twitter.com/alecscorner
www.instagram.com/thetradingcomedy
www.thetradingcomedy.finance.blog
https://tinyurl.com/AlexCornerSpotify
https://micky.com.au/author/apadua

About the Contributor:

A self-proclaimed “Lazy Elliottician”, Alec is a former mobile app developer turned independent singer-songwriter and busker, who goes by the stage name “Alex Corner”. He has a couple of songs on Spotify and other music digital platforms. A self-taught trader, he also created his own trader persona – “The Trading Comedy”, where he documents his trading journey in the Philippine Stock Market and beyond. He is currently a finance writer for Micky News as well as a casual gamer and streamer.


Categories
Featured News & Features

Investa Pro League Round 1 Competition Rules And Mechanics

Welcome to the first ever INVESTA PRO LEAGUE

IT’S TIME TO CHALLENGE YOURSELF

Whether it’s bull market, bear market, or if there are black swan events, the market continues to move forward. The question is, do you have what it takes to thrive in any market environment?

The Investa Pro League is open to ALL. The competition will run for ONE (1) MONTH from June 15, 2020 until July 17, 2020.

Winners and Prizes:

The top three (3) participants with the highest account value at the end of the trading round will be announced as the winners.

Each winner will receive a corresponding cash prize as follows:

1st Place: PHP 25,000.00
2nd Place: PHP 15,000.00
3rd Place: PHP 10,000.00

MECHANICS

1. Registration Process:

A. You must have an Investagrams account. If you don’t have one yet, you can sign-up here for FREE.
B. Anyone can join the competition. Participants may register until June 14 (Sunday), before the competition officially begins on June 15 (Monday).
C. Registration comes along with a subscription of InvestaPro and InvestaPrime to help you have an edge on your trading game.
D. Complete your payment through Credit/Debit Card, Bank Deposit/Transfer, 7–Eleven (Coins.ph), M-Lhuillier, or Cebuana Lhuillier. You will be notified once your payment has been confirmed.
E. Validation of ID. From your Transaction Invoice, or when you click on “Investa Pro League 2020” competition room under the Virtual Trade tab in Investagrams, you will be led to an instructions page in order to validate your identity. If you haven’t uploaded your Proof of Identity yet, please do so, as this is a required step for all participants. Once approved, you will receive a notification and your Proof of Identity under Account Settings will already be marked as Completed. Access to the official competition room will be granted.
F. Important note: Only one (1) entry and account per person is allowed. If you have more than one (1) account to join the competition, you will be disqualified immediately.

Click here to proceed to registration: http://invs.st/InvestaProLeague

2. Investa PRO League will be accessed through the Investagrams Virtual Trading Platform (https://www.investagrams.com/vTrade) and participants will start with Php 100,000.00 virtual money to trade.

3. Participants can only trade liquid and actively trading stocks (we have filtered out which stocks fit this criteria) and have taken out illiquid names that have wide spreads that can be easily abused. The whole stock list can be accessed once you are accepted into the competition. The tradable stock list can be changed.

4. Upon buying a stock, you can only sell it after 20 minutes. This will protect the competition against ‘rinse-and-repeat’ abuses on illiquid stocks that are not realistically in-line with real market mechanics.

5. To promote diversification, maximum exposure in a single stock can only be 1/3 or 33.33% of the portfolio. This requires the participant to buy at least 3 different stocks should they want to fully invest their portfolio. The system won’t allow you to allocate more than 33.33% in a single stock.

6. Buying and Selling Conditions. Participants now have two options when transacting. The first option is to transact using the current price of the stock and use market orders to buy and sell specific stocks at their real-time prices. The second option is to transact using our new LIMIT ORDERS. By using Limit Orders, you won’t need to watch the market the whole day in order to transact in the market.

  • Buy – You can buy the same stock multiple times within a day.
  • Sell – You can only sell the same stock two (2) times in a day. This will be strictly observed in order to avoid abuse. This includes selling in TRANCHES. Example: If you bought 1000 shares of $SMPH at 29 then sold 300 shares at 29.10, then you have only one (1) sell transaction left for $SMPH within the day.

7. Holding period for all stocks

  • We will be applying the twenty (20) minute time lock for taking profits to ALL STOCKS to avoid widespread and rinse-repeat trades. There are instances where specific names are simply bought due to the 2-2.5% widespread sold after 5 minutes once the stock has been ticked up.
  • There will be no timelock or restrictions when selling at a loss.

8. Revision of Tradable Stocks. Investagrams has the right to remove any stock from the list should it suddenly become too illiquid, abusable and/or delisted. Furthermore, Investagrams may also add new stocks on the tradable list as new stocks become more active and tradable in the market. All changes will be announced before implementation.

In such cases that a stock is to be removed, we will follow this process:

  • Investagrams shall notify all the participants via the Investagrams Platform before the market opens.
  • If you still have the stock in your portfolio, you can sell it at any point in time at your discretion.

9. Initial Public Offering (IPO). All upcoming IPOs that will happen while the Investa Pro League is on-going will be added on its SECOND (2nd) trading day.

10. For stocks that will be detected by our WIDE-SPREAD DETECTION SYSTEM (WSDS). The Wide-Spread Detection System’s main condition is that the first (1st) best bid and ask should never be more than 2% at any moment during open market session.

Fig 1. Real-time Market Depth / Orderbook showing the first (1st) best bid-ask data.

Example: $ATN (Refer to Fig. 1)
Given:
1st best bid = 1.11
1st best ask = 1.14
Formula:
X = (1st best ask – 1st best bid) / 1st best bid
Condition:
If X is greater than 2% then WSDS detects that the stock is wide-spread and can be abused.
Solution:
X = (1.14 – 1.11) / 1.11 = 0.02700 x 100% = 2.70%

Verdict:
Since X is greater than 2% then the stock is wide-spread as computed by the system.

  • The participant will be given a prompt that the detected stock is not tradable upon executing a buy or sell transaction.
  • The stock will again be tradable once the system detects that the spread of the 1st best bids/asks are below 2%.

11. On Trading Abuses.

  • Day trading opportunities on natural market moves are normal, but please take note that Investagrams will be on full-guard against participants that abuse illiquid opportunities. We want our winners to show real trading skills that are applicable in the PSE. Abuse of intraday spread trades will NOT BE TOLERATED. These rules are set to protect against the usual ‘rinse-and-repeat’ abuses that are mostly used in virtual trading competitions like this.
  • Read more about ‘rinse-and-repeat trading abuse’ here and why this is not characteristic of a realistic trading strategy.
  • Any player that has more than 10% of their profits from rinse-and-repeat wide spread, illiquid and other abusive trades will be penalized or DISQUALIFIED depending on the severity of their offenses. We will be able to validate this through our data and algorithms that verify the historical transactions of each participant.
  • Any form of hacks, cheats, and abuses shall not be tolerated and will have corresponding repercussions. Suspicious behavior that may not be specified in the rules may also be flagged as ‘abusive’ trading behavior. Warning shall be sent after Investagrams has reviewed and confirmed that the actions are against the integrity of the competition. All trade records shall be verified and those who fail to follow the rules will be disqualified.
  • Participants will only be given ONE (1) warning, any participant who has constantly repeated any abusive trading behaviors (whether illiquid stocks, system abuses, loophole abuses) will instantly be DISQUALIFIED. Investagrams has the right to review any suspicious activity, and if the behavior is deemed inconsistent with real life trading then the said player shall be disqualified.
  • Questionable Transactions. Questionable transactions will be cross-checked through the buy and sell transaction time and the traded stock. Stocks that have more than 2% consistent gaps in the one (1) minute timeframe within the transaction period shall be deemed invalid and Investagrams has the right to deduct the profits from the said transactions. It is normal to trade natural intraday moves and gaps can really happen, but if a participant is constantly trading stocks that have gaps within one (1) minute timeframe and their profits from these kinds of scenarios make up more than 10% of their total profits, then he/she will be automatically disqualified.

Fig 2. Example 1 for one (1) minute time frame gaps with buy (green arrow) and sell (red arrow) transactions

Fig 3. Example 2 for one (1) min. time frame abusable 2% gaps

Fig 4. Example 3 for one (1) min. time frame abusable 2% gaps

Investagrams will warn the player that is proven to be constantly transacting with illiquid stocks with 2% one (1) minute gaps. Basically, any stock that has 2% spreads and do not really have a trend is included in this definition. After the first warning, any player that is proven to repeat this kind of behavior shall be disqualified.

12. Trading Halt. Stocks that are on a trading halt will not be tradable during the halt and will be tradable again during the announced lifting time.

13. Trading Hours: Weekdays from 9:30AM – 1:00PM (This is the current PH trading hours and will be changed once the enhance community quarantine is lifted. Meaning, you can’t trade during off-hours and on weekends.)

14. Participant rankings are constantly updated every 10-minutes and automatically ranked by Investagrams system according to net profit gain/loss.

15. At the end of the competition, the participants with the highest net profits will win. The top 1 to 3 participants shall be announced the official winners.

16. Modification and adding of rules. Investagrams has the right to modify the rules of the competition and add protective measures against any future abuses that may arise to ensure the integrity of the Investa Pro League. Announcements shall be made if there are any changes. Rest assured, we prioritize keeping the competition as FAIR as possible to all participants.

17. Ignorance of the rules is no excuse. All participants are expected to have read and understood the rules and mechanics of Investa Pro League. These are published for the participants’ information and protection. Ignorance of these rules and mechanics is not an acceptable excuse for violation.

18. Joining the Investa Pro League means that you agree with all the clauses mentioned above.

19. If you are part of the Top 3 winners, the FINAL DEADLINE to claim your cash prize is on AUGUST 31, 2020. The cash prize will not be given anymore past this date.

Click here to join Investa Pro League 2020!

Categories
Featured How to & Advice

When is the Best Time to Invest?

The best time to invest is when no one wants to sell AND when no one wants to buy.

An uptrending market is supported by buyers and one of the factors that can lead to a reversal to a downtrend is if there are no more buyers to support the price further. While a downtrending market is supported by the pressure of sellers, one of the factors as well for it to reverse to an uptrend is if there are no more sellers to pressure the price further down.

When everyone is earning and everyone feels like a genius, including myself, during a good phase of the market, economy, company or organisation, you can’t stop the feeling as Justin Timberlake said.

I remember the post about the Lamborghini traversing in commonwealth. Where a certain individual posted on social media and was frustrated that someone in the street is driving off their expensive car while the country is in bad shape due to covid19. While I personally believe there is nothing morally wrong for driving a luxurious car, anyone who knows that the world is not black and white can see that this person driving his/her Lamborghini does not owe anything to anyone at all. It’s not his/her responsibility and not his/her fault.

In analogy, why should I be sad just because everyone around me is sad? In Filipino, “Dapat ba malungkot ako if lahat ng tao sa paligid ko malungkot?” The answer is no.

In relevance, why can’t I be greedy when others are fearful? Should I also be fearful just because they are fearful? I thought the market moves based on what everyone thinks or sees? Why can’t I be fearful when everyone is greedy?

If you were observing the market during 2017. You might be aware of this crazy asset called Bitcoin. At its peak it reached $19,000 parabolically in December of 2017. I remember before it hit all-time high at $19,000 it was slowly peaking from $1,000 to $3,000 in 3 months. Then $5,000 to $8,000 in 1 month. Then $10,000 to $17,000 in just a few days. So on that it went from $18,000 to $19,000 per bitcoin in just a few minutes.

When the crowd is in a euphoric state and no one wants to sell, that is likely the best time to sell your position. A year later $BTCUSD dropped to $3,200 from its all-time high of around $19,000 in December 2018. That’s more than an -80% drop.

The chart below shows the 2008 market crash. Lehman Brothers, one of the largest banks in the US, shocked the global markets when it closed its doors. This was one of the reasons why the global markets crashed, especially the US Stock Market. The $PSEi was not spared and was badly affected.

Some had speculation that the financial system was over. (By the way, 2008 was also the time bitcoin was invented as a hedge against the current financial system.) But there was one fund in the Philippines that was poorly performing but called the bottom in 2008 when no one wanted to buy stocks because everyone else was selling.

It was a brave call by Wilson Sy, dubbed as the Warren Buffett of the Philippines, and that fund was ranked as one of the best mutual funds managed by the Phil Equity management. Wilson Sy and Miguel Agarao were awarded as one of the best fund managers in the country. They bought when most investors were selling and not interested to buy. Imagine in 2008 the financial system was close to collapsing and you told your friends to invest in the stock market, they might have thought you were crazy!

If you’re getting in early on a sleeper stock and everyone is fearful and no one wants to buy it, try to look for signs of reversal for a buying opportunity. Conversely, check when a stock is too parabolic and no one wants to sell. When everyone gets too euphoric and believes that the stock is going to the moon, that can be a good time to sell your position. This is what you call a contrarian approach.

This does not apply all the time; stocks that go up 100% in a month can go up another 50% in a few weeks, while stocks that make new lows can continue to go lower.

In Conclusion

“Be FEARFUL when others are greedy. Be GREEDY when others are fearful.”
-Warren Buffet

Sources:

Philequity: https://www.philequity.net/

Philequity – Awards Best Fund Management:
https://www.philequity.net/news.php?id=20190823173404300
https://www.philequity.net/news.php?id=20181212124330609
https://www.philequity.net/news.php?id=20100713202022323

Wilson Sy Philequity Protege: https://www.youtube.com/watch?v=qqq442nxvL0
Philequity Fund Performance: https://www.philequity.net/pefi.php?mode=Snapshot

Disclaimer: All insights here are not financial advice and are subject to risk. The contributor will not be held accountable as this is his own opinion and bias.


Contributor:

Name: R. Cruise
Investagrams Username: @limitlessinvestor

Channels:
www.investagrams.com/Profile/limitlessinvestor
www.facebook.com/imlimitlessInvestor
www.instagram.com/limitlessinvestor
https://t.me/limitlesstraders
www.tradingview.com/u/Limitless-Investor
www.youtube.com/channel/UCTAuxhwjliCGHBsPNQx32Xw

About the Contributor:

Limitless Investor / R Cruise – Elliottician, private fund manager, and cryptocurrency liquidity provider. Trading for 6 years already but considered a true trader for the previous 3.5 years only as he believes that a true trader must have gone through and traded a bear market. Whether in the long or short side is profitable. Specialty in reversal trades, psychology combined with Elliott Waves and fundamentals.


Categories
Featured News & Features

Investagrams’ Most Helpful Trader of the Week: Trend Sniper

While the trading industry has the tendency to be taken over by negativity and toxicity, Investagrams desire to shed some light by promoting a healthy community among traders. Continuing to encourage the “Tulungan” culture, we are recognizing our most helpful trader of the week: Trend Sniper (@trendsniper).

Since 2017, he has been generous in sharing important information especially to newbie traders – from giving sound advice on having the right attitude, acceptance of failures, and learning from it to sharing his local and global market insights to his fellow traders in the Investagrams platform.

In his recent feed, he still continues to share valuable information about the stock that matters to him and probably matters to his fellow traders, too. What is also worthy of acknowledging is his patience to help his fellow traders understand the implications of the information he shared.

Even with issues about a broker, Trend Sniper generously responded to “Patulong po,” a stress call from a fellow trader.

Dear Trend Sniper, your efforts in helping your Ka-Investa are not in vain. Perhaps in your little ways, you are helping one trader excel and be better in our industry. We hope that you continue to be an active and helpful Ka-Investa.

Your FREE 1-month InvestaPRO access is on the way! Enjoy!

Godspeed!

Categories
Featured How to & Advice

The Golden Indicator

Have you ever wondered when you first started trading in the financial markets on whether a golden indicator and strategy exist? Is there such an indicator that is far superior to the ones we currently know right now?

It is normal for a beginner to seek for a means to have an edge in trading. People would seek foolproof and perfect strategies that they have heard or seen from various sources. They try to find the holy grail in articles or videos online. When I first read a book about trading, I immediately used every indicator that was taught in that material.

To the point that it looked like figure 1 and 2.

Figure 1. $DMW Chart

Figure 2. A Chart with many indicators. Source: FX Trading Revolution.

Referring to the figures above, when you first started learning how to trade, did your chart look like this?

I too am guilty of this. I thought that the more indicators present on the chart, the more accurate the readings and analysis would be. I thought that I would be more profitable when I did this on my chart.

Contrary to common belief, less is actually more. As you can see from the illustration above, having too many indicators would just result in “Analysis Paralysis”. This happens when a trader is about to place a buy order and experiences a “freeze” moment since all the indicators on the chart show mixed signals, some show that it’s time to buy while the others show that it’s better to wait. Using too many indicators may lead to missing out on a winning trade because you’re too hesitant to pull the trigger.

Figure 3. $HOUSE Chart

There is no such thing as a golden indicator or strategy known to mankind. Each strategy and indicator is unique. There are even some that contradict one another. For example, figure 3 shows $HOUSE. It is commonly taught that when RSI (14) reaches overbought levels (equal or above 70), it’s time to sell your position.

So not only do you need to know which indicator works best for your strategy, you also need to know the proper applications of it. For the case of the RSI, trading based simply off overbought and oversold conditions in a textbook manner is only advisable if a stock is consolidating. However, if you’re in a trending market, if a stock is overbought or oversold it’s likely that it will continue in the direction of the trend.

If you sold $HOUSE just because it was already overbought, then you would have missed the entire 100% move. Note that $HOUSE was in a clear uptrend and was making new all time highs at the time the RSI was overbought.

Figure 4. $FRUIT Chart

For illustration purposes, figure 4 is an actual trade that I did for $FRUIT earlier this year. This is how I chart, I mainly use Price, Volume, and EMAs. It may seem simple for a lot of people, but I realized that keeping it simple works best for me.

If you’re really looking for a golden indicator, I’d say it’s actually your TRADING PSYCHOLOGY. As said by countless traders, trading success is 80% Trading Psychology and 20% System used. Mark Douglas, the father of trading psychology, said that the best traders, regardless of the strategy applied, are those who can master their psychology and avoid the common pitfalls average traders go through.

More important than a golden indicator is using a strategy that works best for your personality and circumstances. For example, when I first started trading, I adjusted my strategy based on my current situation at the time. I decided to be a swing and a trend follower given the busy schedule at school. I was able to execute my trades well with the use of InvestaWatcher that lets me know whether to execute the trade based on price alerts.

It’s time to invalidate these trading myths that we hear all the time:

  1. A foolproof strategy exists.
  2. The more indicators that I use will yield more chances of winning.
  3. Mastery of a system is much more important than the mastery of oneself.

Contributor:

Name: Miguel Lorenzo L. Cagampan
Investagrams Username: @Gagambatrader

Channels:
www.investagrams.com/Profile/gagambatrader
www.facebook.com/gagambatraderph/

About the Contributor:

Gagambatrader is a personal brand that aims to provide value and content with regards to trading in the financial markets using Technical Analysis. Gagambatrader aims to influence and provide to the growing community of traders in the country.


Categories
Featured News & Features

Investagrams Featured Trader of the Week: Risky Boy

Congratulations to Risky Boy a.k.a. @riskyboy0210 for spotting $PXP (Philex Petroleum Corporation) 7 days before it strongly broke out higher! This trader saw that momentum was starting to build-up and that there could be potential for an impulse move. Based on his chart, he used RSI levels and simple support and resistance to aid in his analysis.

See his technical analysis last May 12, 2020 here: https://www.investagrams.com/Post/riskyboy0210/1026383

On Technicals

On the daily timeframe, it can be seen that $PXP was forming a higher low with a good amount of volume coming from the bottom. As the stock moved sideways, volatility started to drop. Resistance could be pegged at around the 4.6-4.8 area.

However, by looking at the intraday chart just as @riskyboy0210 did, it can be seen that 4.5 could be a key level to break as selling pressure seems to have moved there especially with volatility gradually decreasing. As the level is broken with good volume, the bullish scenario starts to play out as the 4.5 resistance turns into a support. Just like he said, the break of 4.5 was the start of the momentum play. For those who aren’t familiar, good build-up for bullish momentum often consists of decreased volume and volatility that are coupled with good volume on the breakout and higher lows.

Something else that was used to aid in spotting momentum was the use of the RSI as a breakout indicator. By looking for RSI to make a new high, it can be seen whether or not the breakout was a clean strong move or a choppy one that could be seen as a sign of weakness. To know further about RSI or the Relative Strength Index, you may visit our InvestaDaily article here: A comprehensive guide on how to use the Relative Strength Index (RSI)

Again, we would like to congratulate @riskyboy0210 for being our featured trader for the week (your access to FREE one-month InvestaPrime+ is on its way!) and of course, for snatching a good trade! Happy trading, and always remember to TAYOR!

Categories
Featured How to & Advice

Lifecycle of a Stock

One of the key concepts taught by Mark Minervini in his first book, Trade Like a Stock Market Wizard, is the concept of the lifecycle of a stock. He talks about how all super performance stocks move in stages. The following are the four stages of a stock’s lifecycle:

Stage 1 = Neglect Stage
Stage 2 = Advancing Stage
Stage 3 = Topping Stage
Stage 4 = Declining Stage

Minervini’s trading methodology focuses on latching on to key market leaders before they make their rapid price advance, he wants to make the most amount of money in the least amount of time. This is why he focuses on stocks that are in Stage 2 uptrends. Minervini likes to trade stocks that are making new highs and breaking out of sound consolidations; he prefers to trade with “the wind on his back.” He uses a base counting strategy which helps you identify where the stock is in its Stage 2 uptrend. To learn more about base counting check out this article: Base Counting: Identify the Lifespan of Today’s Leading Stocks

Now let’s go through all the stages a stock will go through. Many may be wondering, “Why not just buy a stock that is at Stage 1 and just wait for it to go up?” The problem with this, unless you’re a value investor, is the opportunity cost. No one will ever know when a stock will come out of the Neglect Stage, it may take months or even years for it to make its first run-up. During the time you spent waiting for your laggard stock in Stage 1 to go higher, there are countless stocks, especially if we’re in the right environment, that are making new highs in Stage 2 uptrends.

Now to the stage you should focus on, the Advancing Stage. This is the stage where stocks make their biggest moves, and the stage you will not want to miss out on. Stocks can double, triple, quadruple, and possibly much more over a certain period of time, especially if we’re in a proverbial bull market. You want to always keep an eye on stocks breaking out from early-stage bases after an initial run-up and stocks making new 52-week or all-time highs on massive volume. This is where money is made.

The third stage is the Topping Stage. In this stage stocks start to enter late stage bases, maybe a 4th or 5th base. In Stage 3, this is when it’s obvious that the stock is a super performer in the market and everyone, including your barber, wants to get their hands on it. At this point, the smart money who bought during the early bases are already selling into strength as more retail traders get their hands on the stock. Distribution starts to take place and the price action becomes much more choppier while the stock is in a wider range than the previous consolidations.

The final stage is the Declining Stage. Stocks in Stage 4 are those we want to avoid at all costs. Yes, there are opportunities for counter-rally or bounce plays, but if we’re in a bull market why try to force the issue on low probability plays? We want to trade with the trend; as the proverbial saying goes, “The trend is your friend!” As the stock declines it will continue to make a pattern of lower highs and lower lows, while there are some investors who bought at or near the top still holding on to their big losses. If you didn’t sell during the Topping Stage, you will definitely need to sell here.

Below are a few examples of stocks that went through stages 1-4:

As we’ve just experienced one of the strongest market crashes in the history of, not only our local, but the global markets as well, let’s use this time to learn how to take advantage of the opportunities that will come in the next bull market. Whenever the market has finally confirmed a bottom, you will see stocks coming out from Stage 1 entering on to Stage 2, these names may likely be the next market leaders of the next cycle.

Subscribe to our Newsletter

Join our mailing list for investing tips and stock market advice
to help you reach your first million.

You have Successfully Subscribed!