Categories
Featured News & Features

Investagrams Featured Traders of the Week: Ferdinand and Poppy

As traders are rejoicing at the sudden influx of foreign buying, it’s also time to celebrate our featured traders of the week! We would like to congratulate Ferdinand Roaquin a.k.a. @bong_r and Poppy a.k.a. @poppykat for doing a job well done adding value to the Investa Community.

The Technician

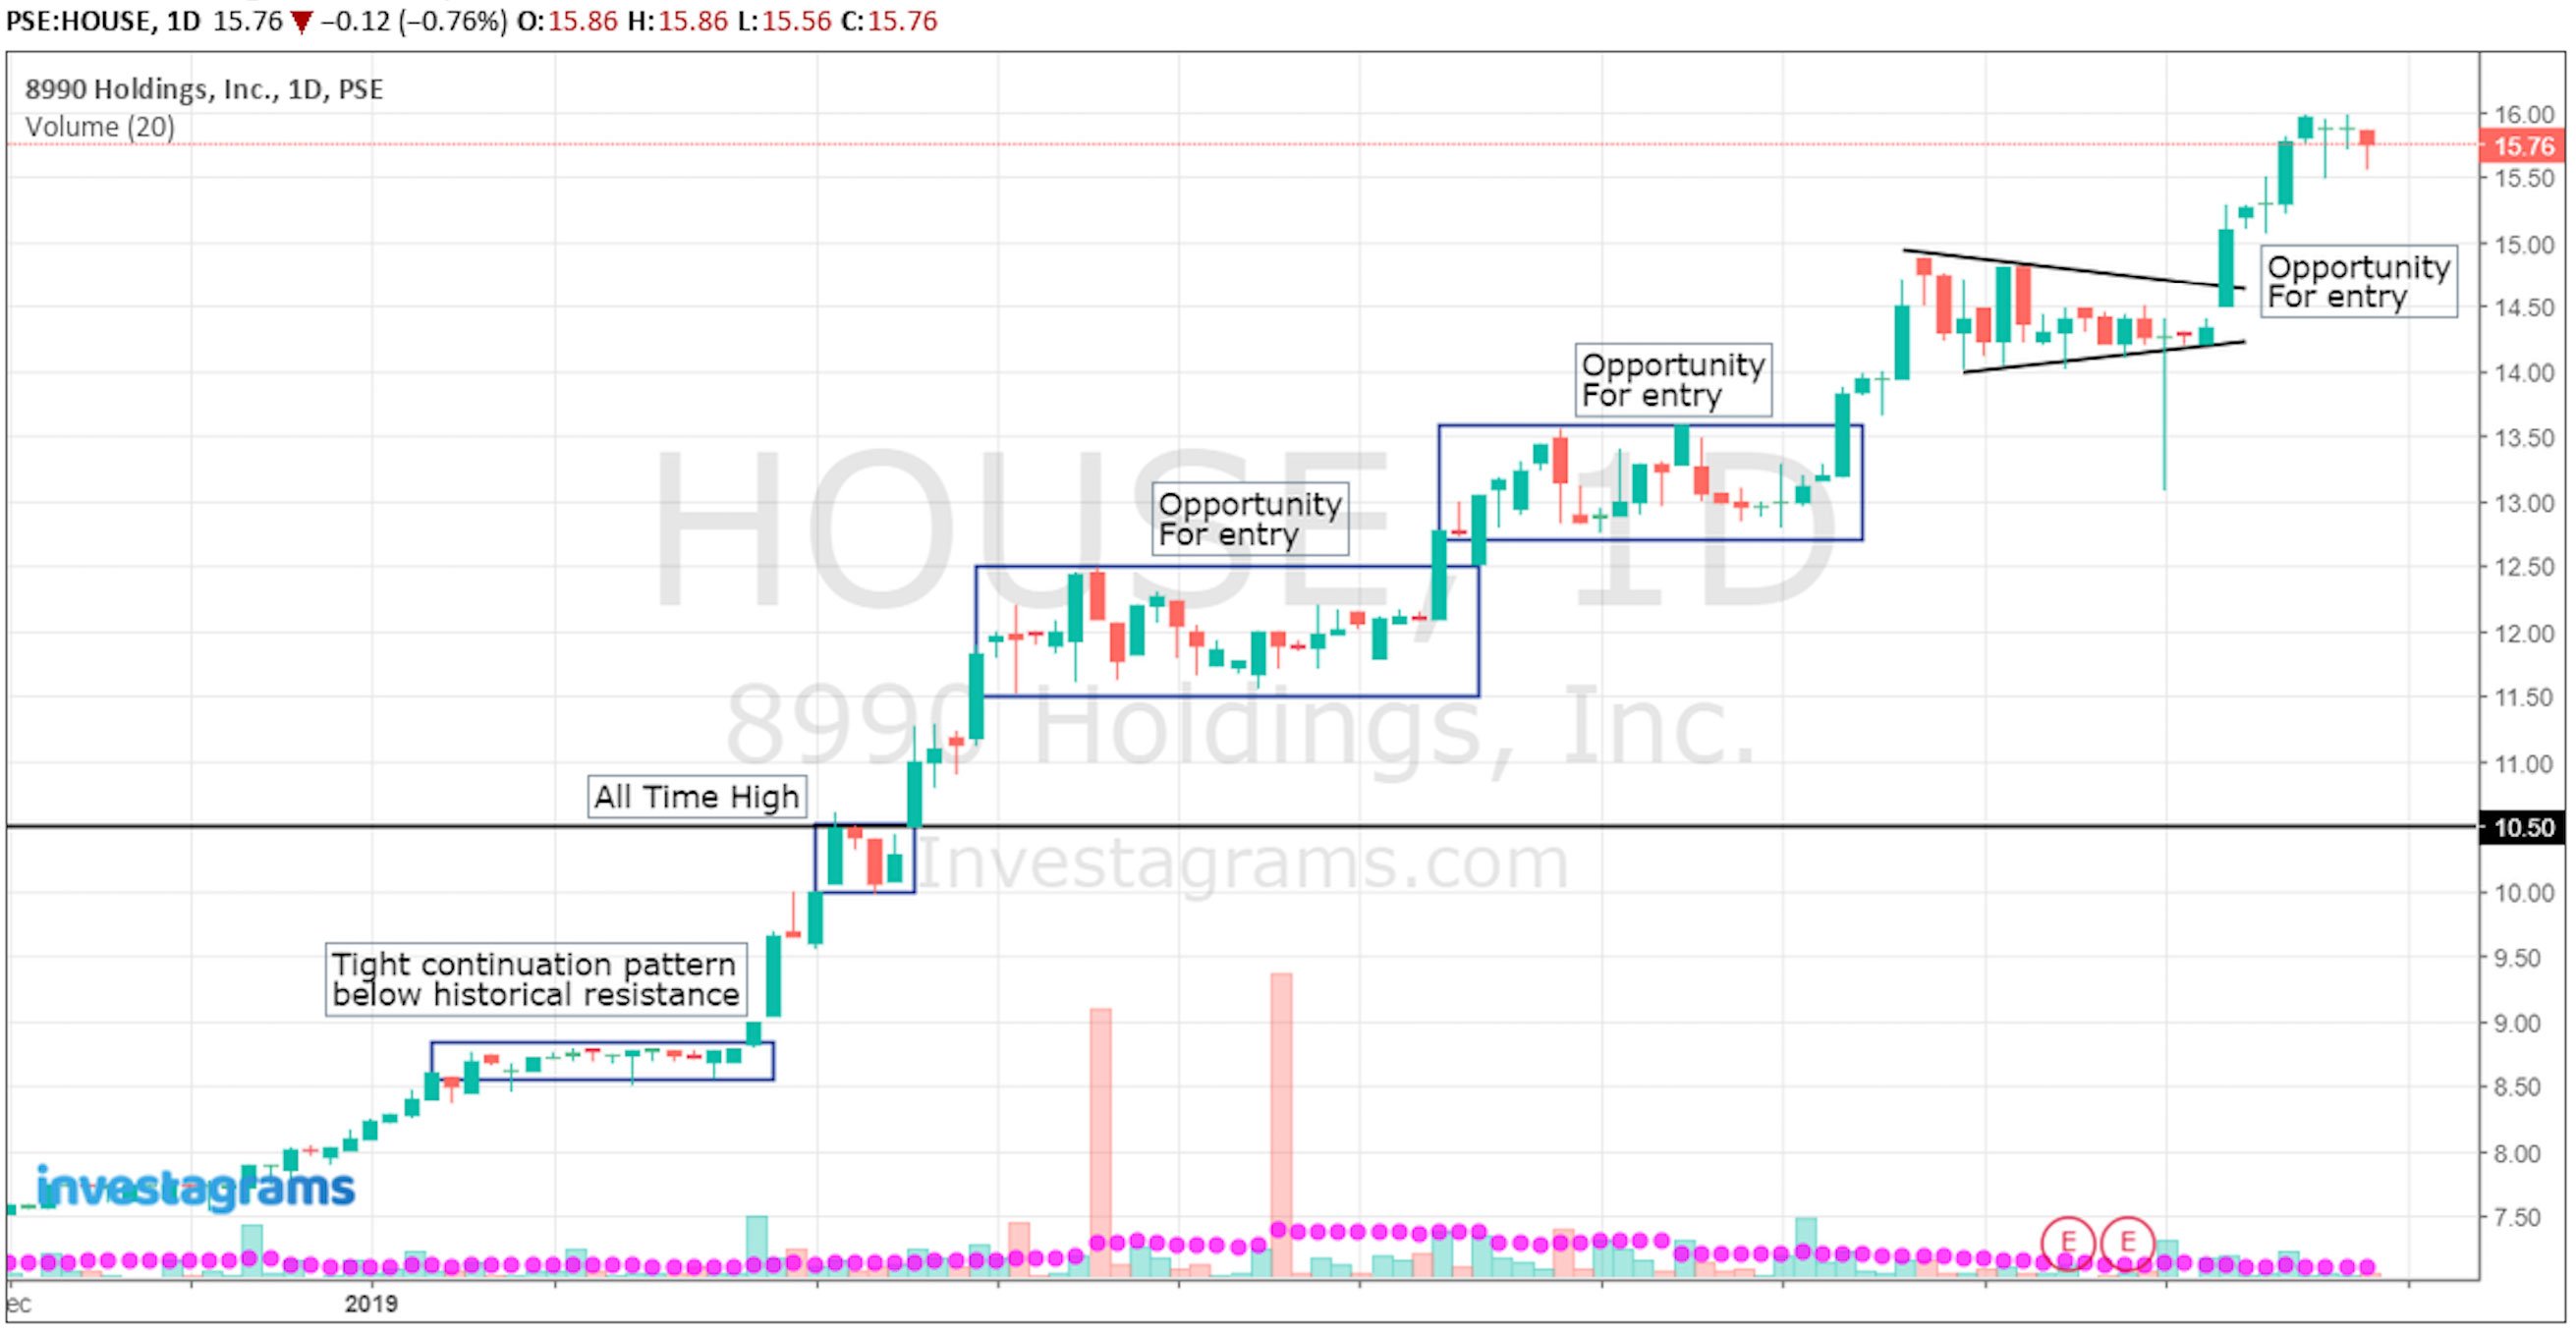
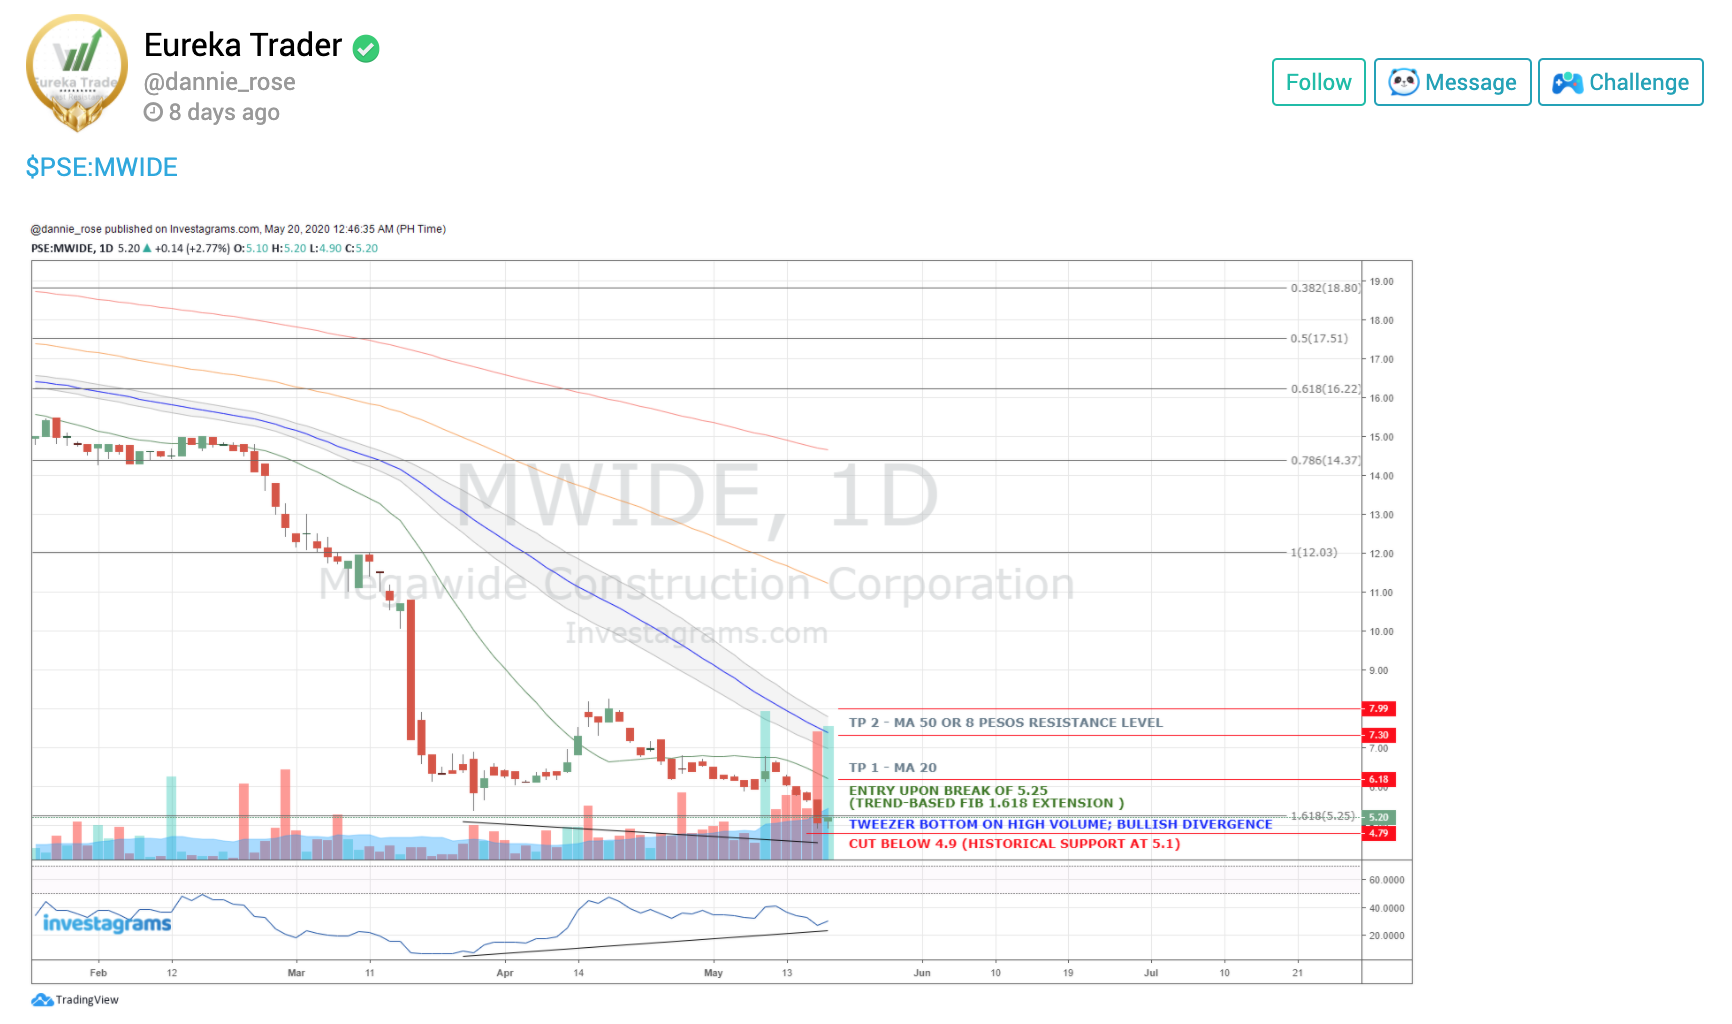
Ferdinand Roaquin is our technician of the week for spotting $AC (Ayala Corporation). One of the leading names in our market, $AC has been having a nice play in the past couple of weeks. As the market was drying up and uncertainty started to heighten, $AC was among the leaders in last Friday’s strong market run.

Let’s take a closer look at how Ferdinand saw this opportunity. You can view the original post here: https://www.investagrams.com/Post/bong_r/1050621

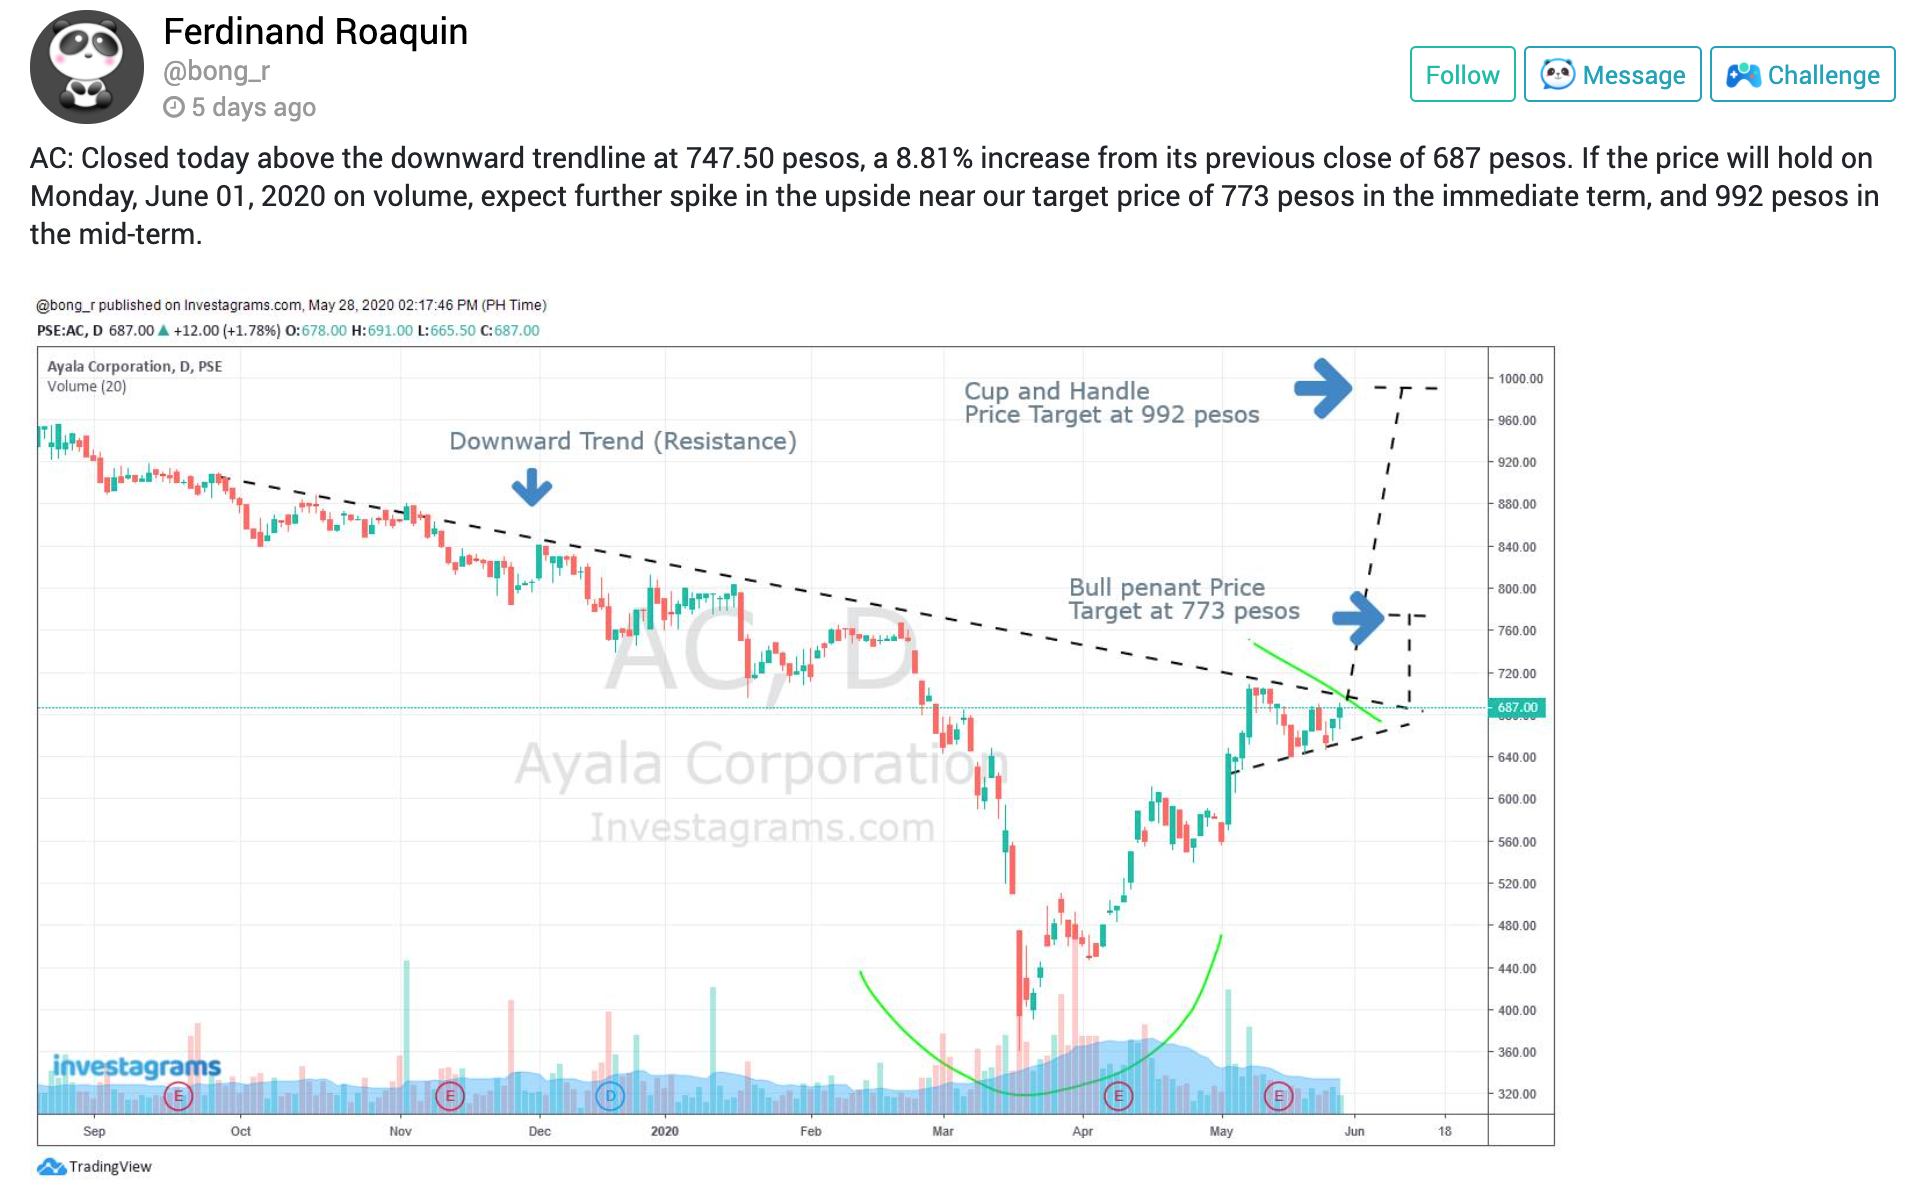
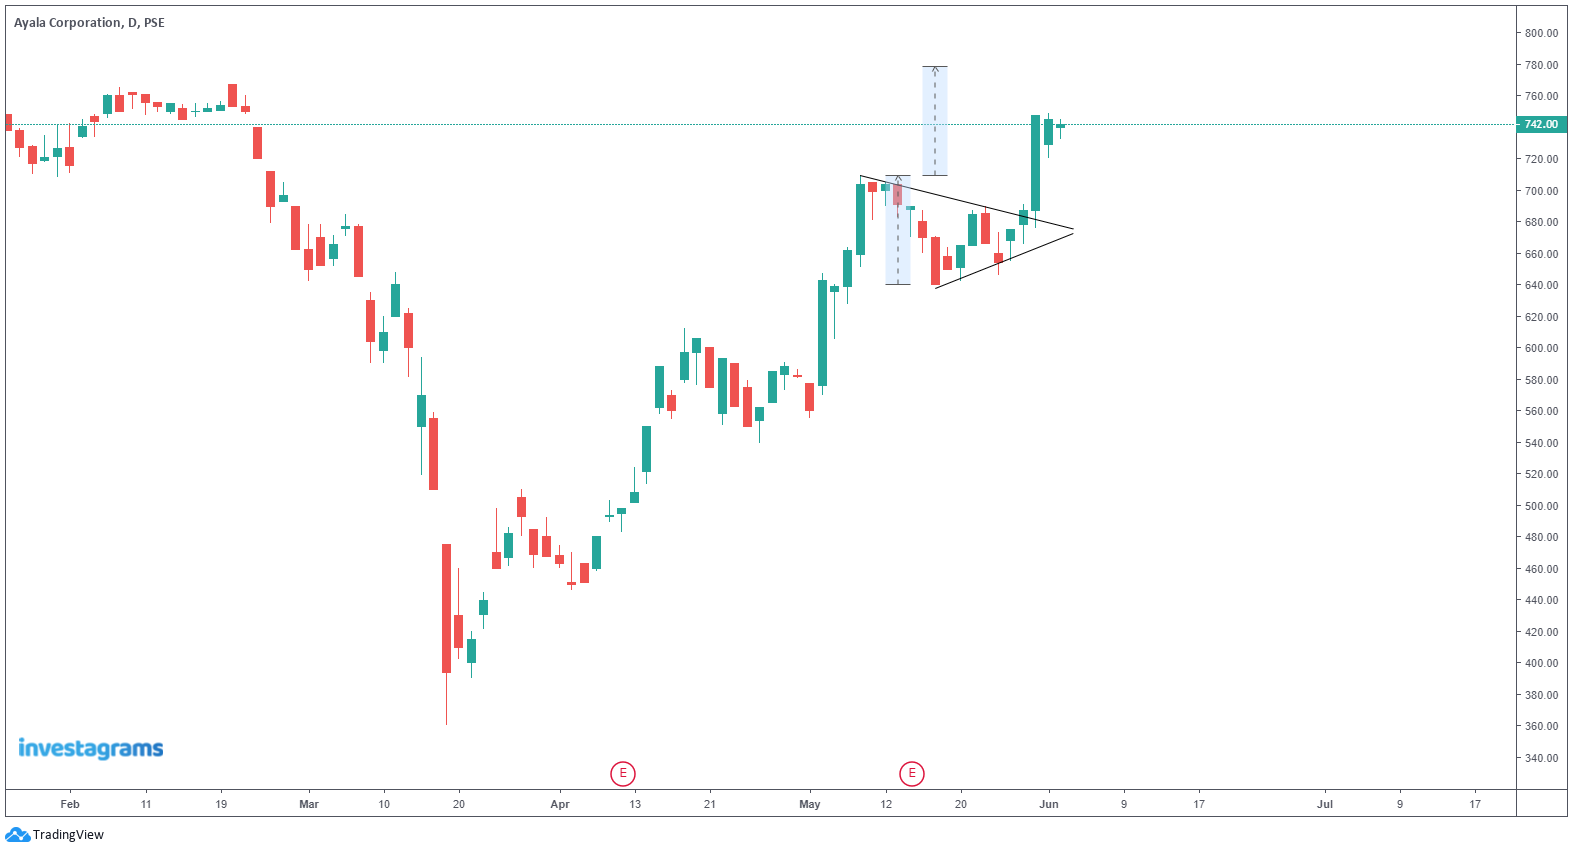
First of all, our technician had two theories: a cup and handle formation and a bullish pennant. The latter, used for short-term movement, is a continuation pattern of an existing uptrend. As one of the resilient issues in the market, $AC has had a pretty nice short-term uptrend heading into the bullish pennant.

Targets for continuation patterns are often set by taking the size of the highest and lowest point of the consolidation, then adding it to the high.

Ferdinand Roaquin also points out that price should hold on the following day from the first impulse candle. As a continuation pattern, it is important that momentum is kept healthy. If price were to drop and the broken resistance doesn’t act as support, it should be taken as a signal that the trend is about to reverse.

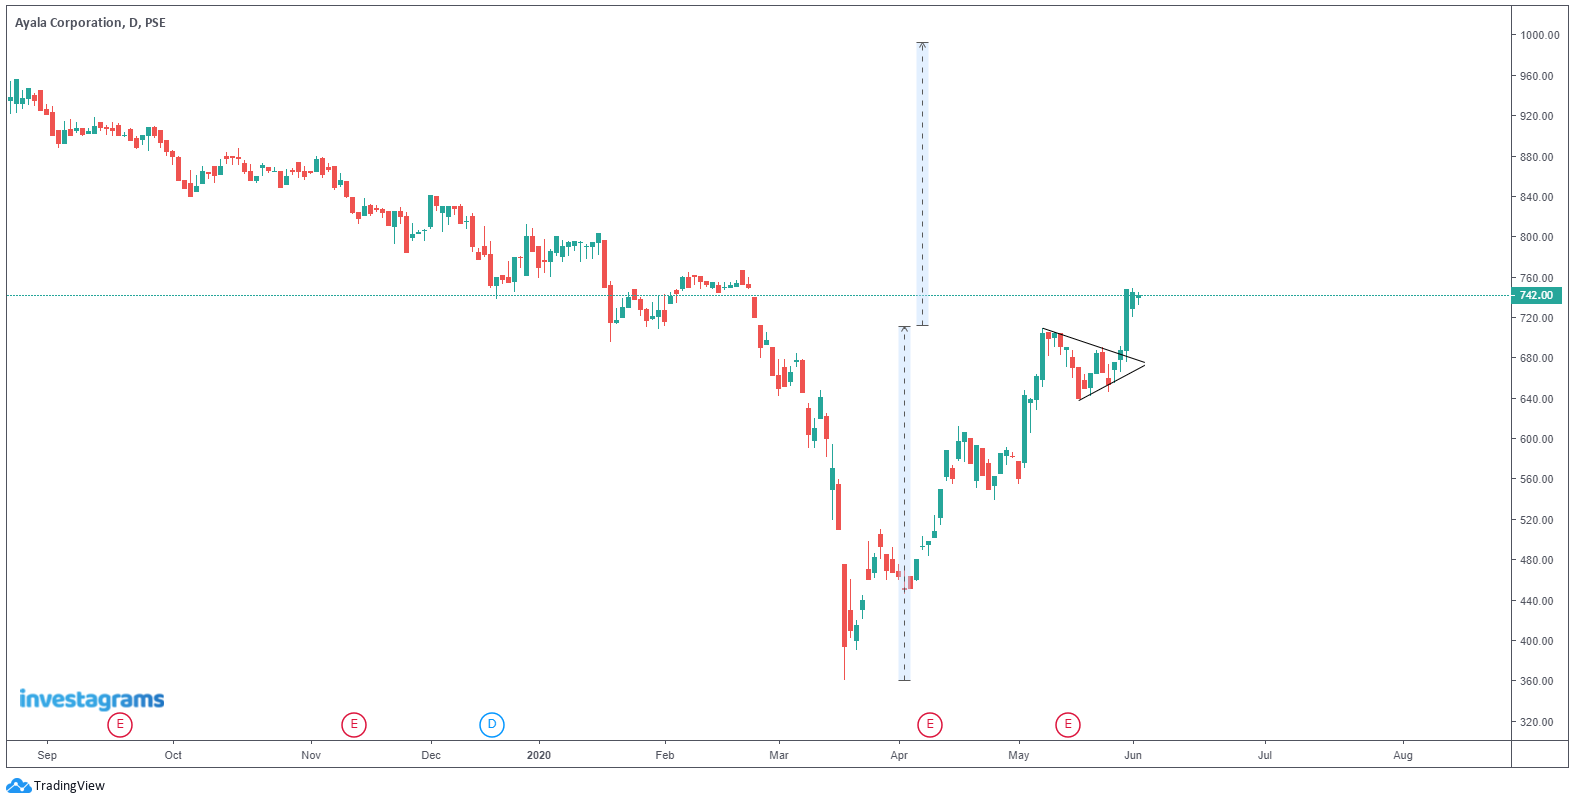
The second thesis is a cup and handle formation that was used to forecast a longer-term move. A pattern that can signal either the reversal or continuation of a trend, the cup and handle takes the form of a U-like shape with a smaller consolidation towards the end. The pattern target is taken by measuring the height from the lowest point to the resistance of the handle, then adding it on top of the pattern.

Although there are often varying perceptions when it comes to technical analysis, especially in the subsection of patterns, the most important thing to remember is to recognize how these tools fit in the bigger scheme of your system. For our featured technician for the week, he used these patterns to guide his analysis.

Team Player

Whether in a bull or bear market, trading will always be a rigorous endeavor; which is why team players are always welcomed in any trading community. These are invaluable people that spread positive vibes while adding value to his fellow traders.

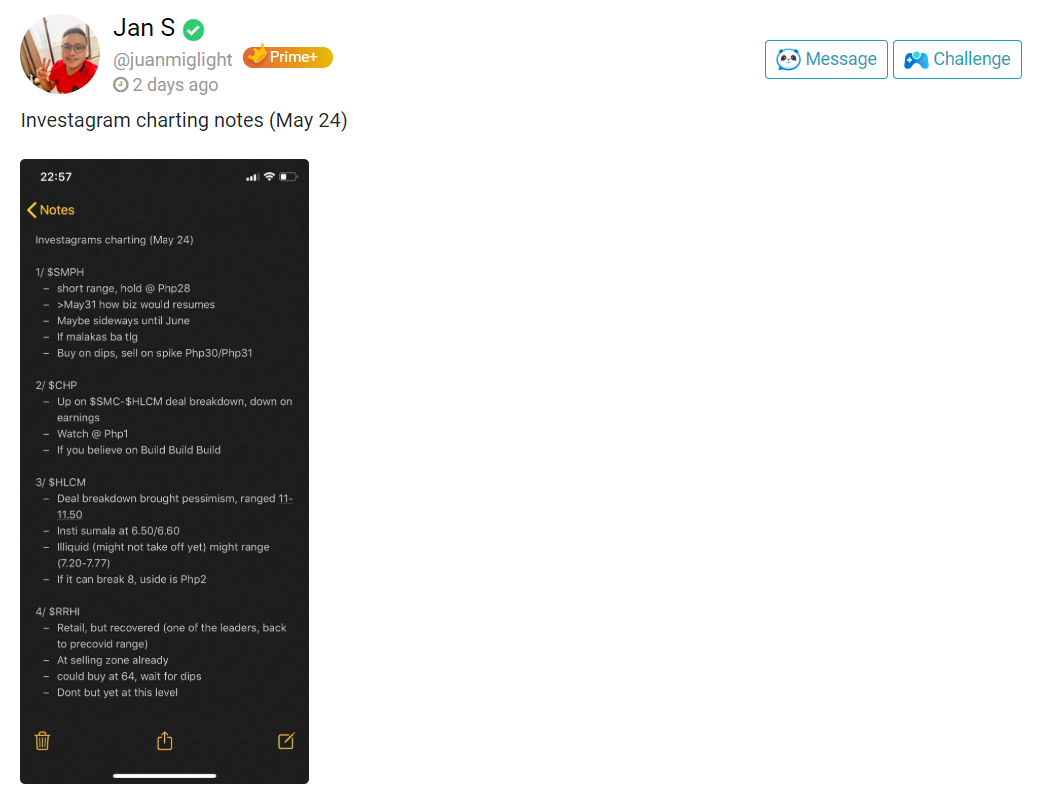
The team player of the week award goes to Poppy for consistently sharing informative content and putting extra effort in challenging her fellow traders to exert more effort in stock market learning, while also showing that she walks the talk.

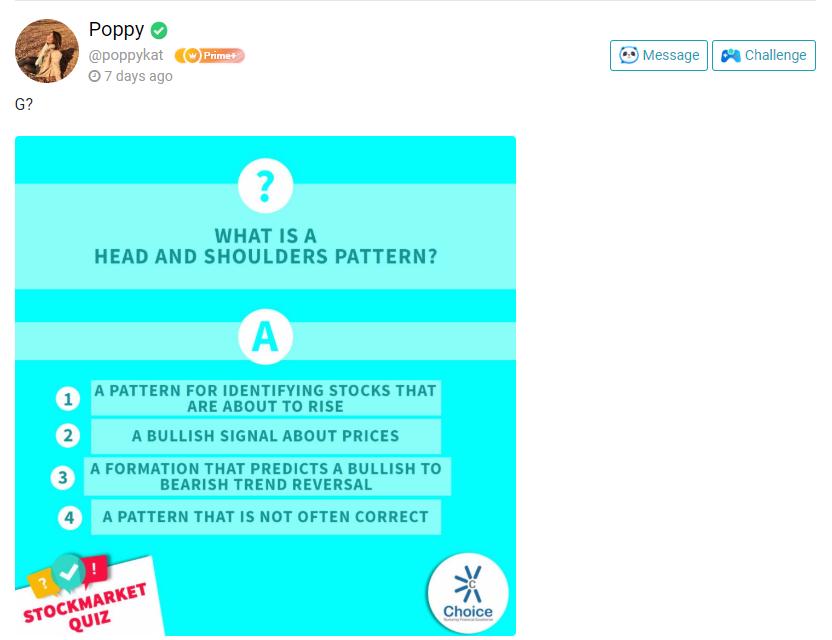
We’ve noticed that this team player has a habit of sharing helpful information. It’s this kind of posts that help promote a growth mindset in the community. Novices will surely appreciate the lessons that they can learn, while experts might find it refreshing. No matter what your skill level is, it is always important to hone one’s efficacy in the basics of trading.

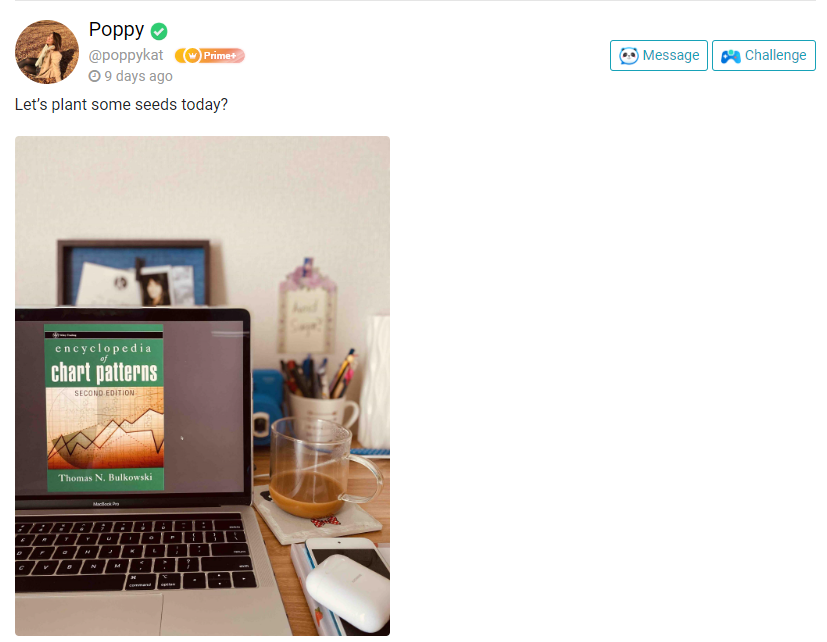
More than just sharing information, Poppy shows that she herself is a continuous learner. As a trader, there should never be a moment where you think that you already know it all. Being a successful trader comes with the mindset that there is always something new to learn.

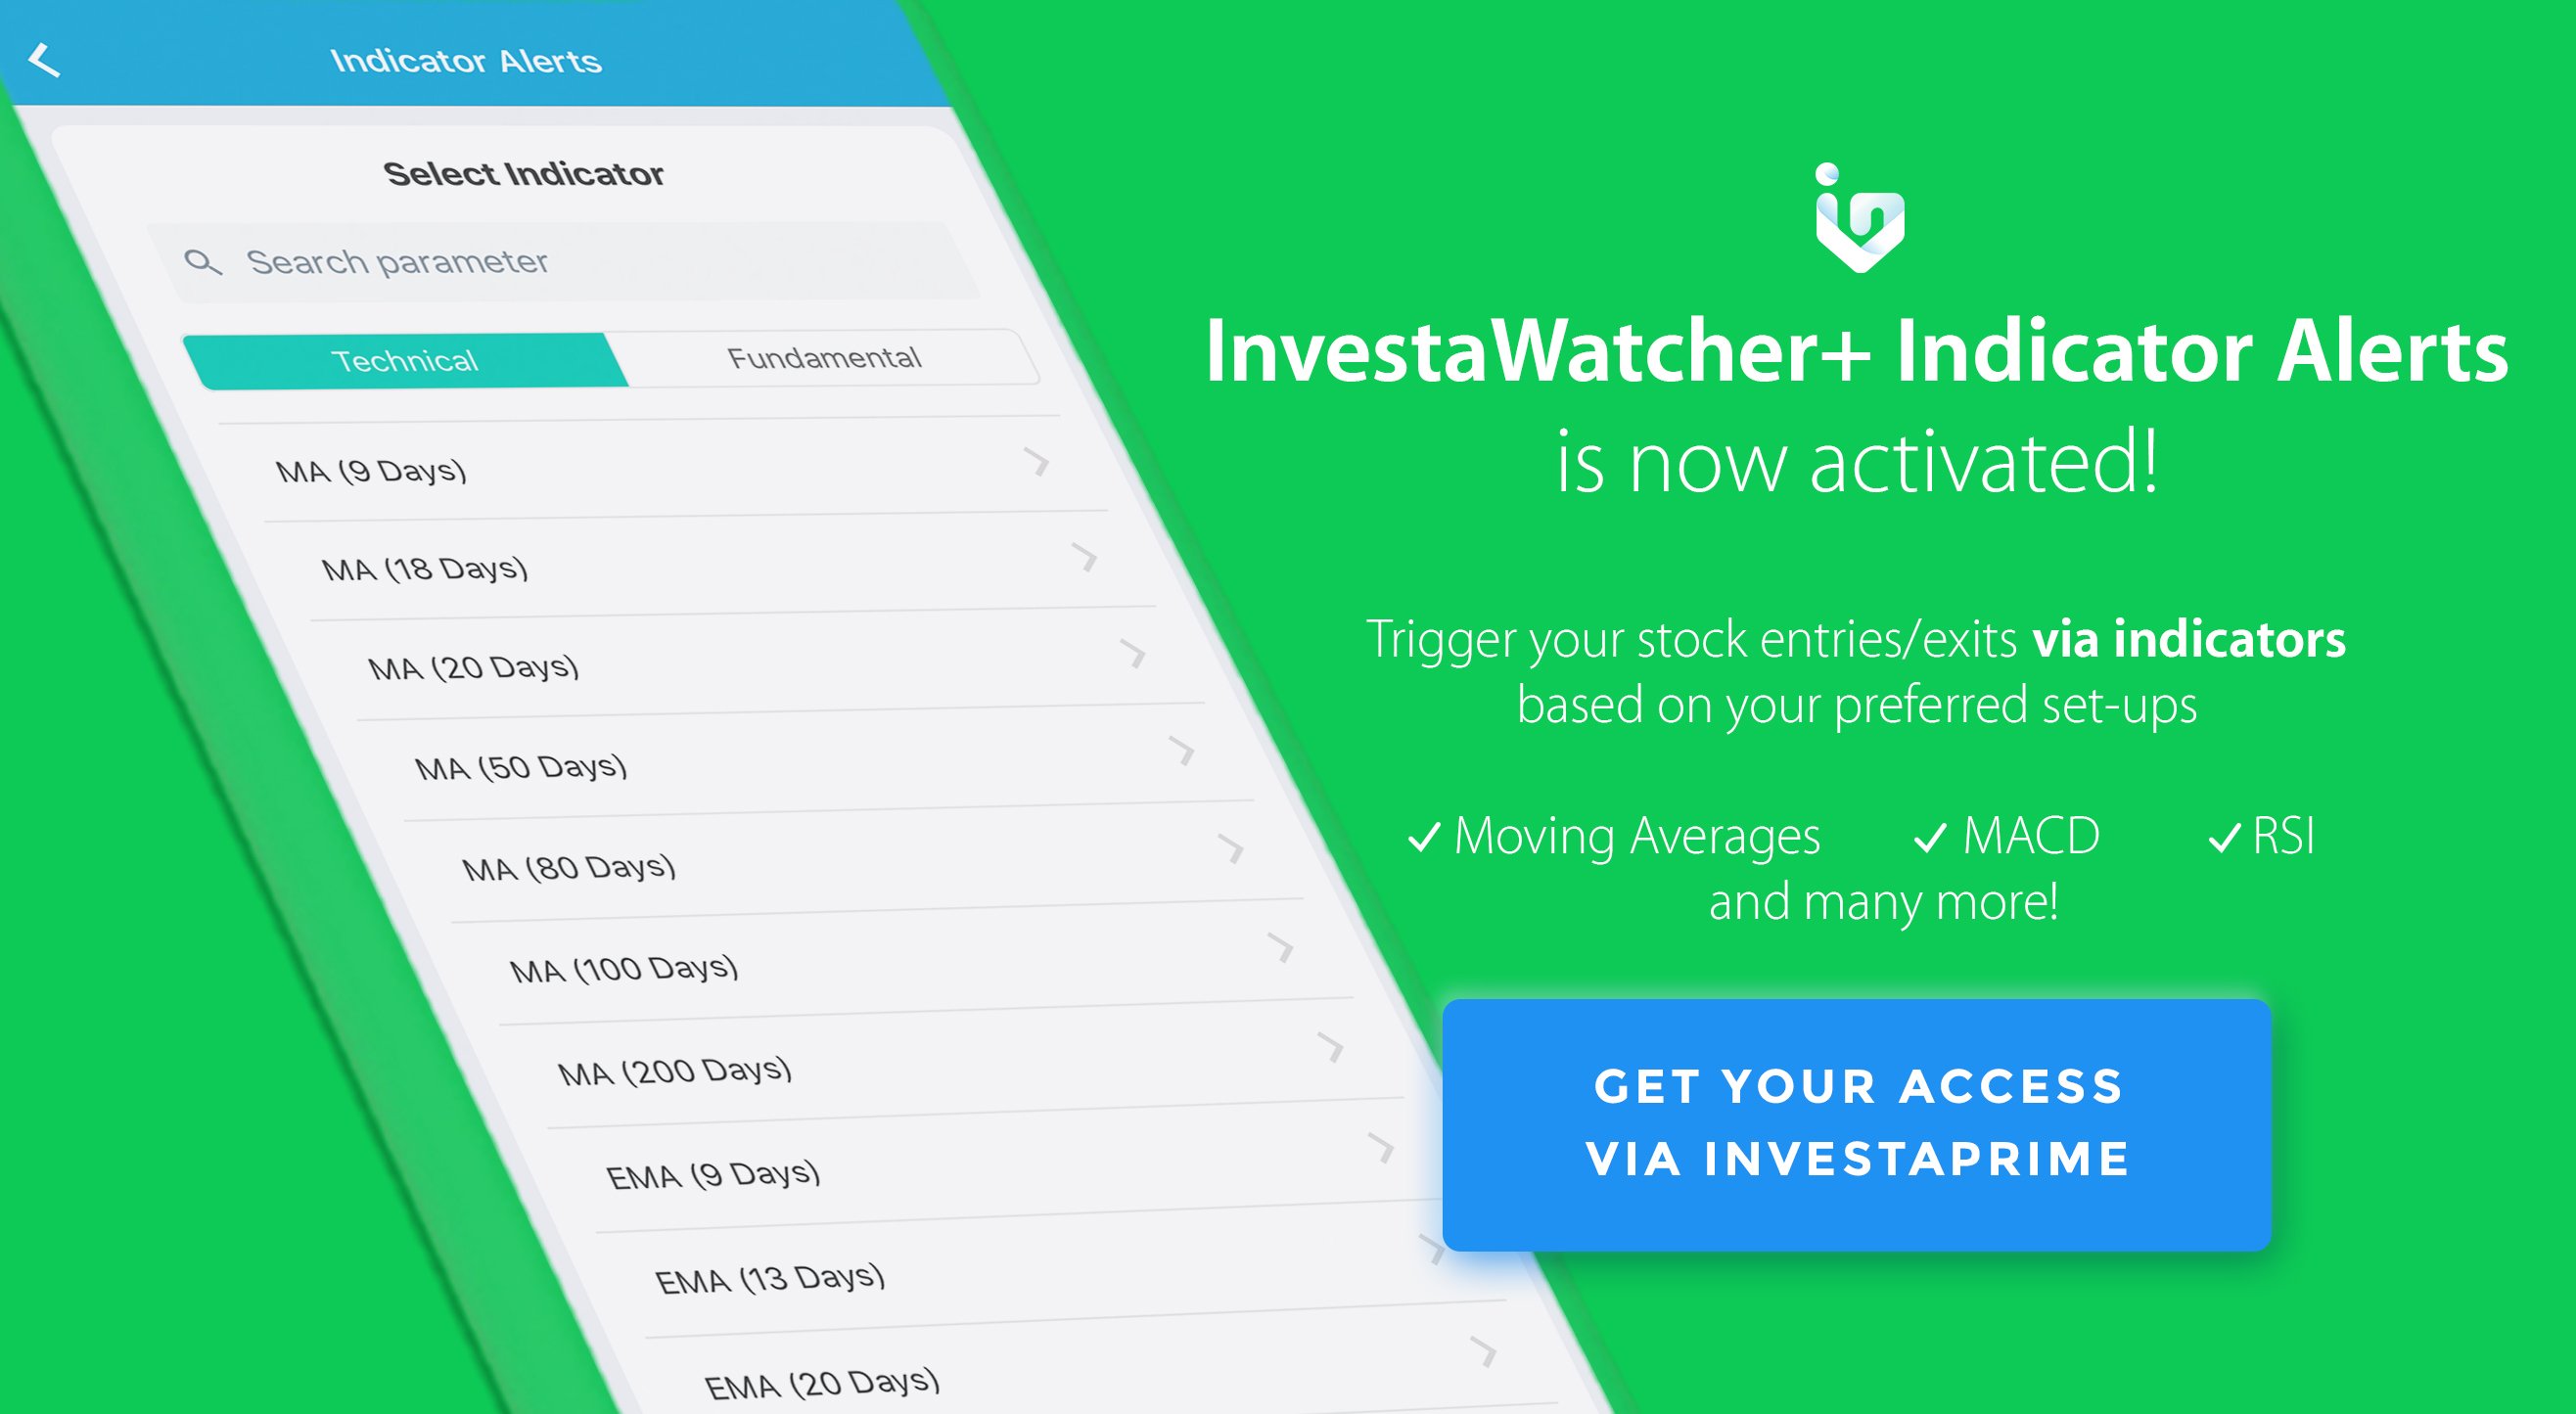
To appreciate our Featured traders of the week, we will be giving them FREE one-month InvestaPRO access. Keep up the good work, and let’s all do our part in growing our community!

Categories
Featured How to & Advice

Trade Secrets from the Best: Philosophies and Strategies of Three Successful Traders Throughout History

The stock market: an entity that began in 16th century Netherlands as industrialization began to take hold.

Over time, the concept of jointly owning a company spread outside of the Netherlands, to every part of the developed world. As the concept grew in complexity, a need arose to differentiate oneself; and over the years, many individuals have stood out with their trading strategies that garnered them millions — even billions — in profit. Below are three standout traders from as early as the 1800s up until the modern-day, and the trading strategies that helped them earn big.

Jesse Livermore (1877 – 1940)

Perhaps one of the most famous names in the trading world, Jesse earned huge amounts of money through trading. He successfully shorted the 1929 market crash, earning him millions. However, throughout his life, he would gain big, lose it all, then gain again — in an endless cycle that eventually caused him to take his own life. However, he had a remarkable run, and Reminiscences of a Stock Operator (1923) — an unofficial biography of his life — is considered a must-read for traders. Jesse was considered a trend trader: he would analyze trends in the stock market and trade depending on whether it was on an upward or downward trend. Rather than basing it all on intuition, he would analyze the market and data before making a trade. Though this seems like common sense today, during his time, trading was based on rumors and speculation — his style of trading was entirely new. He also practiced Top Down Trading: he determined the wide-range market condition, then looked into industry groups following the general direction of the market, and sought out the strongest stock in that industry to invest in. Additionally, he identified a “sister stock” that he would follow along with the stock he invested in, as he believed that the condition of the sister stock would also reflect in the stock he invested in. As he once said, “There is nothing new on Wall Street. There can’t be, because speculation is as old as the hills. Whatever happens in the stock market today has happened before and will happen again.” Thus, patience, top-down trading, and a careful analysis of the market are important aspects of his immensely successful day-to-day trading.

George Soros (1930 – Present)

Chairman and founder of Soros Fund Management, he earned the title “The Man Who Broke the Bank of England” after he made over $1B on a bet that the British pound would depreciate in value. His ability to pull this off is a great example of his speculator trading strategy, wherein he makes huge bets on the direction of financial markets — essentially making a bet that the value of his stock will either rise or fall. When he predicted that the value of the British pound would crash, he borrowed billions worth in pounds and converted them to German marks. Thus, when the pound crashed, he was able to profit off the difference when he paid back the lenders. To engage in such trading, Soros looks at the economic, political, and social factors that affect industries in the future. He looks at trades from a long-term perspective — what will happen, and the events that are happening, that will shape prices in the far future. An example of this was when he invested in Japanese markets after the 2011 Fukushima disaster. Many investors exited Japan, as they did not think Japan would recover from the disaster. However, Soros saw an opportunity in the distant future: Shinzo Abe taking over as Prime Minister. A few months before Abe took office, Soros invested in Japan’s equity markets, and, just as he predicted, markets picked up rapidly after Abe took over. This shows Soros’s ability to look past the herd mentality of many traders, and analyze markets from a long-term perspective, ultimately allowing for long-term gains. However, a word of caution: as this strategy banks heavily on speculation and requires investing huge amounts of money, one should be able to afford a loss in order to implement it. It is an extremely high-risk high-reward style, requiring a good analysis of the trade and risk management plan beforehand.

John Paulson (1955 – Present)

John Paulson is the founder of Paulson & Co. and made his mark on Wall Street by successfully shorting the real estate market in 2007. At a time when many were losing money, he was one of the only ones to earn big. After his success, he made an impressive trade run from 2007 – 2010 by shorting housing, bank, and gold stocks, effectively increasing his already large fortune. His main trading strategy is position trading: he invests in stocks for the long-run, believing in trading with a high probability of getting returns in the long-run rather than short-term buying and selling. Along with his philosophy of investing for the long-run, Paulson also believes in having an exit strategy in case the stock surprisingly turns south for a longer period of time. He stresses that one should not “fall in love with a company” because by becoming attached to that stock, it becomes harder to identify when it is depreciating for good. Additionally, Paulson uses a contrarian strategy, buying and selling contrary to the popular belief at that time. He believes in going against the current market trends to generate profits, as trends cause frenzies and bubbles that will eventually crash. He looks for share prices that are lower than the value he sees in a company, because if the value is intrinsically higher then the price will eventually go up, allowing him to generate profits in the long-term. Paulson’s strategy, in essence, is all about patience and waiting out on his stocks; because as he once said, “Our goal is not to outperform all the time — that’s not possible. We want to outperform over time.”

Conclusion

As seen from the three traders above, there are many trading strategies that have worked overtime. However, as John Paulson said, “No one strategy is correct all the time.” Every trading strategy has its downfalls, and periods when they just do not align with market conditions. All three of the abovementioned have experienced losses due to their philosophies — George Soros lost a huge amount of money when he bet wrongly on the US markets rising in 1987, and again during the 1999 tech bubble. In conclusion, as much as one can learn from the trading strategies utilized by the best, perhaps the biggest takeaway from their careers and experiences — both good and bad — implementing the strategies, is that one should never expect to win big and experience success at all times. Expect losses, plan for them, and come back with an even better strategy to conquer the complicated, and at times frustrating, the world of stocks.

Categories
Featured News & Features

How Oil Affects The Economy, The Stock Market, and Other Commodities

Oil is one of the leading drivers of consumption and a leading indicator of economic growth. Historically, when its price reached a peak of USD 147.7 per share in July 2008, it was at the summit of the stock market index. At the height of economic might, it signaled bullish market highs only to be subdued by the US financial market collapse led by the housing bubble and the stock market burst. At that time, greed and demand were at an all-time high because of the spiraling prices caused by the financial meltdown. After more than a decade of economic and stock market cycles later, at the peak of consumption and economic boom, it happened again in the year of the metal rat, 2020.

The Year of The Metal Rat is considered unlucky in Chinese culture, and surprisingly, it all started there. China is a country that has been experiencing continuous and uncomparable economic growth which has never occurred since the industrial age. But this all changed when scientists traced the origin of a new strain of coronavirus, a highly-contagious disease, COVID-19 in Wuhan, one of its major cities. The residents of Wuhan were getting sick at an exponential rate, so the city implemented a total border lockdown. But to spread it to neighboring and even farther countries in this day, and age, where land, sea, and air travel has become very much accessible was already unavoidable. The virus caused borders across the globe to shut down and economies as well. This followed the stock market to crash once again and trigger numerous circuit breakers. Eventually leading the consumption of oil, one of the major commodities, to grind to a halt.

The pandemic caused the price of oil to plunge at an all-time low due to oversupply. And instead of stalling production caused by this unforeseen circumstance, Saudi Arabia, Russia, and their partners in the Organization of Petroleum Exporting Countries (OPEC) came up with other plans in order to have a price and production rift. They decided on who should back down in their quest to trump their rivals, the shale producers, the United States, and Canada. This followed the commodities and equities market to tailspin.

There are benefits in tracking and studying the price movement of certain commodities especially oil. This particular commodity has been the cause of a number of major alliances, economic and political treaties that are used as leverage, and even wars. That’s why besides index and currency, the price of oil is one of the indicators that traders should watch. Its price should be treated as an investment guide and a trading indicator on when to deploy or withdraw extra capital. If the price of oil rallies, the stock market usually follows not too far or just precedes its price. Hence, commodity traders right now should take advantage of both the low price and volatility of oil.

Although unfortunate, the stock market crashing once again is still within the realm of possibility. Therefore traders should be able to capitalize, prepare for unpredictable damages, and become conscientious enough to share on how to deal with black swan events, including this one. If you are already a trader right now, you are already a part of history!


Contributor:

Name: Carlomagno Raymundo Mendez
Investagrams Username: @magnum

About the contributor:

Magnum is a businessman from Manila who has been stock trading since 2013. He is currently an executive in his family’s security and personnel business and at the same time runs his own company in the telecommunications field.


Categories
Featured How to & Advice

The Line of Least Resistance

If you’ve read “Reminiscences of a Stock Operator”, which focuses on the life of Jesse Livermore, you’ll know that he emphatically states that one should focus on stocks that are near The Line of Least Resistance. A stock that is at this area is hovering near its 52-week high or all-time high levels, meaning that only a little demand can send a stock flying. By committing your hard-earned capital on these types of plays, you can expect a high probability of making the most amount of money in the least amount of time.

You may be asking yourself, “How is this possible? How can you make the most amount of money in the least amount of time?” By focusing on stocks near their 52-week or all-time high levels, you take off you watchlist all the laggard stocks and begin focusing on only the leading stocks in the market. This is especially effective during bull markets as stocks that create new highs tend to never pullback, so it’s best to get in when a new high is made.

So how does one find The Line of Least Resistance? One way to find it is too check longer-term timeframes, like a weekly or monthly chart, to plot the significant resistances that, if broken, can lead to an explosive move. Once you’ve plotted these points, you can go back to the daily chart (or whatever timeframe you prefer) and create your trading plan.

Here are some examples:

$ATN (ATN Holdings, Inc. ‘A’) was one of the alpha plays during 2018’s deep market correction. Despite the PSEi continuing to make lower lows and break all sorts of support, $ATN was simply hovering at the highs. Taking a look at its monthly chart, .75 is an area where $ATN had a difficult time breaking while its all-time high price is at .90. This means if $ATN can break and successfully close above .75, there’s a high probability for an explosive breakout.

By identifying the significant area the stock needs to break, you can now create a trading plan on your desired timeframe. On the daily chart, we can see that $ATN created a six-month base from February to late July and tried to break its historical resistance five times before successfully doing so on the sixth attempt. After breaking out, $ATN gave those who missed out an opportunity to buy on the retest. After this, the stock skyrocketed to new highs and made a 126% move in only eight days!

$HOUSE (8990 Holdings, Inc.) is one of the outliers in last year’s market, especially considering the bearish sentiment since the first quarter of 2018. Looking at its weekly chart, we can see that at the beginning of 2019, $HOUSE was right below its significant resistance at 9 pesos. While its all-time high price is at 10.50. After plotting these points, you can now create your trading plan on your preferred timeframe.

By looking at the daily chart, we can see that $HOUSE made a tight continuation pattern just below its historical resistance at 9 pesos. After breaking out of this pattern successfully, $HOUSE went through the roof and never looked back locking in an 80% gain for those who were able to purchase during the first breakout. The stock also gave several buying opportunities during the 80% move.

In conclusion

Just by knowing the importance of identifying The Line of Least Resistance can do wonders for your trading, especially if you focus on stocks hovering below their respective highs. By zeroing in on the market leaders, you effectively take out all the laggards that continue to drop while taking positions on stocks that remain in strong uptrends. The ability to identify and execute on The Line of Least Resistance will be a significant weapon in your trading arsenal, use it to your advantage!

Categories
Featured How to & Advice

The Most Overlooked Indicator

For anyone engaged in the activity of trading or investing, there is going to be very little to no argument on the premise that PRICE is the most important piece of information.

While most technical indicators are mere interpretations on aspects reflected by PRICE, there is one that newbies and amateurs most often overlook, if not taken for granted. But let’s digress for a while and come back to that a little later.

If you are a movie buff like I am you would remember that 2013 film with Brad Pitt entitled World War Z.

One of the most memorable scenes there was what they called “The Wall”. For those who haven’t seen it, this was set against the backdrop of a fictional pandemic, where Pitt’s character as an expert for the UN, flew to Tel Aviv in search for a solution to the ongoing zombie apocalypse.

In that particular scene, people inside the wall were chanting and singing as part of a religious ritual. And as their voices grew louder, it was unknown to them that the zombies had become agitated and grew to become more aggressive in their resolve to scale to the top of the wall.

Long story short, while some zombies fell off the ant-like mound they mindlessly created, many have found their way over and the city was eventually overwhelmed by the sheer VOLUME of the undead creatures.

And with these images now embedded into your consciousness, let’s get back to the subject at hand and dissect the process as to how PRICE action actually evolves from a seemingly quiet and calm to the point of what Warren Buffet called, IRRATIONAL EXUBERANCE.

In a simplified perspective, this is how it usually goes:

1. From a base level or range, the price of a stock hardly moves. Whatever incremental motion it creates is largely ignored by the general public. (Only a few zombies drifting around a small area.)

2. This goes on over a period of time and buying or ACCUMULATION by certain entities goes unnoticed. (They scrounge for whatever food they see nearby.)

3. At a certain point, some if not several pieces of information (rumor, news, or both) about the stock will start to go around and it begins to create a stir or commotion to the investing community. (Others from a more distant area, begin to spot fellow zombies appear happy and content in the place they currently occupy.)

4. The “noise” is amplified as even whispers add up to start a buzz on the prospects of the stock. (More zombies consolidate and create loud noises while becoming more aggressive.)

5. More people notice and it starts a buying frenzy on the hopes that the value will begin to rise and make for a good trade or investment. Volume significantly rises. (They realize that they have to move quickly and expend more effort and energy.)

6. Stock price begins to move higher, breaking resistances previously identified. The latecomers are struck with FOMO or the fear of missing out. Early buyers also become more confident as the trade moves in their favor as they add more to their positions. (The ant-hill effect takes shape in a race to buy high, sell higher.)

7. Holders who bought from a low base price, now begin to lock in profits and sell their positions to very late buyers, who carry the hopes that prices will still go higher. (Some zombies find the top of their walls and reap the rewards, while others become more mindlessly motivated by greed and obsessed to obtain the success attained by others.)

As some of you who may know me from my FB posts, I am a self-proclaimed advocate of technical analysis specifically in the study of Elliott Wave Principles.

And from my perspective, the above stages from no. 5 to 7 goes on for three (3) distinct cycles or waves, with a corrective phase in between each one. But let’s not get into that for now.

As you may have realized in the imagery presented on the processes involved in the above-described part of the market cycle, the aspect of VOLUME is almost always ignored and undermined. People are understandably distracted and more focused on price action.

But in each of the stages where a stock price moves up, volume plays a big role.

In a nutshell, the amount of people coming inside a trend at particular price points or levels eventually PROVIDE support and become a step to the ladder. And at certain points during corrections where a change of hands obviously happens, the greater the volume accumulated becomes a new base for the ascent to a higher range.

All until such time that volume starts to become DIVERGENT. Again, a topic we can dive into in a future issue of InvestaDaily.

In the meantime, let these be your key takeaways on the subject of VOLUME:

  • Volume is an indicator of market strength.
  • Rising prices on increasing volume is an indication of a strong price move.
  • When prices reach new highs on decreasing volume (volume divergence), a correction or a reversal could be
  • imminent.
  • And when prices reverse or fall on increasing volume, the trend is likely gathering momentum towards the downside.

I hope after this, you find a renewed perspective on the importance of volume. And being in a country with a renewed interest in Latin phrases, I like to leave you with this:

volumen prius pretium (volume precedes price)

And also as my maiden contribution to your quest for greater charting skills, I share one of my favorite INDICATORS that is simple and visually aesthetic.

Shown here as a chart overlay is what is known as VAP or Volume at Price.

And if you can go back to “The Wall” analogy, you might find it insightful as to the aspects of SUPPORTS and RESISTANCES. I am sure you can easily spot here how price action behaves in relation to the volume congestion zones. Enjoy.


Contributor:

Name: Jojo Gaston
Investagrams Username: @JojoGaston0

About the Contributor:

Jojo Gaston is a partner/mentor at BoH Society, an online trading support group that provides traders’ education, and data-driven trading format for local stocks, forex, and other foreign markets.


Categories
Featured How to & Advice

How To Trade With Confidence: Trading and Investing Lessons Via The Last Dance

“I’ve missed more than 9000 shots in my career. I’ve lost almost 300 games. 26 times, I’ve been trusted to take the game-winning shot and missed. I’ve failed over and over and over again in my life. And that is why I succeed.” – Michael Jordan

Photo Credit: clutchpoints.com

Lesson #1: Scared Money Never Wins. Scared Players Never Make The Shot.

Fear of Losing Money Holds You Back. Michael Jordan missed more than 9000 shots in his career and lost almost 300 games. He missed 26 game winning shots but that never stopped him from persisting and coming back up.

Whatever happens in the game has happened in the practices. It is not new. It is ROUTINE. You don’t win a championship with one shot. Neither do you win championships in a single game. So it does with trading and investing. Making one shot is just making a good trade. Consistently making good shots and sharpening yourself to be a better field goal trader and shooter is what makes your team and yourself a champion.

In the 1997 NBA Finals, Steve Kerr was ready to take the shot. He was ready. Watch the documentary. Michael Jordan and Steve Kerr knew that if they were going to double team MJ that Steve would be open and he had to be ready to win the championship. Without him, the Chicago Bulls would not have won the 1997 NBA Finals. Steve Kerr wasn’t initially the great player that he became. He grew to become one of the best shooters in the NBA on all-time stats. Take a look at all the field goals of the most iconic players that ever played the game of basketball. People know Michael Jordan but he had an outstanding supporting cast who became greater because he helped push them to expand and grow to their potential.

Wikipedia Stats of Steve Kerr:

Stephen Douglas Kerr (born September 27, 1965) is an American professional basketball coach and former player who is the head coach of the Golden State Warriors of the National Basketball Association (NBA).[1] He is an eight-time NBA champion, having won five titles as a player (three with the Chicago Bulls and two with the San Antonio Spurs) as well as three with the Warriors as a head coach. Kerr has the highest career three-point percentage (45.4%) in NBA history for any player with at least 250 three-pointers made. He also held the NBA record for highest three-point percentage in a season at 52.4% until the record was broken by Kyle Korver in 2010.

From a 3 point field goal percentage, you have to appreciate that Steve Kerr had more consistency than Jordan and Kobe and higher than Stephen Curry.

Lesson 2: Who’s in your Starting Five Lineup?

Jerry Krause, is painted as a villain at times in the docuseries but you cannot argue he assembled the best team ever. Was he the greatest manager of his time? Yes. He got the greatest player in the game, Michael Jordan from North Carolina. He got the greatest coach in the game Phil Jackson before the world knew. He got hall of famers and arguably the top 2 player of the game Scottie Pippen. He got Dennis Rodman, another hall of famer Top 50 best players in the league and best defender. He had Luc Longley, Toni Kukoc, Steve Kerr, and Bill Wennington.

The Chicago Bulls he assembled in the 1990s came from nowhere to being the greatest dynasties in the NBA, winning six NBA Championships from 1991-1998 with two three-peats. The Bulls was the only NBA franchise to win multiple championships while never losing an NBA Finals series in their history. In fact, during the 1995-96 NBA season, Bulls won 72 games in a single season setting records only to be broken after the Golden State Warriors 20 years later during the 2015-2016 NBA season broke it thru 73 games.

Do you realize the greatness of that team? Do you realize how many all-time highs and multiple potential baggers and cash flows? Would you have wanted to be the Jerry Krause who created this Starting Five Lineup? That’s enviable. Obviously, you need multiple guys who do a great job and, once you have it, you don’t rebuild the team and destroy a franchise that has won you several championships. How many great companies went from 1 to 100 or 1000 that you’ve sold too early?

I’ll name you my own examples. Tencent is very memorable to me because at the end of the day, this was a pick of mine ever since I laid my eyes studying on Tencent even during 2008. This was something I convinced even my boss at that time to purchase for a multi-decade bagger. WeChat is now 9 years old. January 21, 2011: Tencent Debuted Messaging App.

If interested, I wrote about these 10X opportunities in the last decade in this article I’ve written in my personal blog. At the end of the day. Tencent continues to make all-time highs and has gone a long way from a gaming company to the largest technology conglomerate in China but also arguably the world’s most valuable companies. For more info, read this article: More than 10X Opportunities In the Last Decade & 10X Trends in the Next Ten Years

Lesson # 3: Winners Win. The Key to Wealth Creation is Holding Winners.

I studied winners in the markets. I studied the “Michael Jordans” of the market and what I’ve learned is that age doesn’t derail their greatness. I followed their blueprints and following one winner helped me find more winners. Consider the fact that $AMZN went from 1 to 2500 in 23 years. Shopify went from 18 to 800 in 5 years. Neither of these ecommerce companies have stopped ratcheting all time highs and this is true for all of them whether $MELI, $OCDO, $SE, $PDD, $BABA, $JD, $ETSY. Their legacies have not been damaged and the worst thing a trader can do is to decide to trade their GOATs. Why do you want to rebuild your winning franchise if it’s performing so well? Why do you sell your strongest winners? I’ll show charts just to blow your mind and I hope you’ll join us explore greatness not just in players, companies and the names you want to own in this world.

Strive for Greatness.


Contributor:

Name: Nikki Yu
Investagrams Username: @facelesstrader

Channels:

Twitter: @facelesstrader
Spotify: Facelesstrader
Website: www.awesome10X.com
Facebook: www.facebook.com/FacelesstraderPH
Medium: medium.com/@nikkiyu
Youtube: Awesome10X

About the Contributor:

Nikki Yu holds a Chartered Market Technician (CMT) designation, is Philippine Chapter Chair and has been working in the financial industry for over a decade. Prior jobs include equity research assistant, private bank marketing assistant, equity trader and broker. She is currently a financial advisor to clients in Wealth Securities Inc. and lives in Manila Philippines. She enjoys teaching about the markets and holds workshops teaching individuals how to create their long term nest eggs. Her medium profile www.medium.com/@nikkiyu. Her Spotify channel is Faceless Trader. Twitter is @facelesstrader. She teaches people how to globally invest in 10X trends via www.awesome10X.com. Subscribe to her free daily and weekly videos through Youtube: Awesome10X.


Categories
Featured News & Features

Investagrams Featured Traders of the Week: Eureka Trader and Jan S

The market has recently seen a decline in opportunities, but the grind still goes on. For this week, we would like to congratulate our two featured traders of the week: Eureka Trader (@dannie_rose) and Jan S (@juanmiglight).

The Technician

This week’s technician who gave a clear and sound analysis that is actionable is Eureka Trader. He wins this award for spotting $MWIDE. Although how the set-up played out was far from optimal, it is this kind of preparation that sets up a trader to be a consistent performer. Let’s take a closer look at his analysis. See his post here: https://www.investagrams.com/Post/dannie_rose/1037196.

He noted how there was an RSI bullish divergence. An RSI bull div happens when price closers lower, yet the RSI indicator forms a higher low. This is often a sign that a counter-trend reaction may occur as the higher low signifies that the downward momentum is not as strong as buyers are showing up. However, it should be noted that a bullish divergence is not the buy signal itself, but rather a warning sign that a move may occur. This is where Eureka Trader identifies that $MWIDE formed a candlestick SOR (Sign of Reversal) accompanied by high volume – a good sign that there is buying interest. The entry, cut point, and targets are all at support and resistance levels based on moving averages and key levels.

Looking into how the trade played out, it can be seen how unfavorable the price action was for traders.

Right from the open, price skipped the entry point and gapped up all the way to PHP5.41. $MWIDE then became volatile as it would swing in a 5% range. Volatility would die down before eventually dropping lower and even forming a lower low on the daily timeframe.

Nevertheless, there is still merit to the analysis and preparation as the bias for an upward surge was correct. There was still an opportunity for around a 10% gain.

Whether or not Eureka Trader made tweaks and profited from this trade, we would like to commend him for his work because as what was previously mentioned, it is this kind of effort that leads to consistently profitable traders. It’s either you win, or you learn.

The Team Player

Trading is tough, which is why it’s always nice to have people to help you. This featured trader has been a positive force for the community. We would like to congratulate Jan S for being the team player of the week!

Despite joining just this April, Jan S has been consistently helping fellow traders. In a short period of time, he has already amassed more than 150 posts sharing helpful insights as an equity research analyst.

It is evident that he is a continuous learner as well as he stays tuned to the Investa Charting Sessions. He even takes note of his insights and shares them with others.

Commended, sir. We hope you continue to share your learnings to the community.

As a sign of our gratitude to these Featured Traders of the week, we will be giving them FREE one-month InvestaPro access. Congratulations, and keep up the good work!

Subscribe to our Newsletter

Join our mailing list for investing tips and stock market advice
to help you reach your first million.

You have Successfully Subscribed!